Capital Structure Determinants: Manufacturing Companies in Sri Lanka
VerifiedAdded on 2022/05/18
|13
|3659
|26
Report
AI Summary
This report presents the methodology used to analyze the determinants of capital structure in listed manufacturing companies on the Colombo Stock Exchange (CSE) in Sri Lanka. The study focuses on the period from 2014 to 2018, examining the impact of factors like profitability, capital intensity, tangibility of assets, non-debt tax shield, and firm size on capital structure, specifically debt-to-equity ratio, long-term leverage, and total leverage. The research employs a quantitative approach, utilizing secondary data from annual reports and CSE publications. The methodology includes descriptive statistics (mean, mode, median), correlation analysis, and multiple regression analysis using the E-views software package to test the formulated hypotheses. The report outlines the population (manufacturing sector with 41 companies), the sample (20 companies), and the data collection process. The analysis aims to identify the significant relationships and impacts between the independent variables (determinants) and the dependent variables (capital structure measures), providing insights into the financial decision-making processes of these companies. The study sets the upper level of statistical significance for hypothesis testing at 5% (0.05).
CHAPTER 03
METHODOLOGY
“DETERMINANTS OF CAPITAL STRUCTURE: SPECIAL
REFERENCE TO LISTED MANUFACTURING
COMPANIES OF COLOMBO STOCK
EXCHANGE(CSE),SRI LANKA”
S.MADHUSHIKA SENEVIRATHNE
2015/BAD/202
METHODOLOGY
“DETERMINANTS OF CAPITAL STRUCTURE: SPECIAL
REFERENCE TO LISTED MANUFACTURING
COMPANIES OF COLOMBO STOCK
EXCHANGE(CSE),SRI LANKA”
S.MADHUSHIKA SENEVIRATHNE
2015/BAD/202
Paraphrase This Document
Need a fresh take? Get an instant paraphrase of this document with our AI Paraphraser
1
CHAPTER 03
METHODOLOGY
3.1 Introduction
This chapter clearly describes as how to collect data from where and in which way. It also tells
about samples, dependent variable and independent variables how to evaluate and described. And
also this is explains the data collection procedure, research method and measurement,
operationalization and hypotheses.
This chapter deals with the conceptualization and methodology used in collection of sufficient data
and information from the data sources, and the steps and procedures involved in transferring from
into managerial information to drive findings and take decisions.
This chapter is most important to this study because the techniques discussed in this chapter guided
the researcher in the collection and analysis of the actual data. Further, this chapter presents an
output of the previous chapters; introduction, literature review and input to the next chapter on
data presentation and analysis.
3.2 Geographical and Demographical Profile
The Democratic Socialist Republic of Sri Lanka is an island in the Indian Ocean, which lies off
the south-eastern tip of the Indian subcontinent and consists of a total area of 65610 sq km (25,332
square miles). Sri Lanka is divided into 9 provinces and 25 districts. Among them Jaffna district
is located in the far north of Sri Lanka in Northern Province and occupies most of the Jaffna
peninsula. It has an area of 1025 square kilometres (395.8 sq Miles).
Sri Lanka had a population of 21.052 million in 2018 (August). Among them 10.39 million
(49.3%) were male and 10.66 million (50.7%) were female. The population destiny in Sri Lanka
is 334 per Km2 (865 people per mi2). Population growth rate was 0.8 dependency ratio was 51.23.
(Department of Census & statistics, 2018).
2
3.3 Organizational Profile
Colombo Stock Exchange (CSE) has 297 companies representing 20 business sectors as at 31st
December 2018, with market capitalization of Rs. 2,839.45 Bn. Public companies incorporated
under the Companies Act No. 7 of 2007 or any other statutory corporation, incorporated or
established under the laws of Sri Lanka or established under the laws of any other state (subject to
Exchange Control approval) are eligible to seek a listing on the Colombo Stock Exchange to raise
debt or equity. Companies desiring to be admitted to the official list of the Exchange and to secure
a listing of their securities will be required to comply with the relevant provisions of the above act
and the Securities and Exchange Commission Act No.36 of 1987 (as amended) and the Listed
Rules of the Exchange.
The CSE is a company limited by guarantee, established under the Companies Act No.17 of 1982
and is licensed by the Securities and Exchange Commission of Sri Lanka (SEC). The CSE in a
mutual exchange and has 15 full members and 15 trading members licensed to trade both equity
and debt securities, while six members are licensed to trade debt securities only. All members are
licensed by the SEC to operate as stockbrokers. All members are corporate entities and some are
subsidiaries of large financial institutions. (www.cse.lk)
One of the major sectors is manufacturing sector. That includes 41 companies. GDP from
manufacturing Sri Lanka decreased to 348,130 LKR Million in the fourth quarter of 2018 from
389,558 LKR Million in the third quarter of 2018. So the manufacturing products provide higher
contribution to the Sri Lankan Gross Domestic Products. (www.tradingeconomics.com, Sri-
Lanka)
3.4 Research Design
This research tried to outline the determinants of capital structure in listed manufacturing
companies in Sri Lanka. This was a broad study which collected data from manufacturing sector.
Data on determinants of capital structure were collected from secondary sources an Annual
Reports of Manufacturing companies and Colombo Stock Exchange Publications for the periods
2014 to 2018.
⊘ This is a preview!⊘
Do you want full access?
Subscribe today to unlock all pages.
Trusted by 1+ million students worldwide
3
Independent variable of this study is determinants such as profitability, capital intensity, tangibility
of assets, Non debt tax shield, firm size and dependent variable is debt to equity, long term leverage
and total leverage was used to identify the impact and relationship between determinants of capital
structure of listed manufacturing companies of Colombo Stock Exchange.
The data for this analysis used the cross sectional and time series data (Balanced panel data) for
41 companies during the period from 2014 to 2018.
3.5 Population
The Colombo Stock Exchange has 297 companies representing 20 business sectors as at 31st
December 2018. Among all of those sectors only manufacturing sector was selected as the
population for the study purpose. And there are 41 companies listed under manufacturing sector
on the Colombo Stock Exchange.
3.6 Sample
As mentioned above the target population of this study includes 41 listed manufacturing
companies. Then as per the data availability, 20 manufacturing companies have been selected as
the sample.
3.7 Data collection
The source of secondary data was adopted for the sampled data collection of this research study.
Necessary data was collected from 20 listed manufacturing companies ‟ annual reports (based on
availability of data) over 5 years ( 2014, 2015, 2016, 2017 & 2018).
In this study, the data was collected by using the secondary sources, such as:
Annual reports of the sample listed manufacturing companies.
Journals of the listed manufacturing companies in Sri Lanka.
Hand book of the listed companies in Sri Lanka published by Colombo Stock Exchange.
Websites of the listed manufacturing companies and Colombo Stock exchange.
Secondary data for the study were drawn from audited accounts (i.e. income statements and
balance sheets) of the concerned companies as fairly accurate and reliable. Therefore these data
may be considered reliable for the study.
Paraphrase This Document
Need a fresh take? Get an instant paraphrase of this document with our AI Paraphraser
4
3.8 Methods of Analysis
In this research, use quantitative approach as main analysis tool. Since numerical and secondary
data is used quantitative approach is considered to be a suitable approach for the study. Statistical
analyses are used to describe an account for the observed variability in the data. This involves the
process of analyzing the data that has been collected. Thus the purpose of statistic is to summarize
and answer questions that were obtained in the research.
The collected data was interpreted and simplified to make them eligible for the research purpose.
The data analysis for the proposed research was performed with E-views computer package. The
model shows the relationship between determinants and capital structure as well as impact of
determinants on capital structure. Determinants such as profitability, capital intensity, tangibility
of assets, non debt tax shield and firm size are the independent variables whereas long term
leverage is the dependent variable.
And also for the analysis used both descriptive method (mean, mode & median) and inferential
method (correlation analysis & regression analysis). The upper level of statistical significance for
hypothesis testing was set at 5% (0.05).
3.8.1 Descriptive Statistics
Descriptive statistics are used to describe and summarize the behavior of the variables in a study.
It is include the numbers, tables, and graphs used to describe, organize, summarize, and present
raw data. Descriptive statistics are most often used to examine: Central tendency (location)
measures of data where data tend to fall, as measured by the mean, median, and mode. The mean
may not always be the best measure of central tendency, especially if data are skewed.
Standard deviation is expressed as the positive square root of the variance. It is the average
difference between observed values and the mean. The standard deviation is used when expressing
dispersion in the same units as the original measurements.
3.8.2 Inferential Statistics
Inferential statistics are used to draw conclusions about the reliability and generalizability of the
findings (Kleczyk, 2012). In order to test the research hypotheses; the inferential tests used include
the Pearson’s coefficient of correlation and Regression analysis.
5
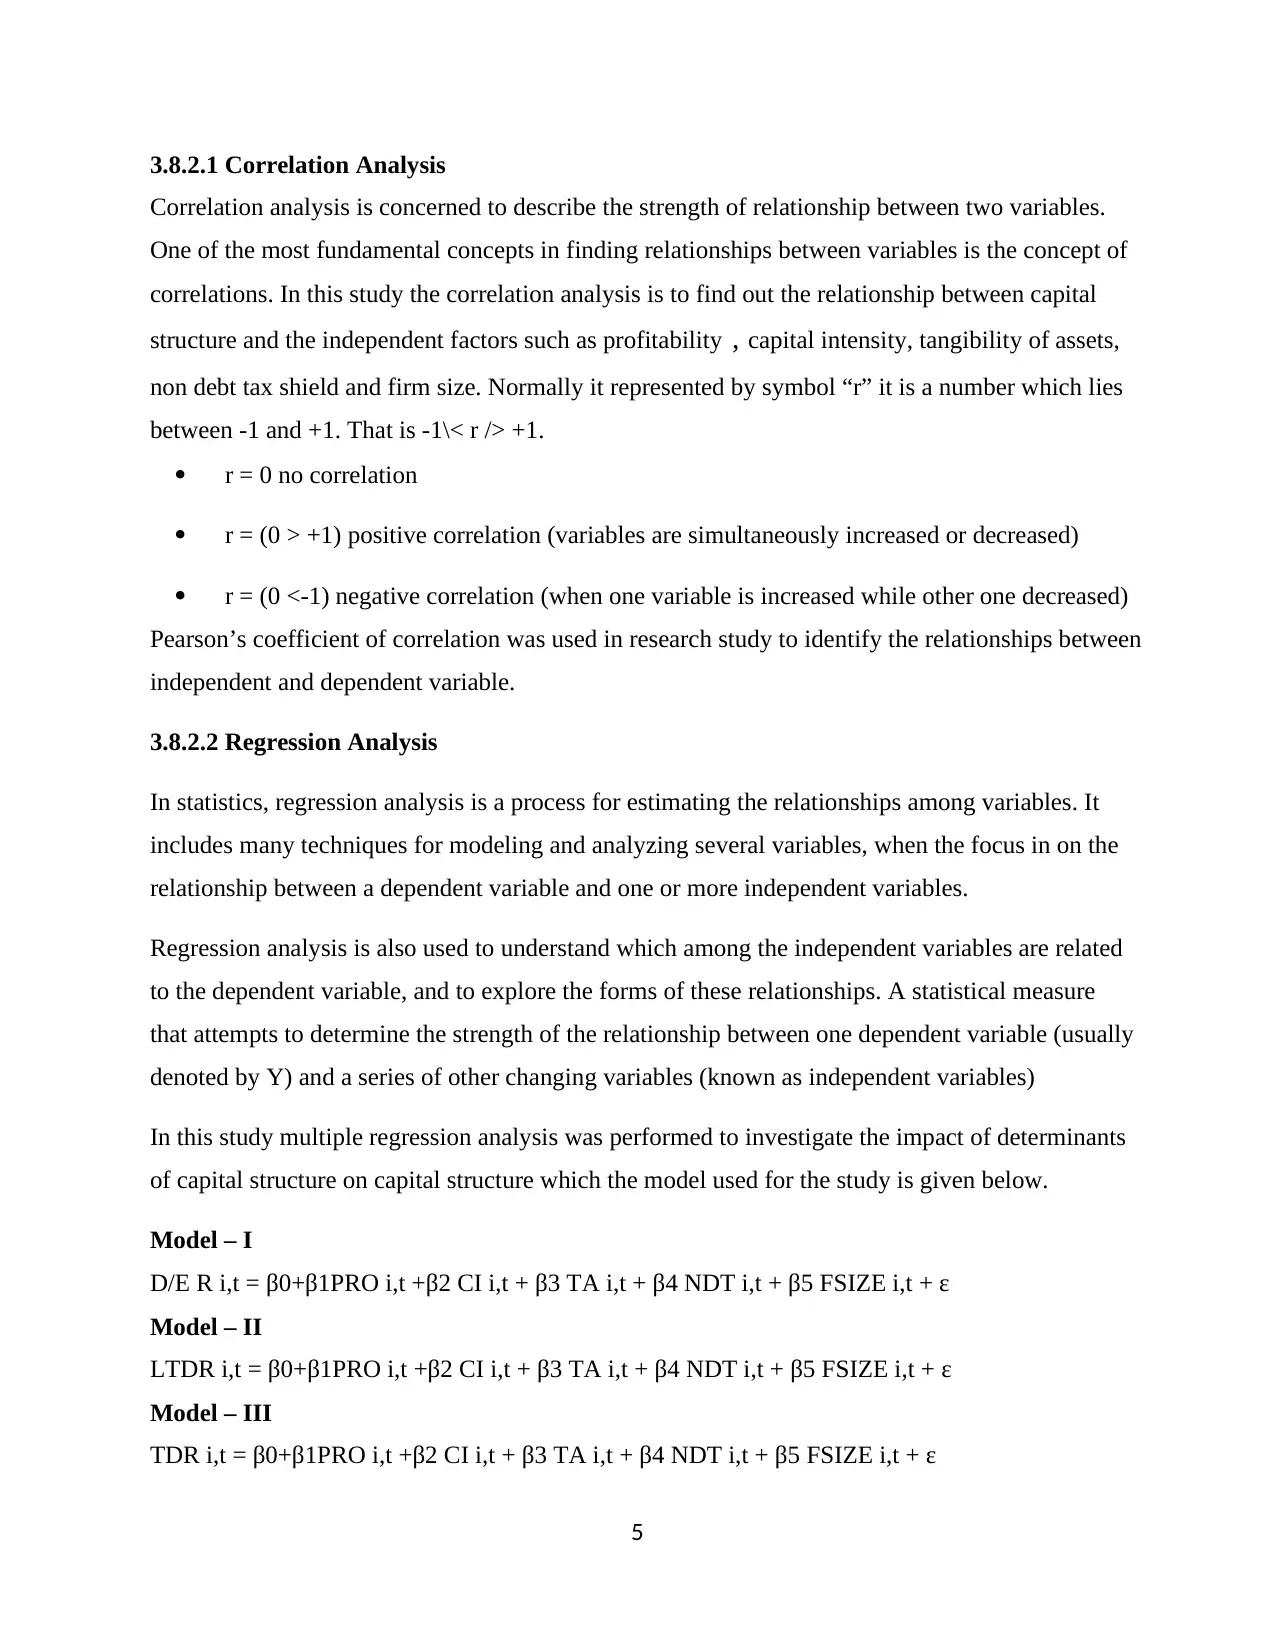
3.8.2.1 Correlation Analysis
Correlation analysis is concerned to describe the strength of relationship between two variables.
One of the most fundamental concepts in finding relationships between variables is the concept of
correlations. In this study the correlation analysis is to find out the relationship between capital
structure and the independent factors such as profitability , capital intensity, tangibility of assets,
non debt tax shield and firm size. Normally it represented by symbol “r” it is a number which lies
between -1 and +1. That is -1\< r /> +1.
r = 0 no correlation
r = (0 > +1) positive correlation (variables are simultaneously increased or decreased)
r = (0 <-1) negative correlation (when one variable is increased while other one decreased)
Pearson’s coefficient of correlation was used in research study to identify the relationships between
independent and dependent variable.
3.8.2.2 Regression Analysis
In statistics, regression analysis is a process for estimating the relationships among variables. It
includes many techniques for modeling and analyzing several variables, when the focus in on the
relationship between a dependent variable and one or more independent variables.
Regression analysis is also used to understand which among the independent variables are related
to the dependent variable, and to explore the forms of these relationships. A statistical measure
that attempts to determine the strength of the relationship between one dependent variable (usually
denoted by Y) and a series of other changing variables (known as independent variables)
In this study multiple regression analysis was performed to investigate the impact of determinants
of capital structure on capital structure which the model used for the study is given below.
Model – I
D/E R i,t = β0+β1PRO i,t +β2 CI i,t + β3 TA i,t + β4 NDT i,t + β5 FSIZE i,t + ε
Model – II
LTDR i,t = β0+β1PRO i,t +β2 CI i,t + β3 TA i,t + β4 NDT i,t + β5 FSIZE i,t + ε
Model – III
TDR i,t = β0+β1PRO i,t +β2 CI i,t + β3 TA i,t + β4 NDT i,t + β5 FSIZE i,t + ε
⊘ This is a preview!⊘
Do you want full access?
Subscribe today to unlock all pages.
Trusted by 1+ million students worldwide
6
Where,
PRO : Profitability
CI : Capital Intensity
TA : Tangibility of Assets
NDT : Non Debt Tax shield
FSIZE : Firm Size
β0 : constant variable
β1, β2, β3, β4, β5 : Model coefficients of variables
ε : Error term.
i,t : for firm i in period t
3.9 Hypotheses
The possible hypotheses are formulated based on conceptualization of the research problem and
research topic since the objective of this study to investigate the impact of determinants on capital
structure. Finally hypotheses are examined whether it is accepted or not.
If the H0 is rejected then the theory is congruent with practice and there is no gap. But if H0 is
accepted than there is a possibility of knowledge gap between theory and practice regarding the
influence of specific determinants on capital structure.
This research is conducted base on the following hypotheses.
H1: There is a significant relationship between determinants and capital structure.
H1a: There is a significant relationship between profitability and debt equity ratio.
H1b: There is a significant relationship between capital intensity and debt equity ratio.
H1c: There is a significant relationship between tangibility of assets and debt equity ratio.
H1d: There is a significant relationship between non debt tax shield and debt equity ratio.
H1e: There is a significant relationship between firm size and debt equity ratio.
H2: The determinants significantly impact on capital structure
H2a: profitability significantly impact on long term leverage.
H2b: Capital intensity significantly impact on long term leverage.
H2c: Tangibility of assets significantly impact on long term leverage.
H2d: Non debt tax shield significantly impact on long term leverage.
H2e: Firm size significantly impact on long term leverage.
Paraphrase This Document
Need a fresh take? Get an instant paraphrase of this document with our AI Paraphraser
7
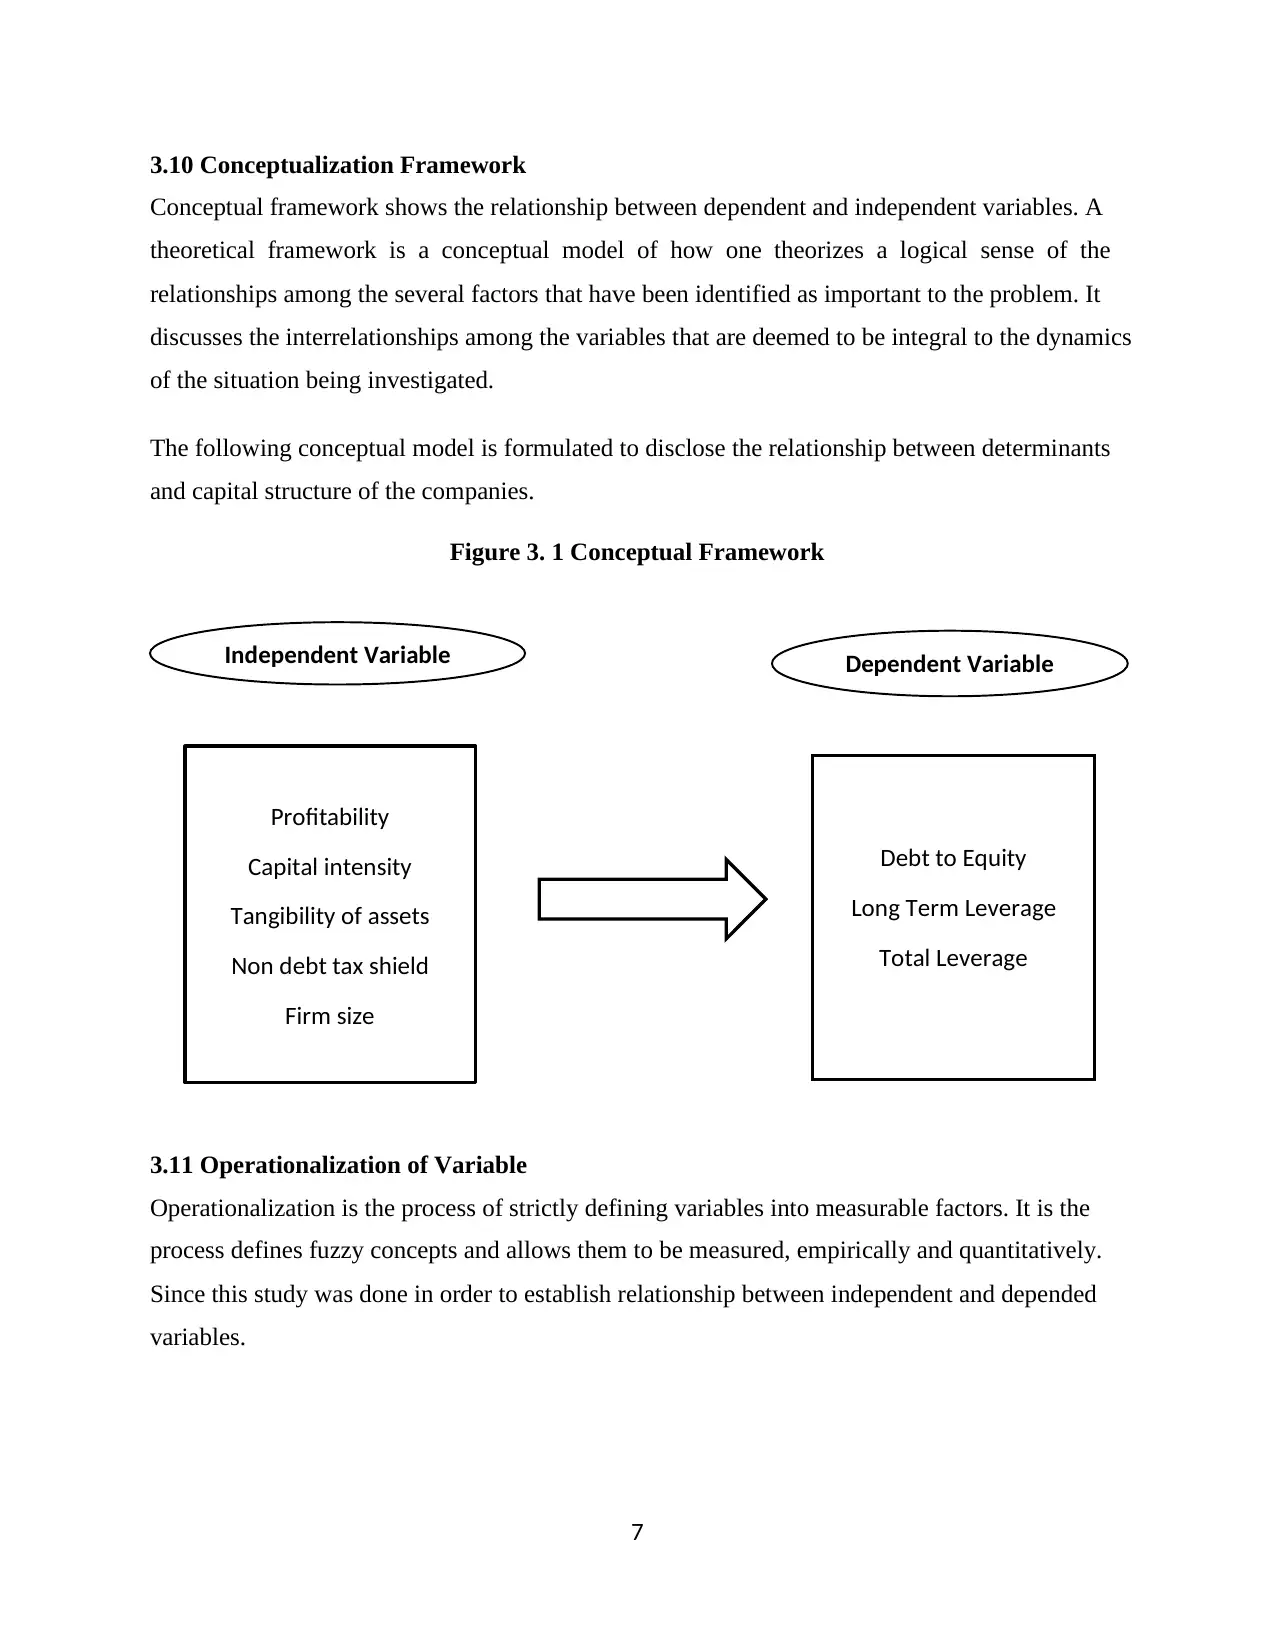
3.10 Conceptualization Framework
Conceptual framework shows the relationship between dependent and independent variables. A
theoretical framework is a conceptual model of how one theorizes a logical sense of the
relationships among the several factors that have been identified as important to the problem. It
discusses the interrelationships among the variables that are deemed to be integral to the dynamics
of the situation being investigated.
The following conceptual model is formulated to disclose the relationship between determinants
and capital structure of the companies.
Figure 3. 1 Conceptual Framework
3.11 Operationalization of Variable
Operationalization is the process of strictly defining variables into measurable factors. It is the
process defines fuzzy concepts and allows them to be measured, empirically and quantitatively.
Since this study was done in order to establish relationship between independent and depended
variables.
Dependent VariableIndependent Variable
Profitability
Capital intensity
Tangibility of assets
Non debt tax shield
Firm size
Debt to Equity
Long Term Leverage
Total Leverage
8
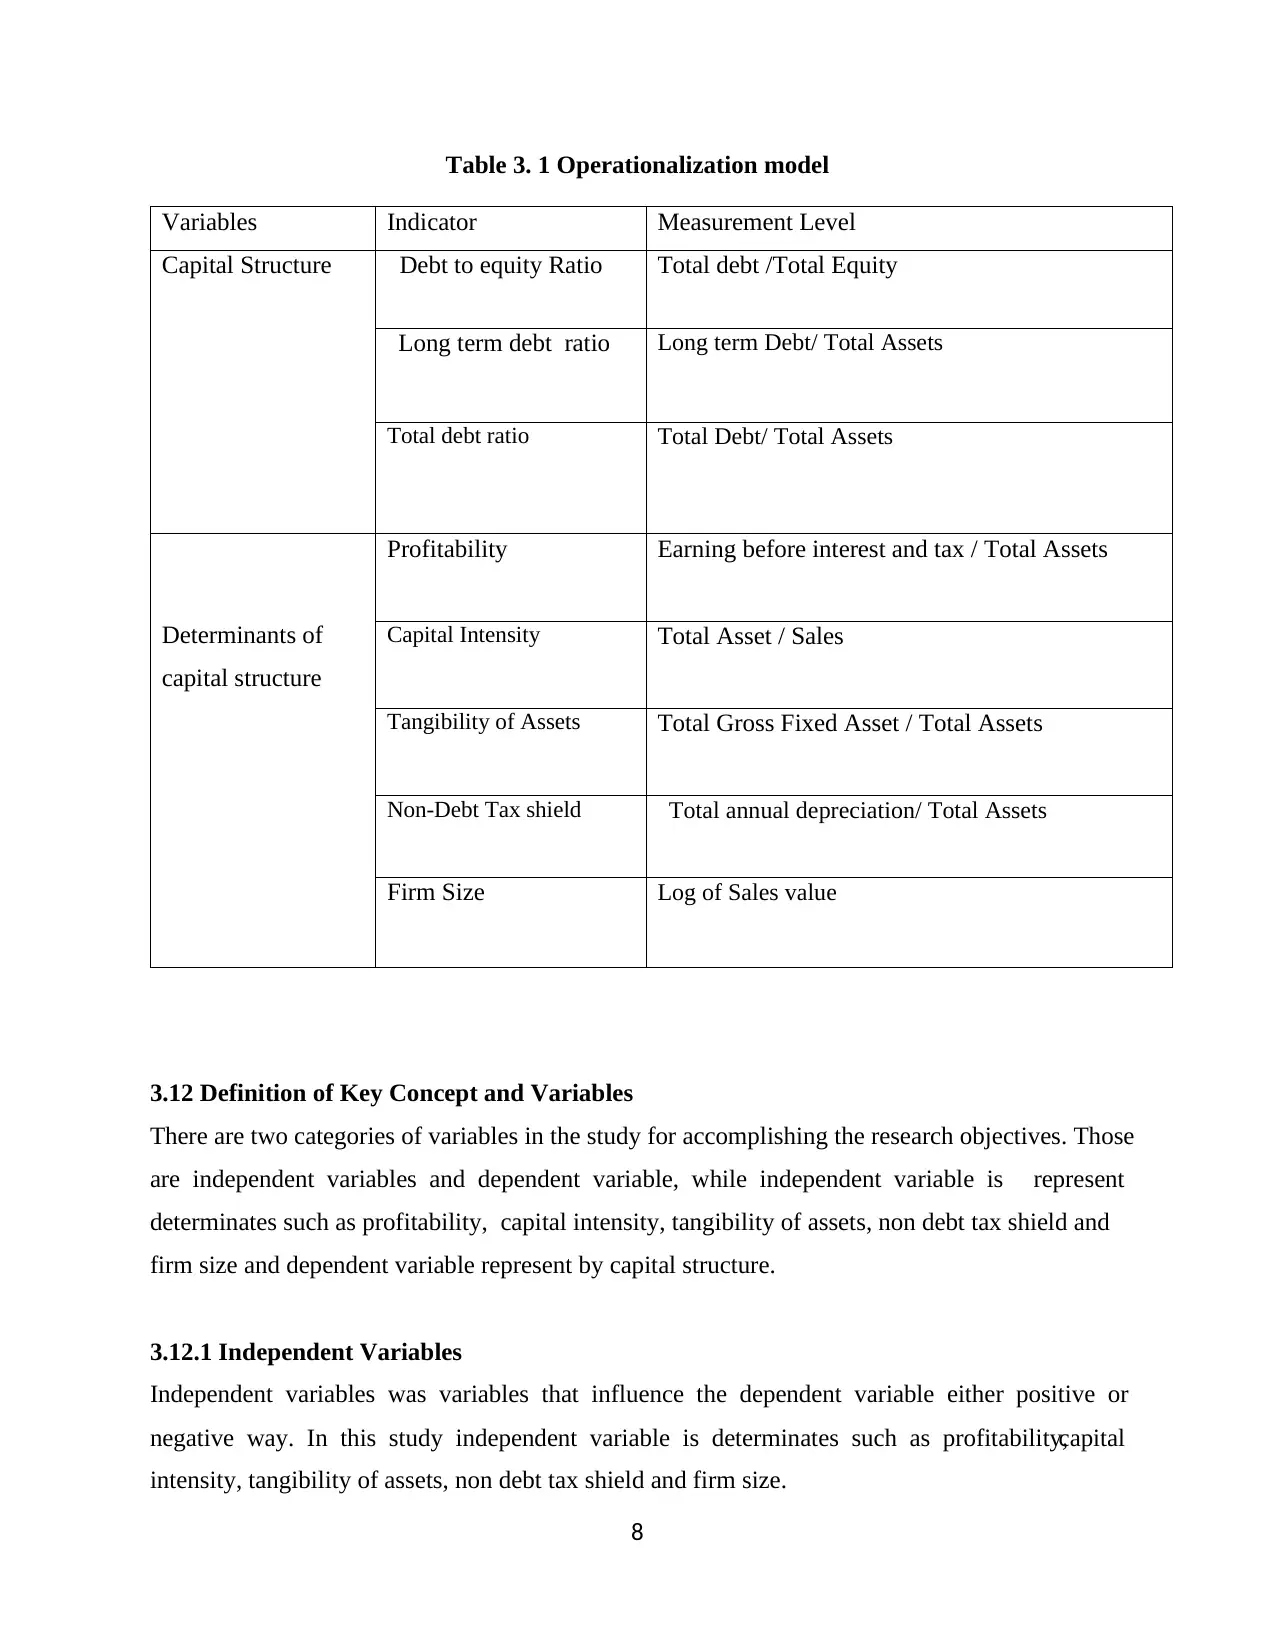
Table 3. 1 Operationalization model
3.12 Definition of Key Concept and Variables
There are two categories of variables in the study for accomplishing the research objectives. Those
are independent variables and dependent variable, while independent variable is represent
determinates such as profitability, capital intensity, tangibility of assets, non debt tax shield and
firm size and dependent variable represent by capital structure.
3.12.1 Independent Variables
Independent variables was variables that influence the dependent variable either positive or
negative way. In this study independent variable is determinates such as profitability,capital
intensity, tangibility of assets, non debt tax shield and firm size.
Variables Indicator Measurement Level
Capital Structure Debt to equity Ratio Total debt /Total Equity
Long term debt ratio Long term Debt/ Total Assets
Total debt ratio Total Debt/ Total Assets
Determinants of
capital structure
Profitability Earning before interest and tax / Total Assets
Capital Intensity Total Asset / Sales
Tangibility of Assets Total Gross Fixed Asset / Total Assets
Non-Debt Tax shield Total annual depreciation/ Total Assets
Firm Size Log of Sales value
⊘ This is a preview!⊘
Do you want full access?
Subscribe today to unlock all pages.
Trusted by 1+ million students worldwide
9
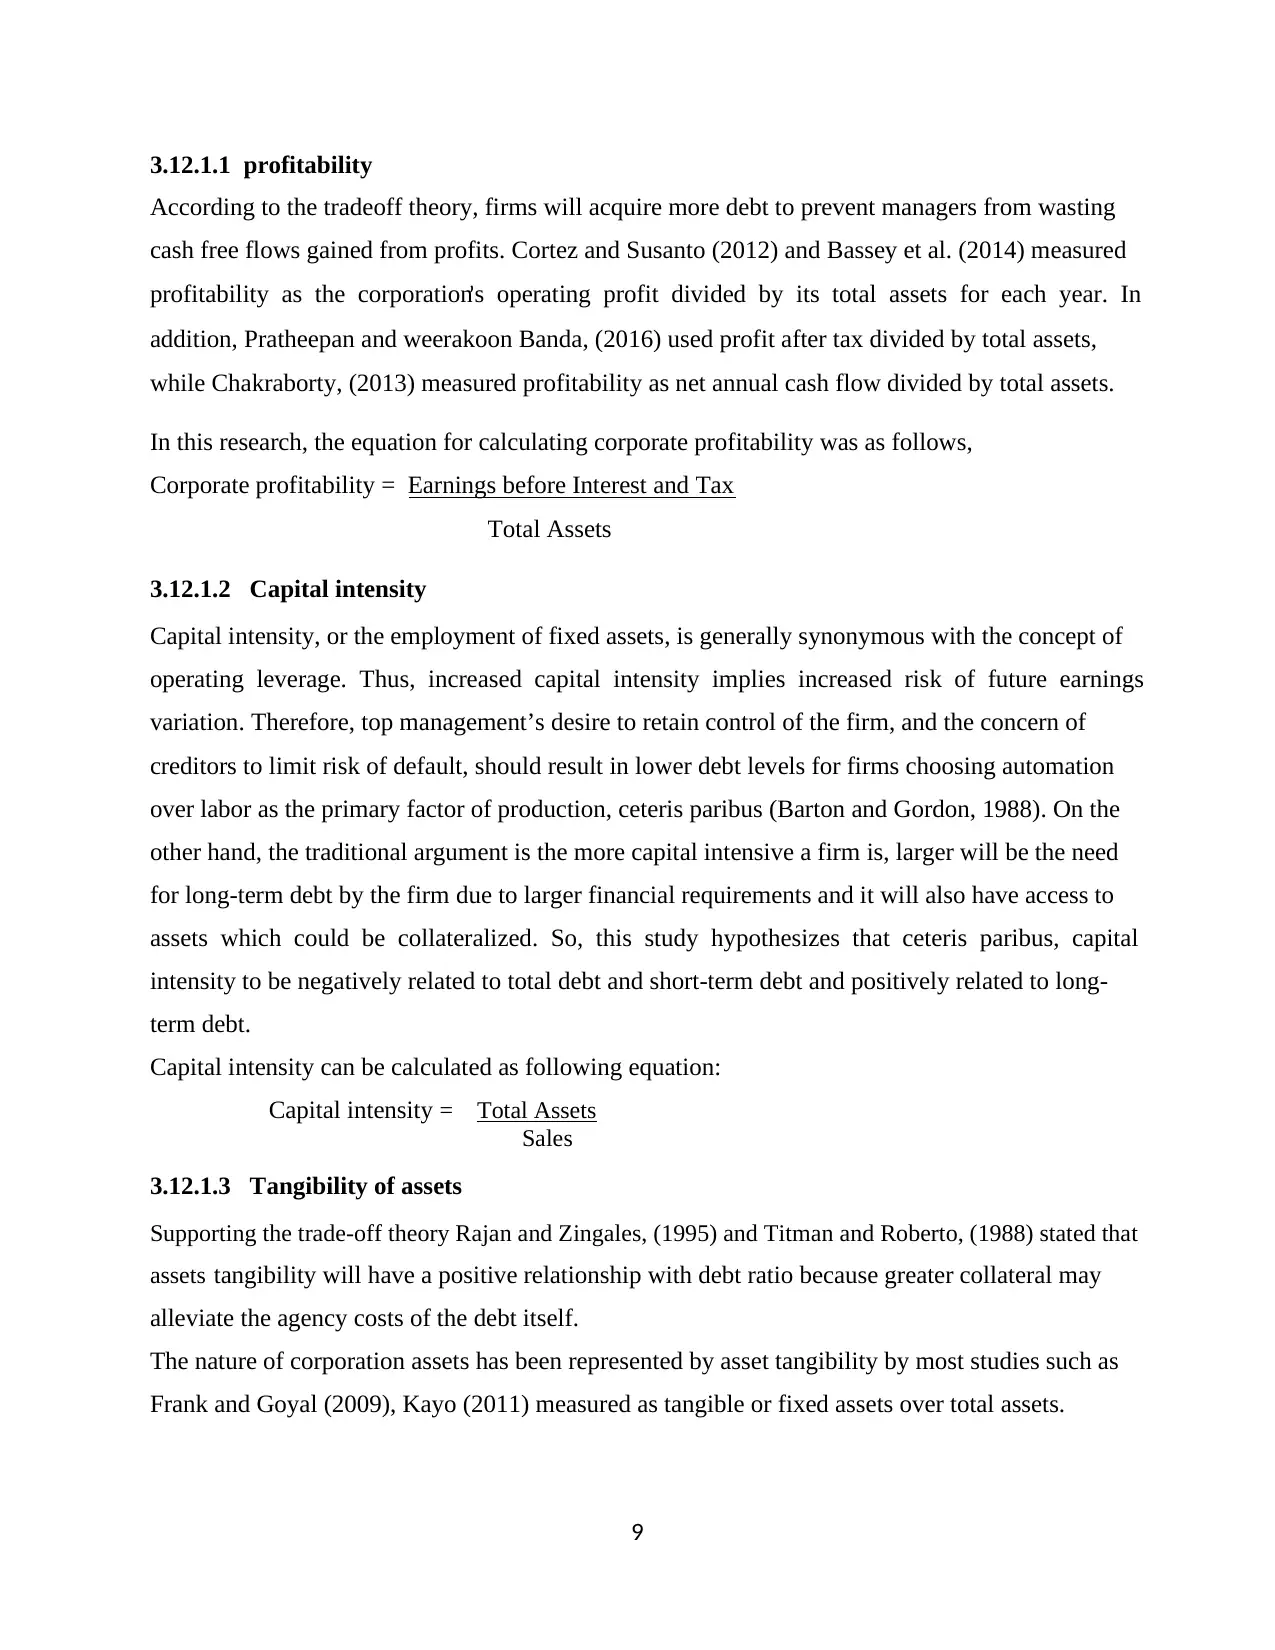
3.12.1.1 profitability
According to the tradeoff theory, firms will acquire more debt to prevent managers from wasting
cash free flows gained from profits. Cortez and Susanto (2012) and Bassey et al. (2014) measured
profitability as the corporation’s operating profit divided by its total assets for each year. In
addition, Pratheepan and weerakoon Banda, (2016) used profit after tax divided by total assets,
while Chakraborty, (2013) measured profitability as net annual cash flow divided by total assets.
In this research, the equation for calculating corporate profitability was as follows,
Corporate profitability = Earnings before Interest and Tax
Total Assets
3.12.1.2 Capital intensity
Capital intensity, or the employment of fixed assets, is generally synonymous with the concept of
operating leverage. Thus, increased capital intensity implies increased risk of future earnings
variation. Therefore, top management’s desire to retain control of the firm, and the concern of
creditors to limit risk of default, should result in lower debt levels for firms choosing automation
over labor as the primary factor of production, ceteris paribus (Barton and Gordon, 1988). On the
other hand, the traditional argument is the more capital intensive a firm is, larger will be the need
for long-term debt by the firm due to larger financial requirements and it will also have access to
assets which could be collateralized. So, this study hypothesizes that ceteris paribus, capital
intensity to be negatively related to total debt and short-term debt and positively related to long-
term debt.
Capital intensity can be calculated as following equation:
Capital intensity = Total Assets
Sales
3.12.1.3 Tangibility of assets
Supporting the trade-off theory Rajan and Zingales, (1995) and Titman and Roberto, (1988) stated that
assets tangibility will have a positive relationship with debt ratio because greater collateral may
alleviate the agency costs of the debt itself.
The nature of corporation assets has been represented by asset tangibility by most studies such as
Frank and Goyal (2009), Kayo (2011) measured as tangible or fixed assets over total assets.
Paraphrase This Document
Need a fresh take? Get an instant paraphrase of this document with our AI Paraphraser
10
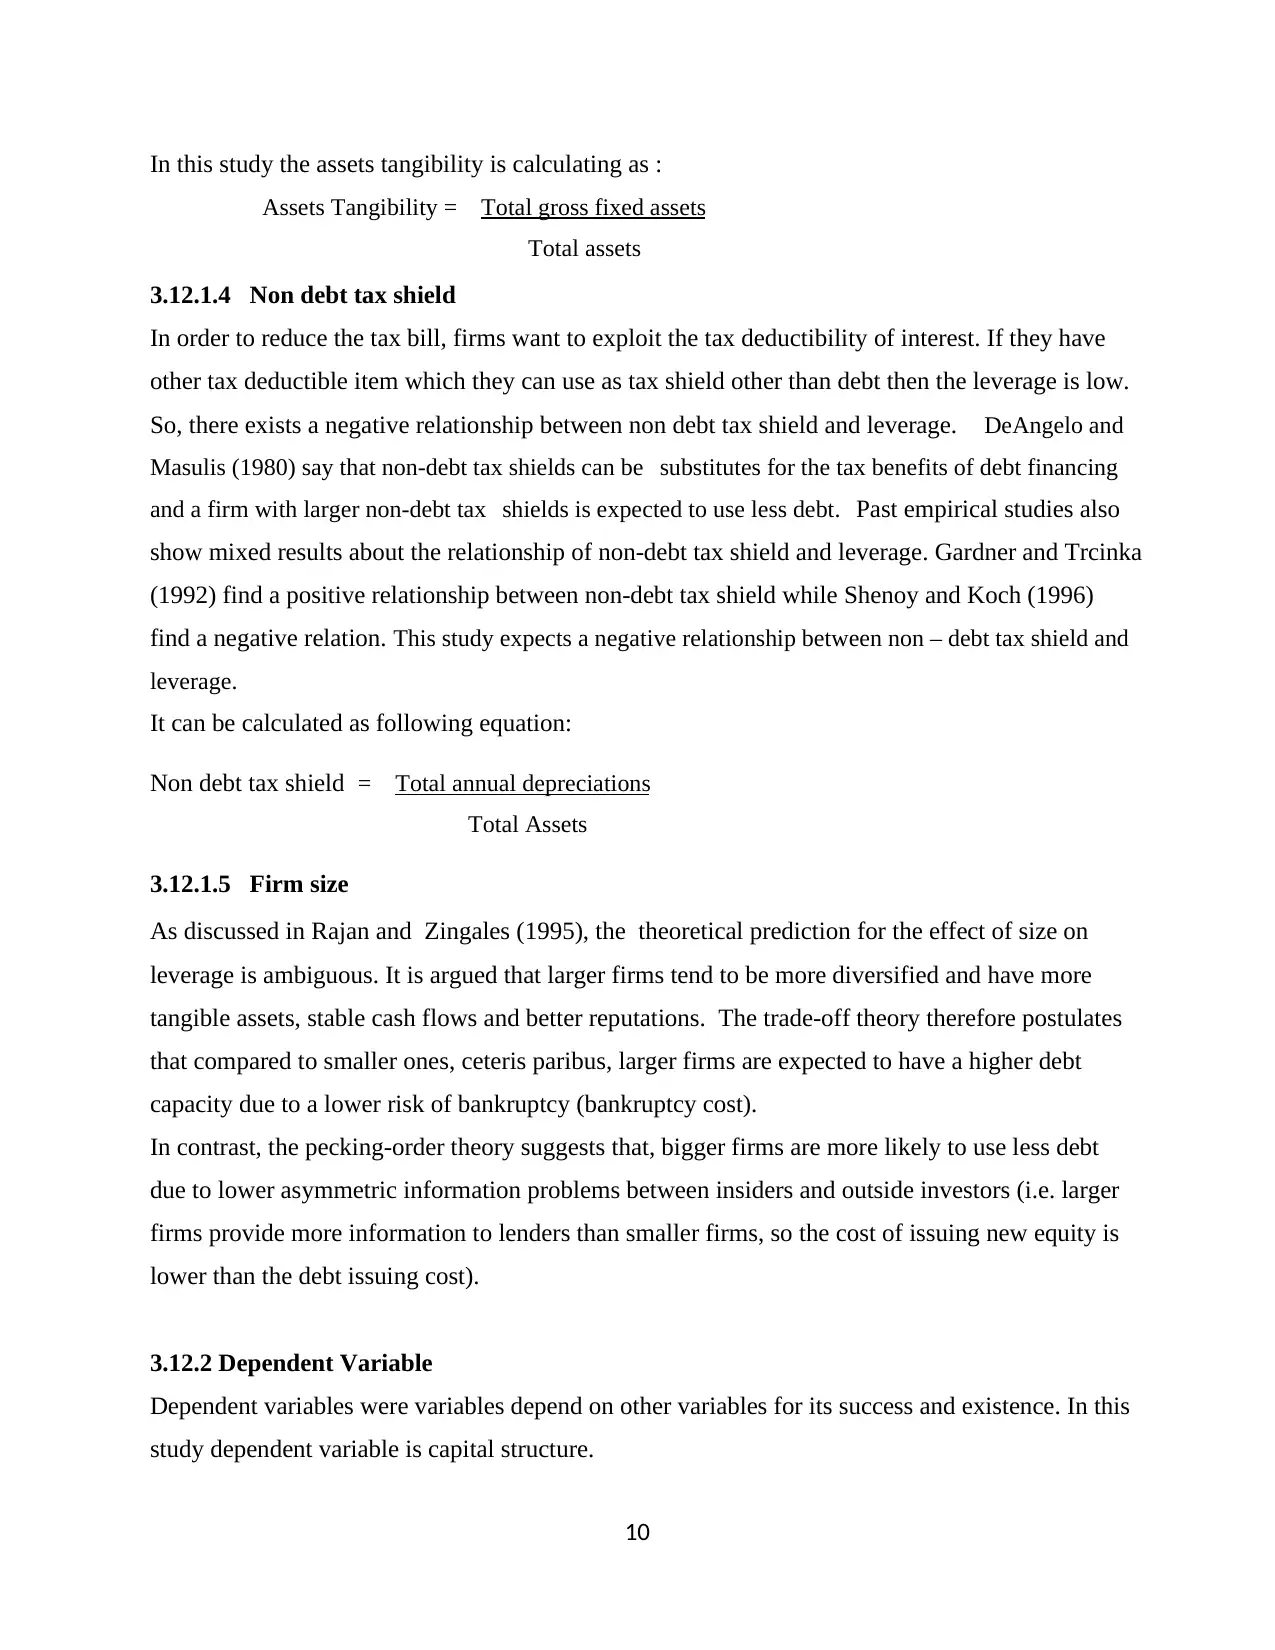
In this study the assets tangibility is calculating as :
Assets Tangibility = Total gross fixed assets
Total assets
3.12.1.4 Non debt tax shield
In order to reduce the tax bill, firms want to exploit the tax deductibility of interest. If they have
other tax deductible item which they can use as tax shield other than debt then the leverage is low.
So, there exists a negative relationship between non debt tax shield and leverage. DeAngelo and
Masulis (1980) say that non-debt tax shields can be substitutes for the tax benefits of debt financing
and a firm with larger non-debt tax shields is expected to use less debt. Past empirical studies also
show mixed results about the relationship of non-debt tax shield and leverage. Gardner and Trcinka
(1992) find a positive relationship between non-debt tax shield while Shenoy and Koch (1996)
find a negative relation. This study expects a negative relationship between non – debt tax shield and
leverage.
It can be calculated as following equation:
Non debt tax shield = Total annual depreciations
Total Assets
3.12.1.5 Firm size
As discussed in Rajan and Zingales (1995), the theoretical prediction for the effect of size on
leverage is ambiguous. It is argued that larger firms tend to be more diversified and have more
tangible assets, stable cash flows and better reputations. The trade-off theory therefore postulates
that compared to smaller ones, ceteris paribus, larger firms are expected to have a higher debt
capacity due to a lower risk of bankruptcy (bankruptcy cost).
In contrast, the pecking-order theory suggests that, bigger firms are more likely to use less debt
due to lower asymmetric information problems between insiders and outside investors (i.e. larger
firms provide more information to lenders than smaller firms, so the cost of issuing new equity is
lower than the debt issuing cost).
3.12.2 Dependent Variable
Dependent variables were variables depend on other variables for its success and existence. In this
study dependent variable is capital structure.
11
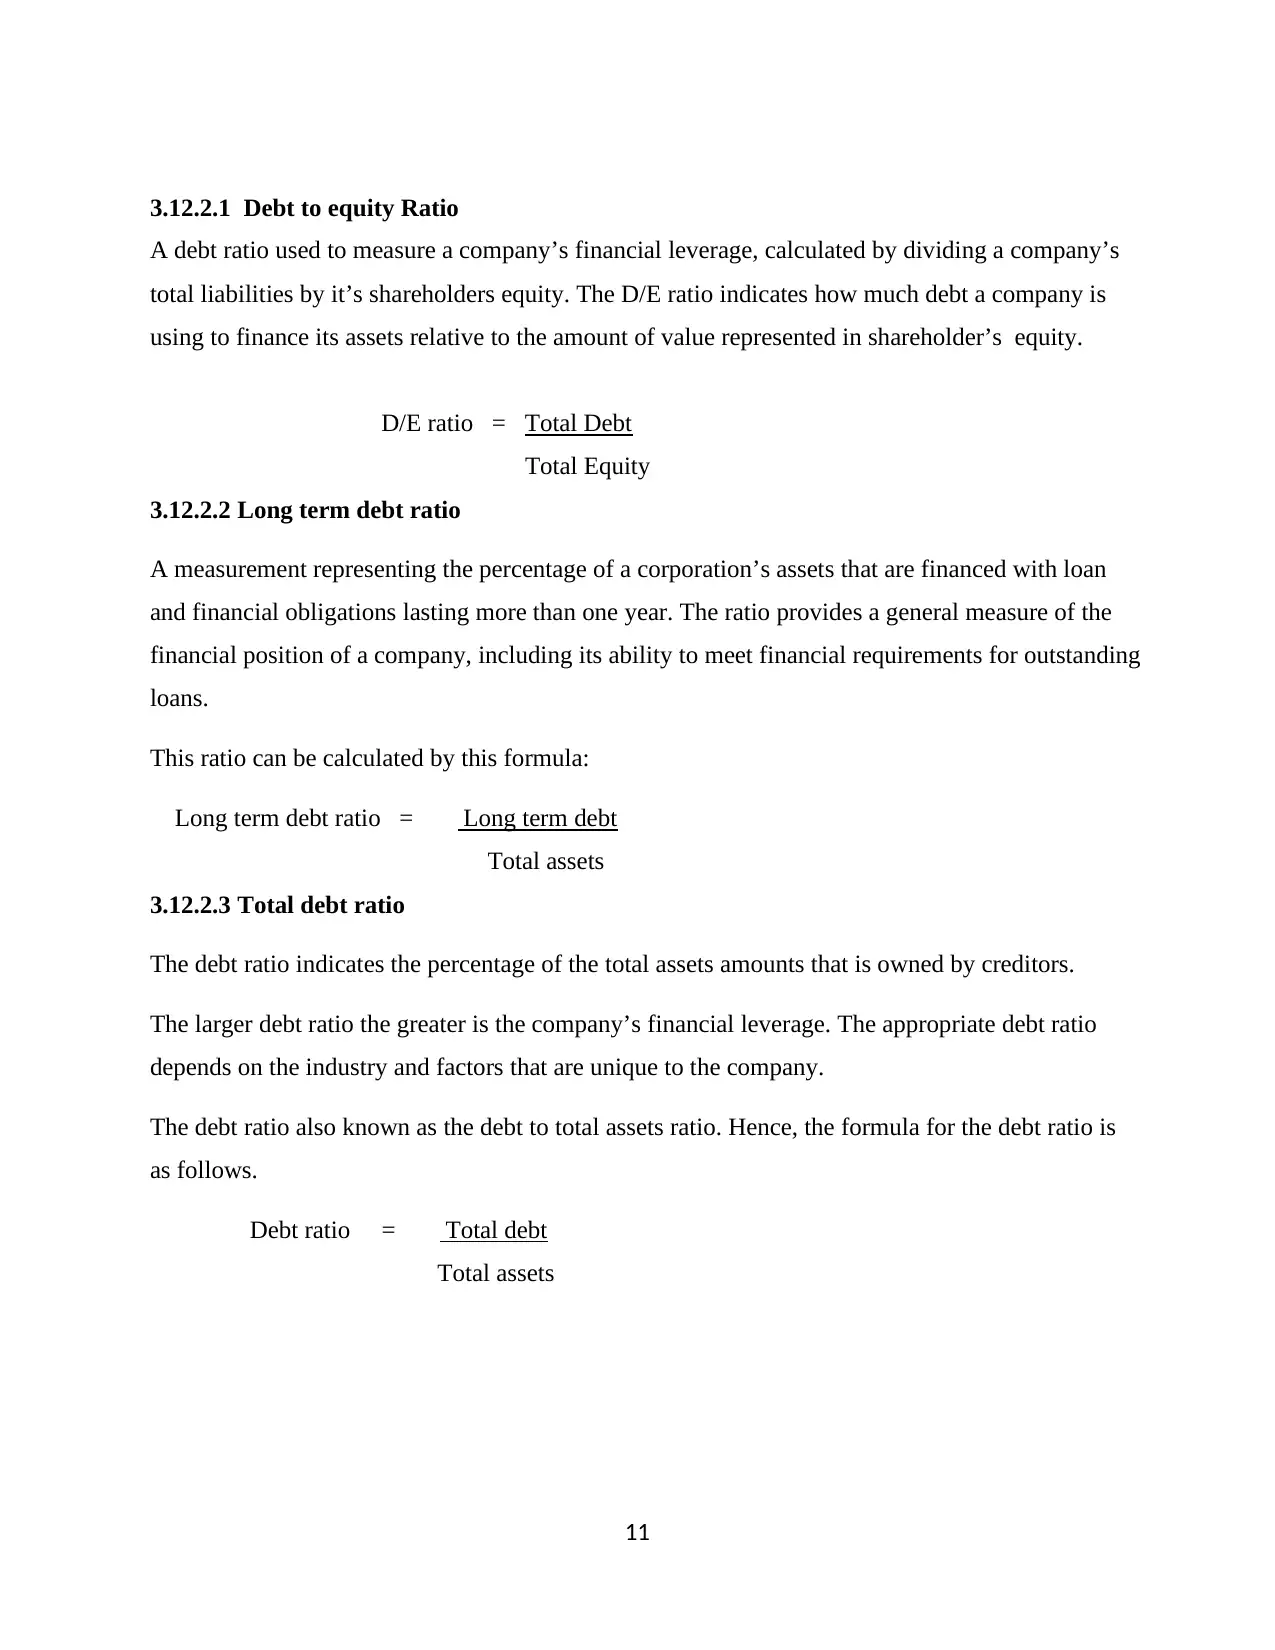
3.12.2.1 Debt to equity Ratio
A debt ratio used to measure a company’s financial leverage, calculated by dividing a company’s
total liabilities by it’s shareholders equity. The D/E ratio indicates how much debt a company is
using to finance its assets relative to the amount of value represented in shareholder’s equity.
D/E ratio = Total Debt
Total Equity
3.12.2.2 Long term debt ratio
A measurement representing the percentage of a corporation’s assets that are financed with loan
and financial obligations lasting more than one year. The ratio provides a general measure of the
financial position of a company, including its ability to meet financial requirements for outstanding
loans.
This ratio can be calculated by this formula:
Long term debt ratio = Long term debt
Total assets
3.12.2.3 Total debt ratio
The debt ratio indicates the percentage of the total assets amounts that is owned by creditors.
The larger debt ratio the greater is the company’s financial leverage. The appropriate debt ratio
depends on the industry and factors that are unique to the company.
The debt ratio also known as the debt to total assets ratio. Hence, the formula for the debt ratio is
as follows.
Debt ratio = Total debt
Total assets
⊘ This is a preview!⊘
Do you want full access?
Subscribe today to unlock all pages.
Trusted by 1+ million students worldwide
1 out of 13

Your All-in-One AI-Powered Toolkit for Academic Success.
+13062052269
info@desklib.com
Available 24*7 on WhatsApp / Email
![[object Object]](/_next/static/media/star-bottom.7253800d.svg)
Unlock your academic potential
Copyright © 2020–2026 A2Z Services. All Rights Reserved. Developed and managed by ZUCOL.