An Empirical Analysis of Happiness Determinants: European Data
VerifiedAdded on 2023/04/20
|22
|5876
|391
Report
AI Summary
This report investigates the determinants of happiness, or subjective well-being (SWB), using data from the European Value Study (EVS) across nine European countries from 2008 to 2010. The research explores the impact of various factors, including income, education, employment status, age, and gender, on individuals' happiness levels. The report reviews existing literature, including the Easterlin Paradox, which suggests a negative relationship between income growth and happiness. It also considers studies that contradict this, showing a positive correlation between income and SWB. Furthermore, the study uses the Ordered Probit Model to analyze the data and determine the influence of both monetary and non-monetary factors. The report also examines the roles of education, employment, age, and gender as non-monetary determinants of happiness, referencing relevant studies and theories to support the analysis. The findings aim to provide empirical evidence on how these factors collectively shape the SWB of individuals across different European countries.
1 Introduction
This research seeks to understand how the different
determinants of happiness as income level of an individual,
education, employment status, people's age and gender have an
impact on their level of happiness or their subjective well being
(SWB). For this purpose, this paper presents empirical evidence
for the determinants of happiness using the European value study
(EVS). The different factors are thoroughly looked in the literature
part which includes some studies show the correlation between the
SWB and these factors. Easterlin (1974) examined the hypothesis
of Esterline paradox which shows the negative relation between
income growth and happiness level. However, some studies as
Frijters, Haisken- DeNew and Shields ( 2004) shows that income
has positive effect on SWB across Europe. Other studies show
how the happiness level vary across the European countries
depends on the change of the determinants of happiness, the
study of Caporale et al, (2009) reports that western European
countries show higher level of happiness compare to eastern
European countries.
In order to support the research, data has been collected from nine
different European countries from 2008 to 2010 and compared
with each other.The structure of this paper is as follow. Section 2
provides an explanation of literature on the determinants of
happiness. Section 3 describes the methodology model and the
data used in this research. Section 4 shows the empirical results
based on these data, and finally section 5, the conclusion.
Paraphrase This Document
Need a fresh take? Get an instant paraphrase of this document with our AI Paraphraser
2 literature Review
2.1 Income effect
There is some evidence of an existing correlation between
happiness and other factors such as income, education,
employment and others (Frey and Stutzer, 2018). One of the
fundamental issues of economics is to explain whether income is
related to happiness. Some studies as Frijters, Haisken-DeNew
and Shields ( 2004) shows that income is correlated with
happiness and that the money plays a significant role in impacting
the well-being of people's life. However, the study of Easterlin
(1974) argues that income is not correlated with happiness; it
shows that the happiness level is not necessarily increase as the
income level increases. And that happiness level stays flat even
with a positive growth of the real income or society’s economic.
This aspect is known as the Easterlin Paradox. There are many
studies which support this finding; the relation between income
and happiness is negligible or non-existent as (Diener and Biswas-
Diener, 2002; Diener, et al., 1993)
There are some theories that explain the finding of Easterlin
Paradox. The first theory explains that is the adaptation theory, it
states that people get adapted to their income. In other words,
people get used to their income and economic situation, so if there
are any changes to their income, it would only have a transient
effect on their happiness or SWB ( Easterlin, 2001). Adaptation
could be explained as; the most important aspects of life have
small effect on people's happiness. This is referred to the
hypothesis of "hedonic treadmill" (Loewenstein and Ubel, 2008).
The second explanation of this finding is the theory of relative
income. Some studies as Clark and Oswald (1996) show that
relative income determine utility rather than absolute income.
People care more about relative income than absolute income
because it has more impact on happiness. It tells how the person
feels about her or his income relative to the other’s income. This
explains why well-being does not increase despite the increase in
income. So this comparison of the economic situation with the
others could weaken the relation between happiness and income
which could be observed only through absolute income.
Furthermore, a study done by Rojas (2007) explains the
conceptual-referent theory of happiness (CRT); it argues that a
weak relationship exists between the well-being of a person and
his or her income level. This theory explains that people have
different concept about what represent a happy or good life. This
weak relationship could be explained by that the income is not the
most important thing for some people and that happiness comes
from within a person and not from material things.
On the other hand, several studies contradict the idea of the
Easterlin Paradox; the negative relationship between wellbeing of
a person and the level of income. A study done by Frijters,
Haisken-DeNew and Shields (2004) reports that as real income
increases, the happiness of an individual increases by about 35 to
40 percent in East Germany. Furthermore, by collecting data of
some countries, the studies show that there is a positive
relationship between SWB and income in both developing and
⊘ This is a preview!⊘
Do you want full access?
Subscribe today to unlock all pages.
Trusted by 1+ million students worldwide
developed countries (Stevenson and Wolfers, 2008). In fact, the
happiness level of a person increase as the Gross Domestic
Product per capita of the economy increases. However,other
studies rebut the argument of Stevenson and Wolfers (2008) and
show that there is no relation between happiness and income at
least in the long run; however, in the short run the evidence show
a positive relation between them (Easterlin and Angelescu, 2009).
Other studies focus on the relation between happiness with
relative and absolute income. They show that the happiness level
of an individual is influenced more by relative income than
absolute income as discussed before (Clark and Oswald, 1996).
However, other studies as Caporale et al, (2009) argues that the
two sides of income; relative and absolute have insignificant or
negligible effect on SWB compared to the non-monetary factors.
2.2 Non-monetary determinants
There are also certain non-monetary factors that determine the
level of happiness of an individual such as the level of education
received by a person, the employment status of an individual, his
or her age and gender and others (Frey and Stutzer, 2018).
Education
Education is an important determinant of happiness and
important factor for people’s life. There are several variables which
usually effect education, such variables as health and income.
There is positive correlation between education and these two
Paraphrase This Document
Need a fresh take? Get an instant paraphrase of this document with our AI Paraphraser
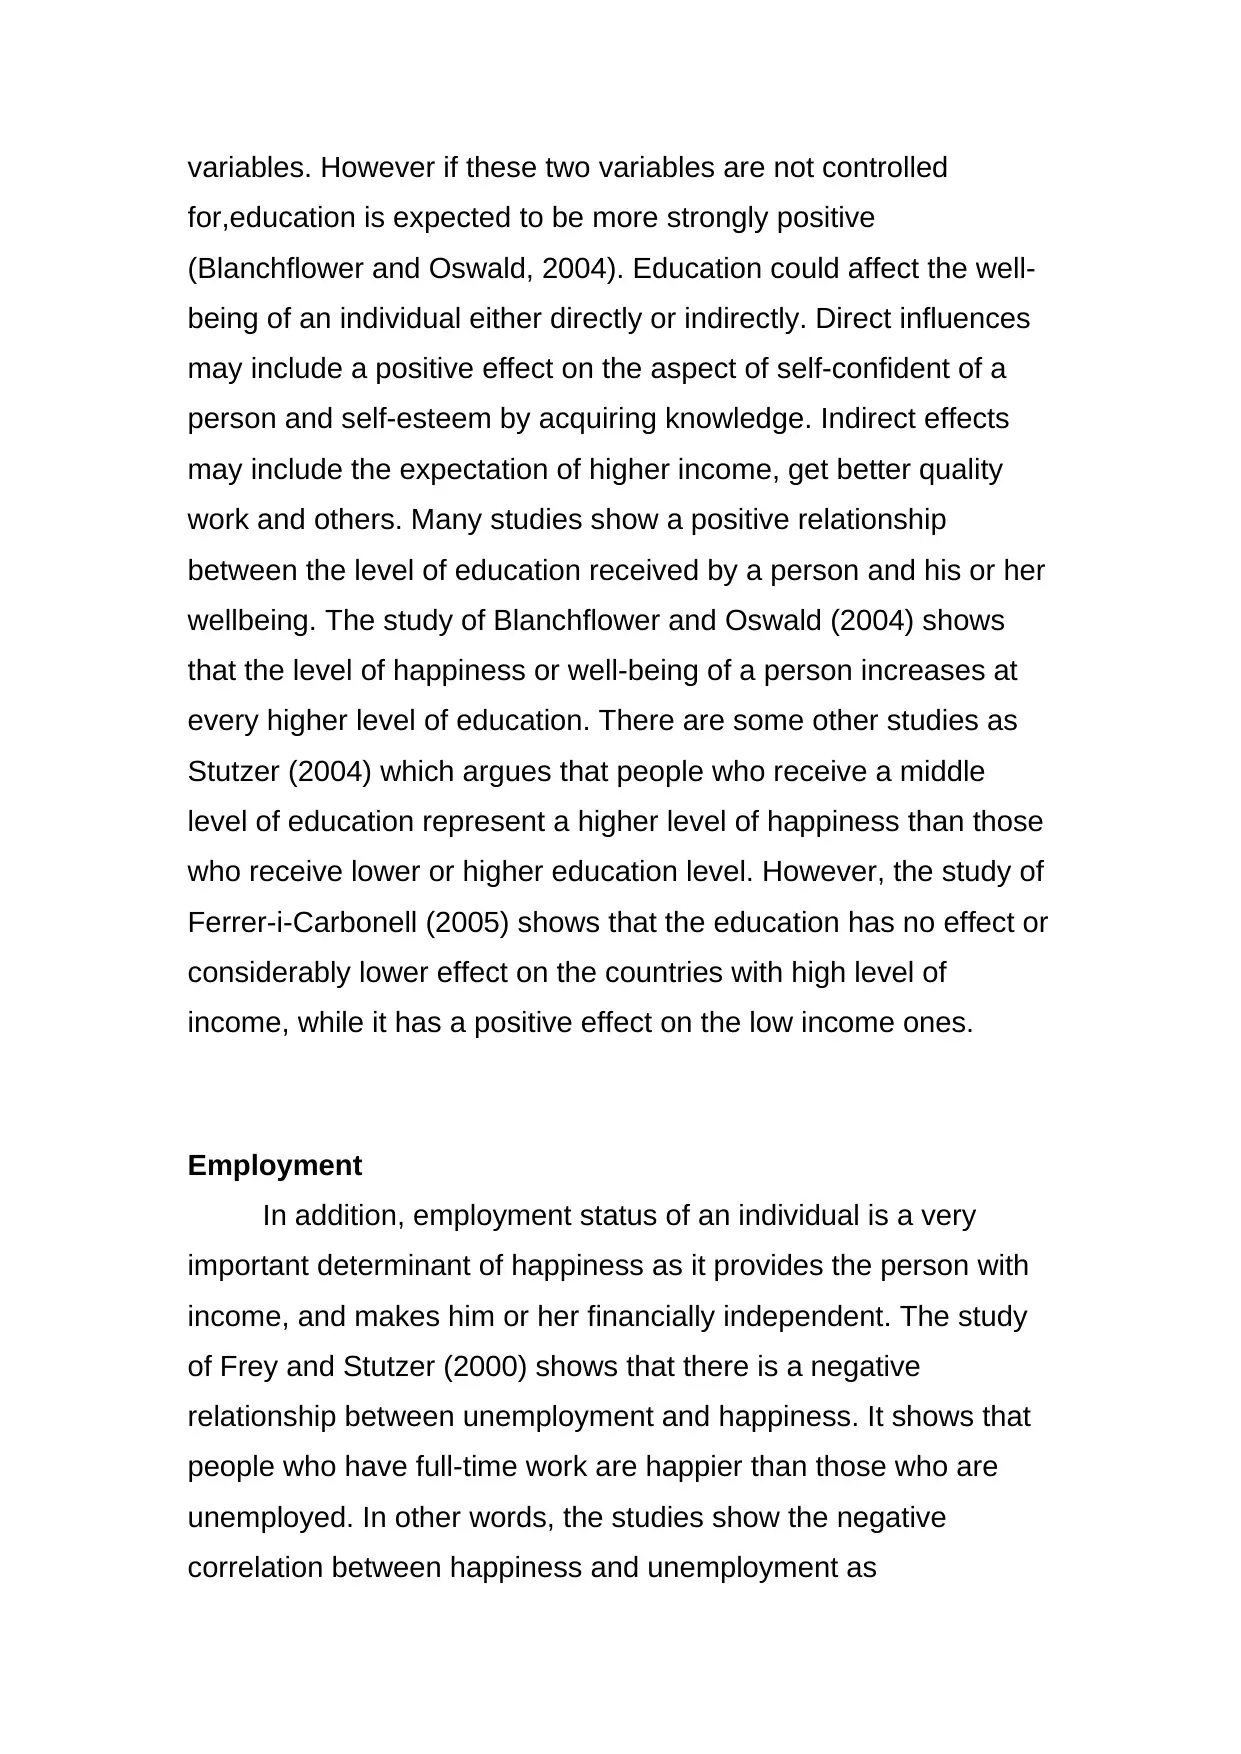
variables. However if these two variables are not controlled
for,education is expected to be more strongly positive
(Blanchflower and Oswald, 2004). Education could affect the well-
being of an individual either directly or indirectly. Direct influences
may include a positive effect on the aspect of self-confident of a
person and self-esteem by acquiring knowledge. Indirect effects
may include the expectation of higher income, get better quality
work and others. Many studies show a positive relationship
between the level of education received by a person and his or her
wellbeing. The study of Blanchflower and Oswald (2004) shows
that the level of happiness or well-being of a person increases at
every higher level of education. There are some other studies as
Stutzer (2004) which argues that people who receive a middle
level of education represent a higher level of happiness than those
who receive lower or higher education level. However, the study of
Ferrer-i-Carbonell (2005) shows that the education has no effect or
considerably lower effect on the countries with high level of
income, while it has a positive effect on the low income ones.
Employment
In addition, employment status of an individual is a very
important determinant of happiness as it provides the person with
income, and makes him or her financially independent. The study
of Frey and Stutzer (2000) shows that there is a negative
relationship between unemployment and happiness. It shows that
people who have full-time work are happier than those who are
unemployed. In other words, the studies show the negative
correlation between happiness and unemployment as
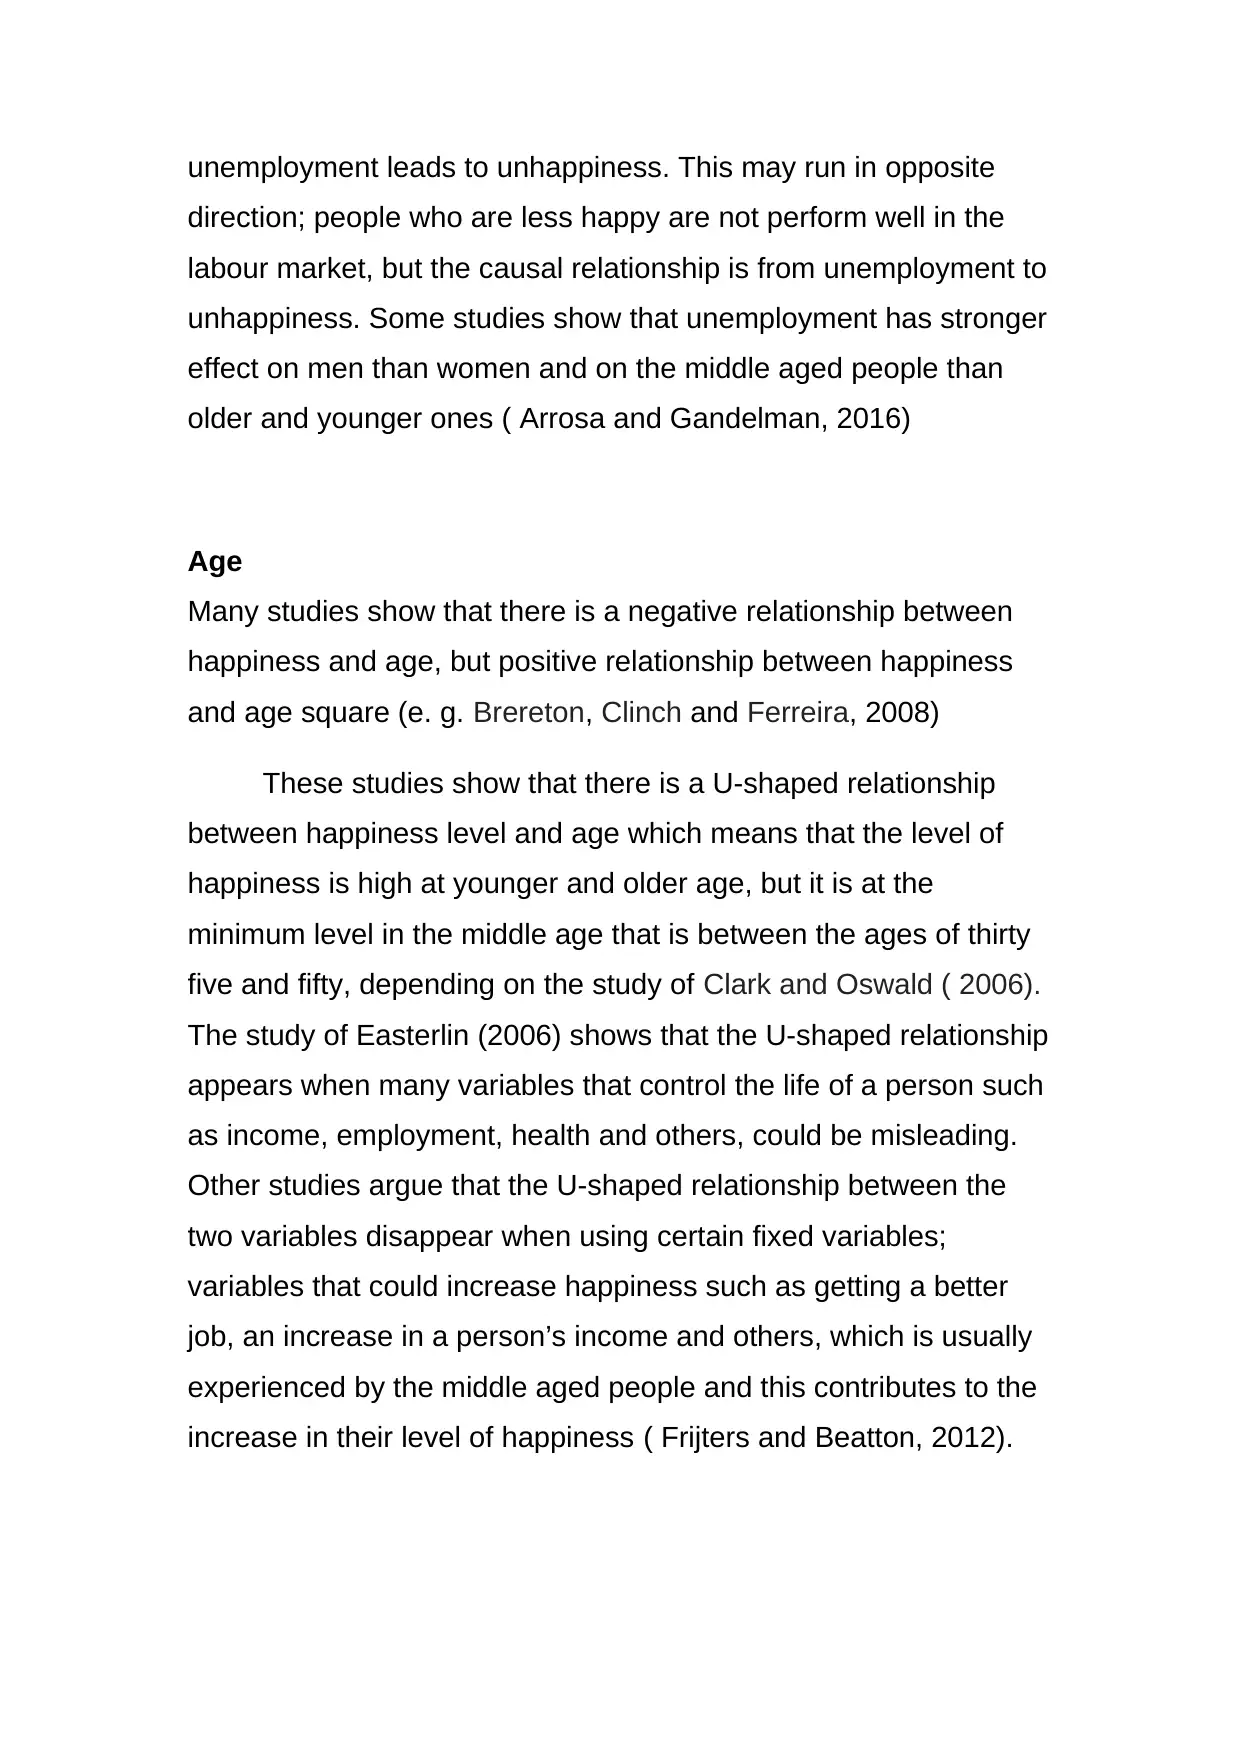
unemployment leads to unhappiness. This may run in opposite
direction; people who are less happy are not perform well in the
labour market, but the causal relationship is from unemployment to
unhappiness. Some studies show that unemployment has stronger
effect on men than women and on the middle aged people than
older and younger ones ( Arrosa and Gandelman, 2016)
Age
Many studies show that there is a negative relationship between
happiness and age, but positive relationship between happiness
and age square (e. g. Brereton, Clinch and Ferreira, 2008)
These studies show that there is a U-shaped relationship
between happiness level and age which means that the level of
happiness is high at younger and older age, but it is at the
minimum level in the middle age that is between the ages of thirty
five and fifty, depending on the study of Clark and Oswald ( 2006).
The study of Easterlin (2006) shows that the U-shaped relationship
appears when many variables that control the life of a person such
as income, employment, health and others, could be misleading.
Other studies argue that the U-shaped relationship between the
two variables disappear when using certain fixed variables;
variables that could increase happiness such as getting a better
job, an increase in a person’s income and others, which is usually
experienced by the middle aged people and this contributes to the
increase in their level of happiness ( Frijters and Beatton, 2012).
⊘ This is a preview!⊘
Do you want full access?
Subscribe today to unlock all pages.
Trusted by 1+ million students worldwide
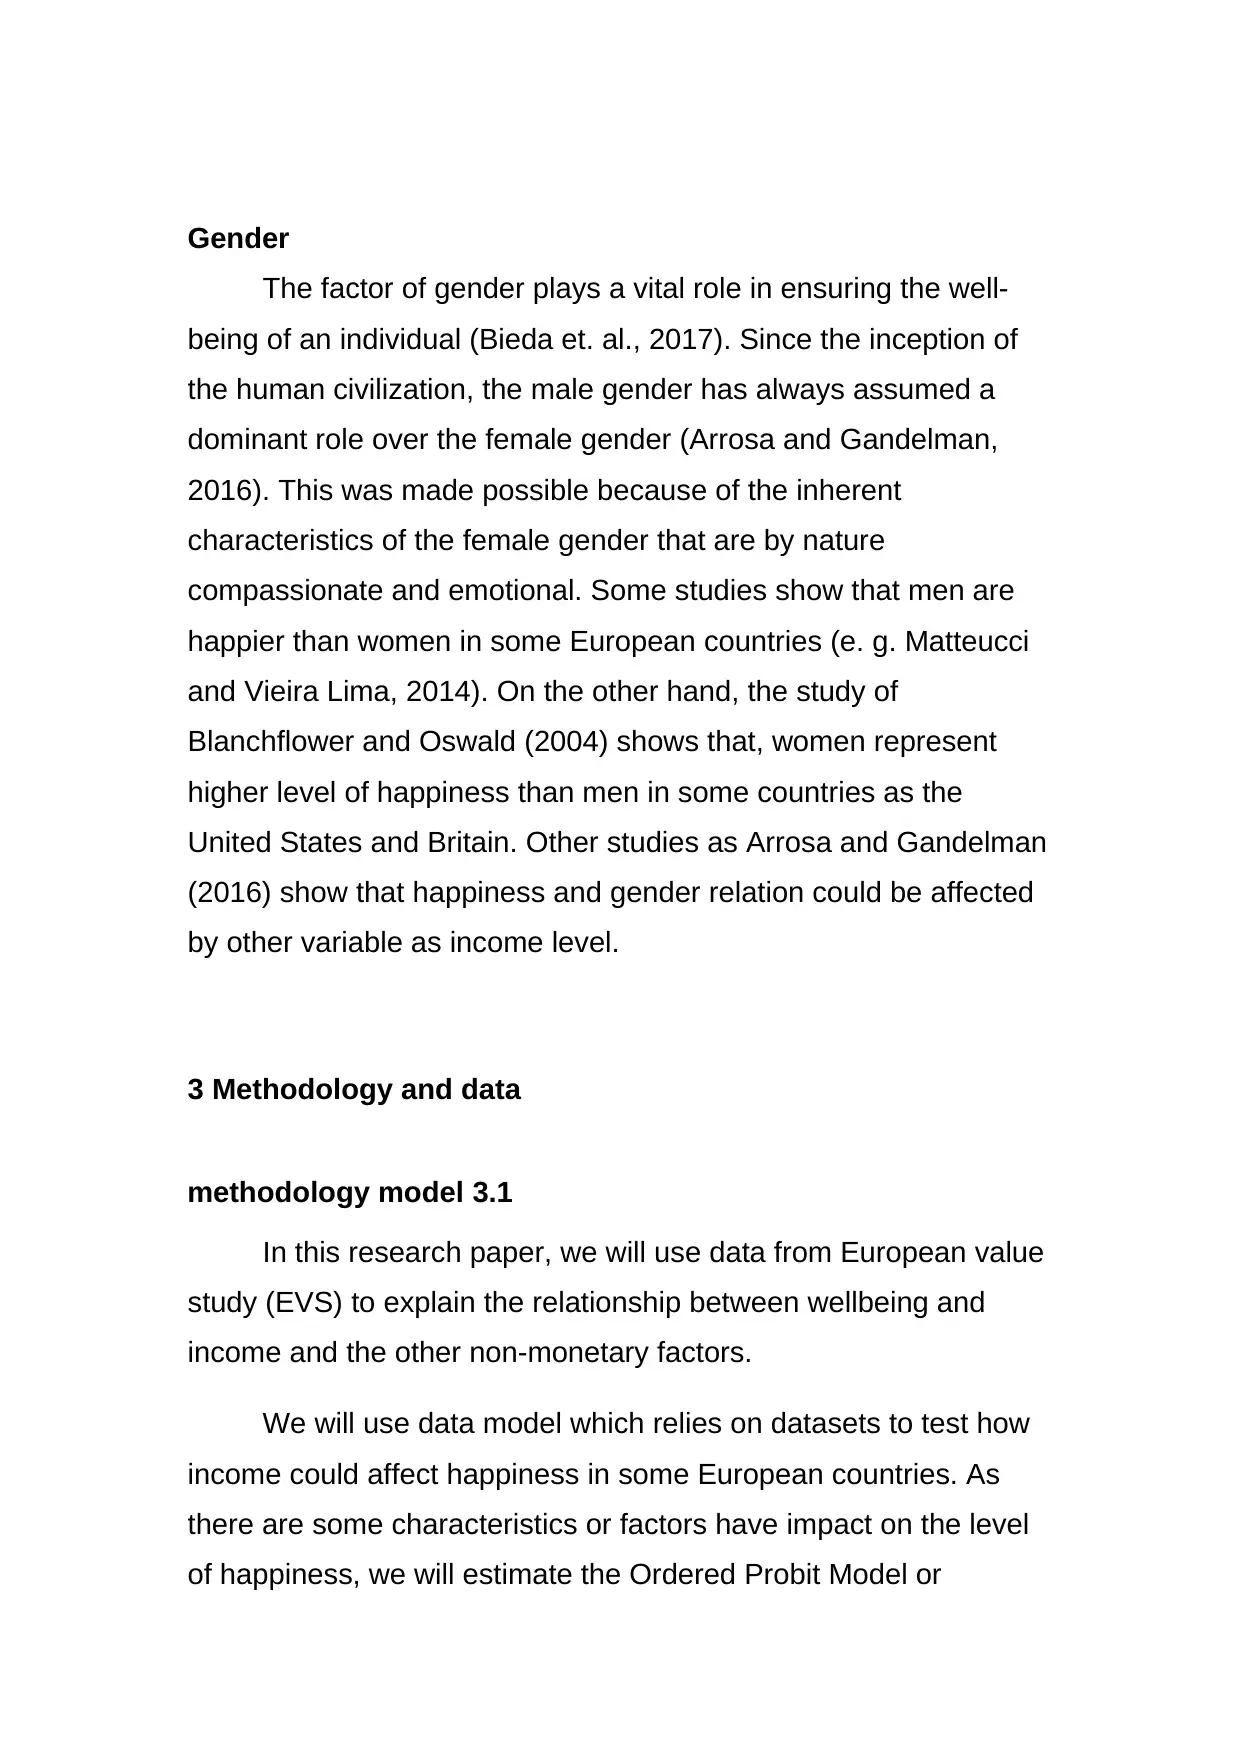
Gender
The factor of gender plays a vital role in ensuring the well-
being of an individual (Bieda et. al., 2017). Since the inception of
the human civilization, the male gender has always assumed a
dominant role over the female gender (Arrosa and Gandelman,
2016). This was made possible because of the inherent
characteristics of the female gender that are by nature
compassionate and emotional. Some studies show that men are
happier than women in some European countries (e. g. Matteucci
and Vieira Lima, 2014). On the other hand, the study of
Blanchflower and Oswald (2004) shows that, women represent
higher level of happiness than men in some countries as the
United States and Britain. Other studies as Arrosa and Gandelman
(2016) show that happiness and gender relation could be affected
by other variable as income level.
3 Methodology and data
3.1methodology model
In this research paper, we will use data from European value
study (EVS) to explain the relationship between wellbeing and
income and the other non-monetary factors.
We will use data model which relies on datasets to test how
income could affect happiness in some European countries. As
there are some characteristics or factors have impact on the level
of happiness, we will estimate the Ordered Probit Model or
Paraphrase This Document
Need a fresh take? Get an instant paraphrase of this document with our AI Paraphraser
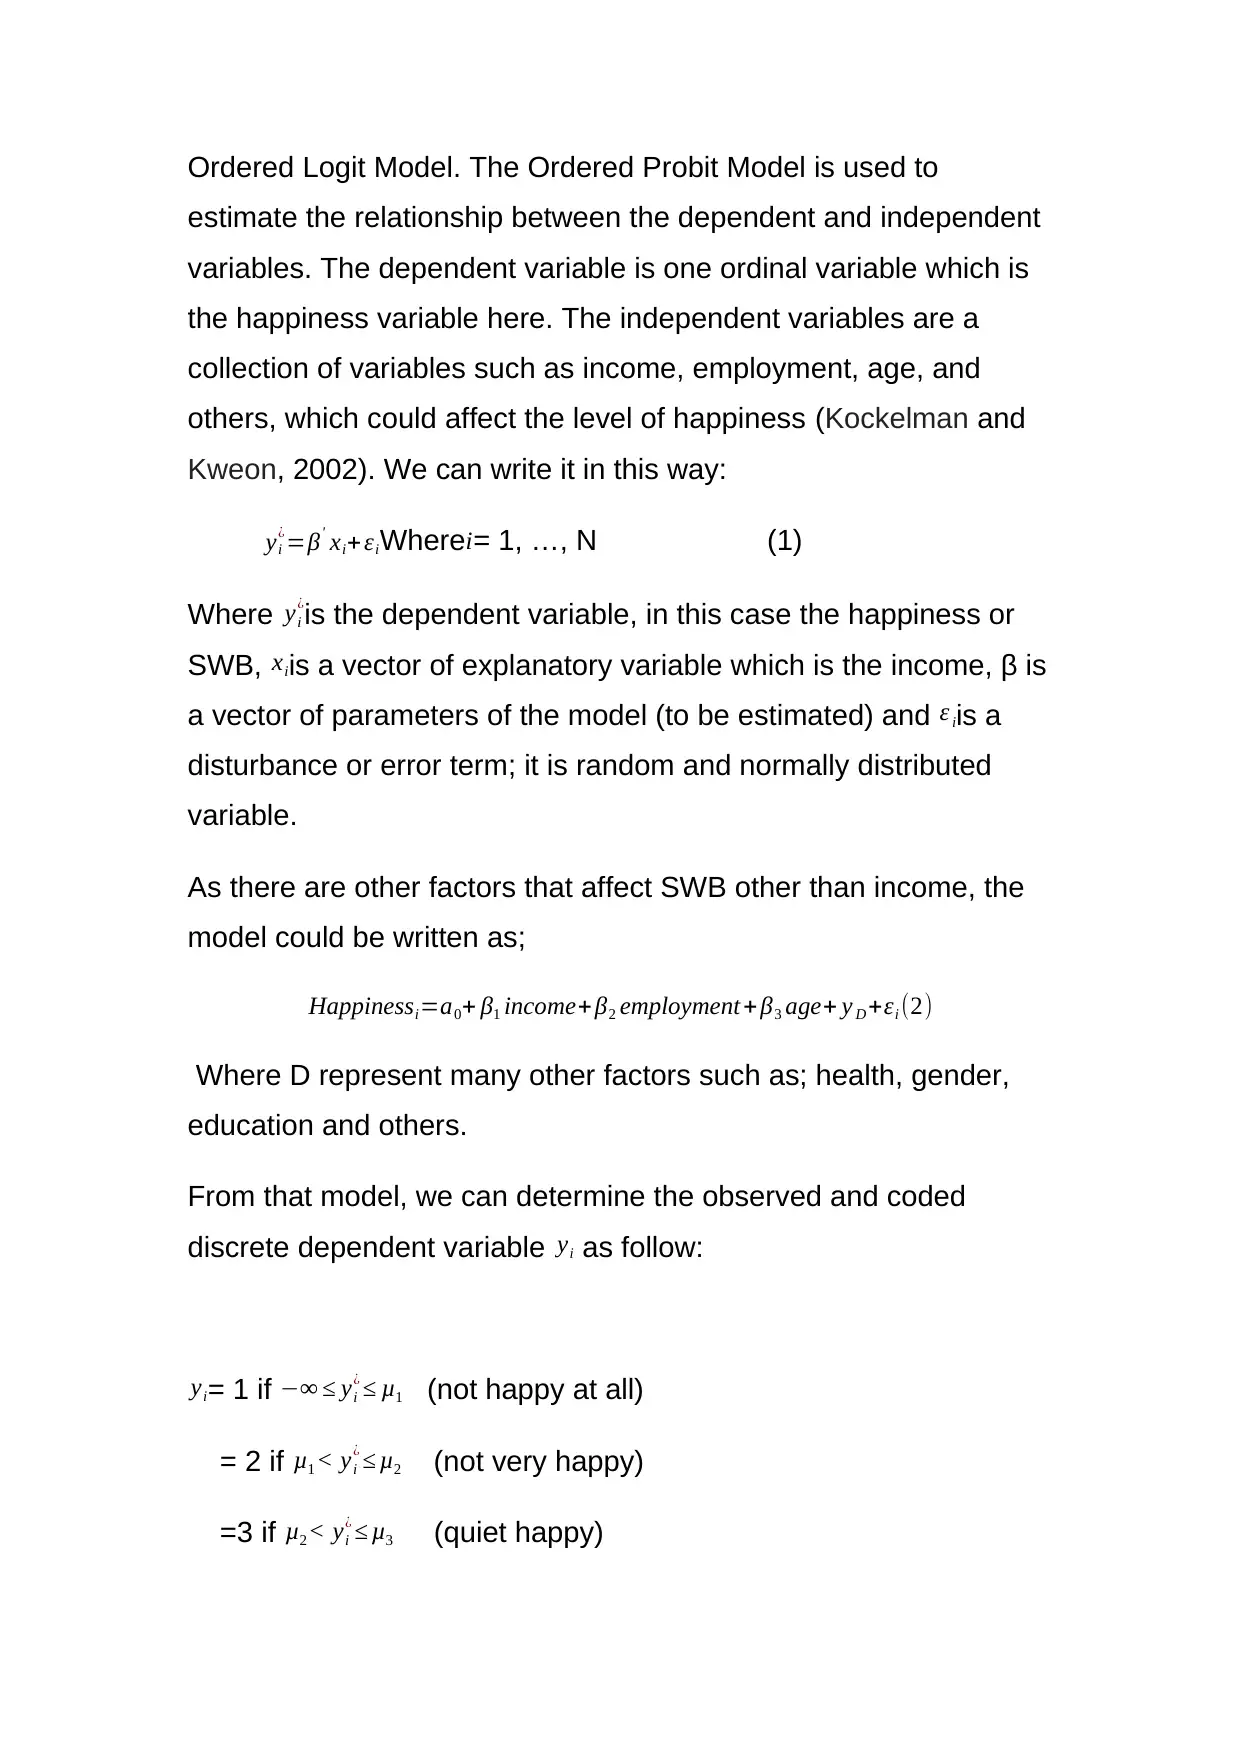
Ordered Logit Model. The Ordered Probit Model is used to
estimate the relationship between the dependent and independent
variables. The dependent variable is one ordinal variable which is
the happiness variable here. The independent variables are a
collection of variables such as income, employment, age, and
others, which could affect the level of happiness (Kockelman and
Kweon, 2002). We can write it in this way:
yi
¿=β' xi+ εiWherei= 1, …, N (1)
Where yi
¿
is the dependent variable, in this case the happiness or
SWB, xiis a vector of explanatory variable which is the income, β is
a vector of parameters of the model (to be estimated) and ε iis a
disturbance or error term; it is random and normally distributed
variable.
As there are other factors that affect SWB other than income, the
model could be written as;
Happinessi=a0+ β1 income+ β2 employment + β3 age+ y D +εi (2)
Where D represent many other factors such as; health, gender,
education and others.
From that model, we can determine the observed and coded
discrete dependent variable yi as follow:
yi= 1 if −∞ ≤ yi
¿ ≤ μ1 (not happy at all)
= 2 if μ1 ˂ yi
¿ ≤ μ2 (not very happy)
=3 if μ2 ˂ yi
¿ ≤ μ3 (quiet happy)
=4 if μ3 ˂ yi
¿ ≤ ∞ (very happy)
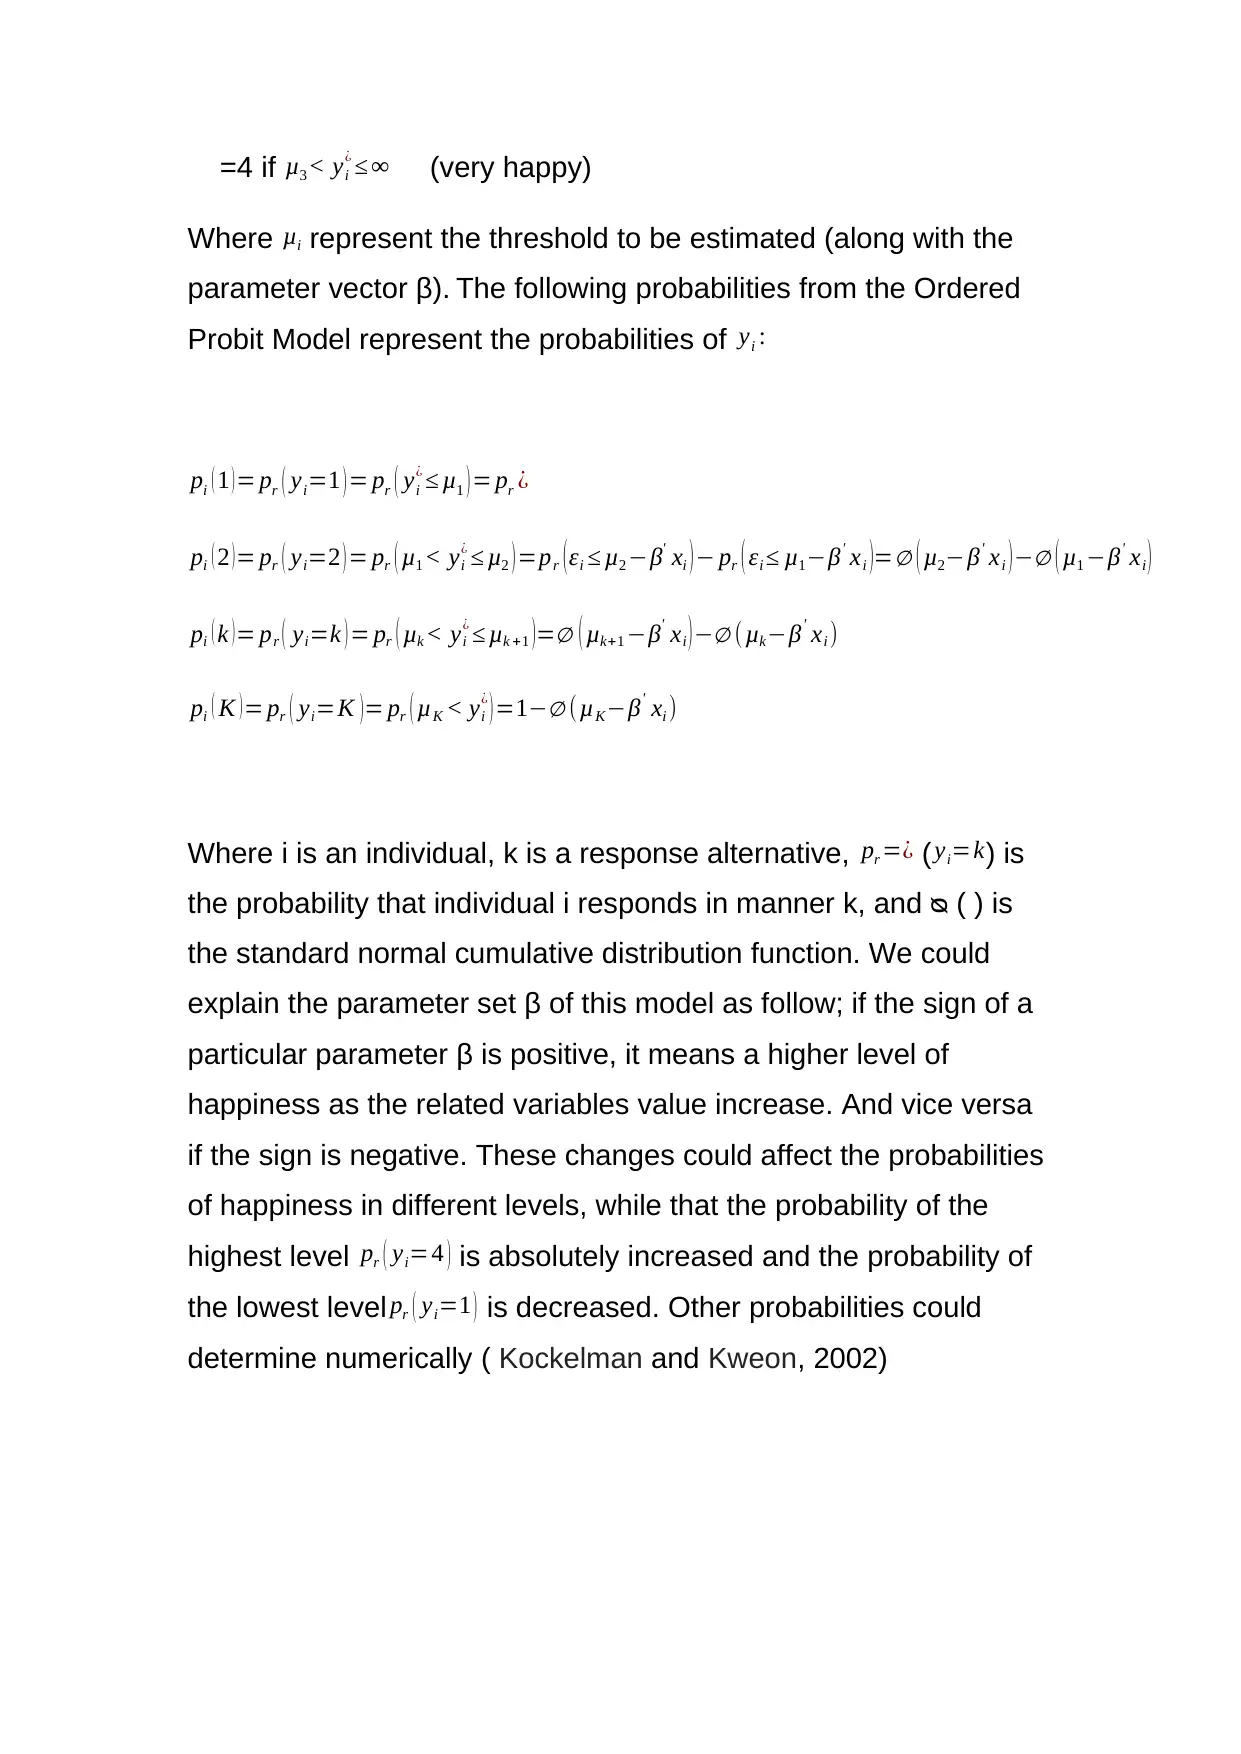
Where μi represent the threshold to be estimated (along with the
parameter vector β). The following probabilities from the Ordered
Probit Model represent the probabilities of yi :
pi ( 1 ) = pr ( yi=1 ) = pr ( yi
¿ ≤ μ1 ) = pr ¿
pi ( 2 )= pr ( yi=2 ) = pr ( μ1 ˂ yi
¿ ≤ μ2 )=pr (εi ≤ μ2 −β' xi )− pr ( εi ≤ μ1−β' xi )=∅ ( μ2−β' xi )−∅ ( μ1 −β' xi )
pi ( k )= pr ( yi=k ) = pr ( μk ˂ yi
¿ ≤ μk +1 )=∅ ( μk+1 −β' xi )−∅ ( μk−β' xi )
pi ( K )= pr ( yi=K )= pr ( μK ˂ yi
¿ )=1−∅ (μK−β' xi )
Where i is an individual, k is a response alternative, pr =¿ ( yi=k) is
the probability that individual i responds in manner k, and ᴓ ( ) is
the standard normal cumulative distribution function. We could
explain the parameter set β of this model as follow; if the sign of a
particular parameter β is positive, it means a higher level of
happiness as the related variables value increase. And vice versa
if the sign is negative. These changes could affect the probabilities
of happiness in different levels, while that the probability of the
highest level pr ( yi=4 ) is absolutely increased and the probability of
the lowest level pr ( yi=1 ) is decreased. Other probabilities could
determine numerically ( Kockelman and Kweon, 2002)
¿ ≤ ∞ (very happy)
Where μi represent the threshold to be estimated (along with the
parameter vector β). The following probabilities from the Ordered
Probit Model represent the probabilities of yi :
pi ( 1 ) = pr ( yi=1 ) = pr ( yi
¿ ≤ μ1 ) = pr ¿
pi ( 2 )= pr ( yi=2 ) = pr ( μ1 ˂ yi
¿ ≤ μ2 )=pr (εi ≤ μ2 −β' xi )− pr ( εi ≤ μ1−β' xi )=∅ ( μ2−β' xi )−∅ ( μ1 −β' xi )
pi ( k )= pr ( yi=k ) = pr ( μk ˂ yi
¿ ≤ μk +1 )=∅ ( μk+1 −β' xi )−∅ ( μk−β' xi )
pi ( K )= pr ( yi=K )= pr ( μK ˂ yi
¿ )=1−∅ (μK−β' xi )
Where i is an individual, k is a response alternative, pr =¿ ( yi=k) is
the probability that individual i responds in manner k, and ᴓ ( ) is
the standard normal cumulative distribution function. We could
explain the parameter set β of this model as follow; if the sign of a
particular parameter β is positive, it means a higher level of
happiness as the related variables value increase. And vice versa
if the sign is negative. These changes could affect the probabilities
of happiness in different levels, while that the probability of the
highest level pr ( yi=4 ) is absolutely increased and the probability of
the lowest level pr ( yi=1 ) is decreased. Other probabilities could
determine numerically ( Kockelman and Kweon, 2002)
⊘ This is a preview!⊘
Do you want full access?
Subscribe today to unlock all pages.
Trusted by 1+ million students worldwide
3.2 Data
In this paper we used the data from the European value
study (EVS) for nine European countries from 2008 to 2010. The
countries from where data is collected are; Denmark, Norway,
Sweden, Switzerland, the United Kingdom, Hungary, Poland,
Romania and Ukraine.
We can separate the nine countries into two different groups
depending on their economic situations as some countries have
better economic situation and reported higher level of happiness
than others (Caporale et al, 2009). As a result, we can divide them
into developed and developing countries, where the developed
countries are Denmark, Norway, Sweden, Switzerland and the
United Kingdom, and the developing countries are Hungary,
Poland, Romania and Ukraine.
Data from EVS have some information about the dependent
variable; the happiness level is used in our regression as a
dependent variable. The data was collected based in some
questions about the variables. The questions were asked to those
people who lived in the above mentioned European countries.
Such questions included the following; how happy are you in your
life? “Feeling of happiness”, are you very happy, quite happy, not
very happy or not at all happy.
The EVS data also provides some information about other
independent variables that could affect the happiness level of the
Paraphrase This Document
Need a fresh take? Get an instant paraphrase of this document with our AI Paraphraser
people living in these countries. The variables that were taken in to
consideration are income, education, employment, age and
gender. The income variable here is divided into three categories
that are low, medium and high level of income. The education
variable is label as the highest educational level attained and it is
divided into eight categories. For the employment status the
chosen people divided into employed and unemployed. For age it
mentioned people aged from 16 to 103. And gender as male or
female.
Table 1 shows the summary statistics for developed
countries, while table 2 shows the relevant statistics for developing
countries. As shown from the tables the average income level of
developed and developing countries is about 1.97 and 1.95
respectively. There is no big difference in average income for both
groups of countries. If we move to the second variable the
education, the average score of this variable in developed
countries is 5.17 and 5.22 in developing countries. No big
differences between the two groups, but we can say that people in
developing countries care more about education as it could
improve their lives in the future. For the average value of
employment; there are 62% of people are employed in developed
countries, while 48% are employed in developing countries. The
average age of people in developed countries is 50 while in
developing countries is 47. Finally for the gender; female represent
53% of the population in developed countries and 58% in
developing countries.
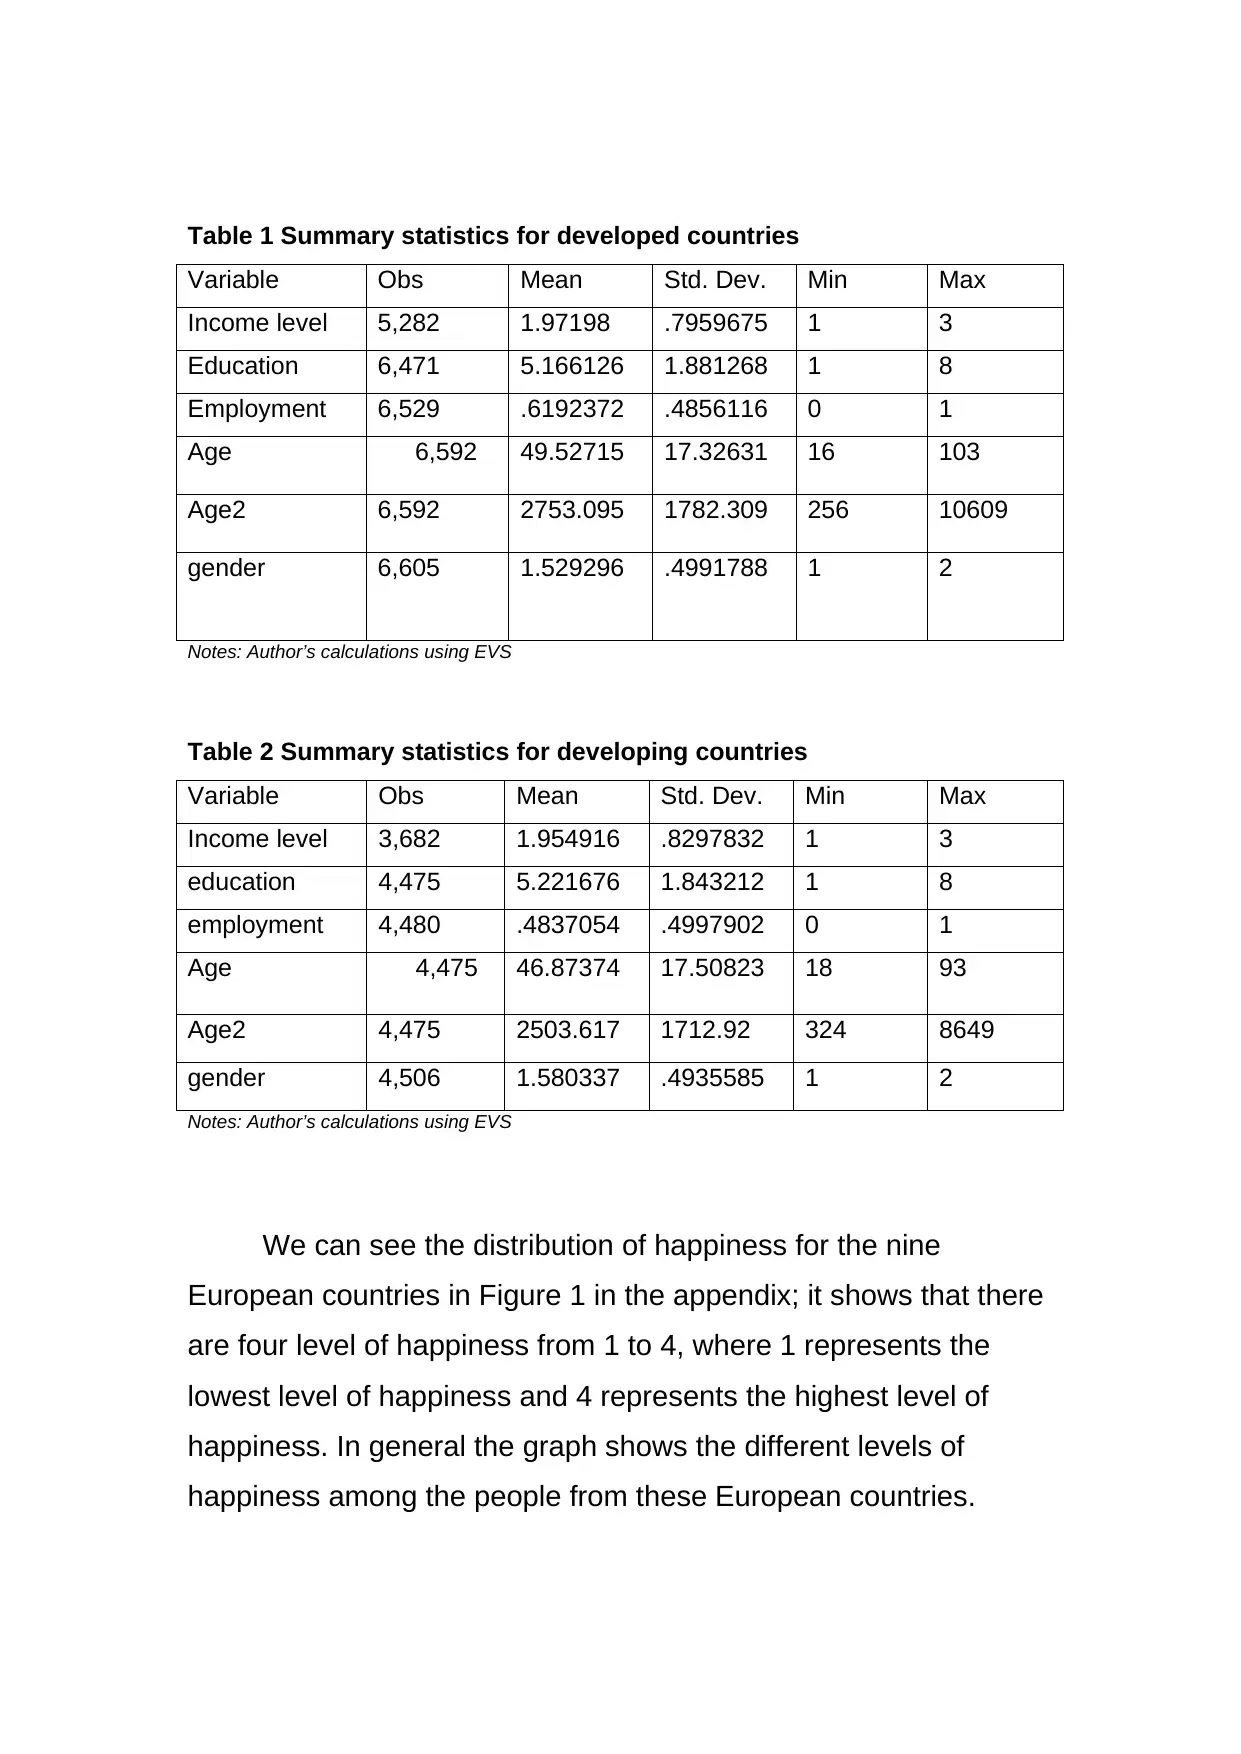
Table 1 Summary statistics for developed countries
MaxMinStd. Dev.MeanObsVariable
31.79596751.971985,282Income level
811.8812685.1661266,471Education
10.4856116.61923726,529Employment
1031617.3263149.527156,592Age
106092561782.3092753.0956,592Age2
21.49917881.5292966,605gender
Notes: Author’s calculations using EVS
Table 2 Summary statistics for developing countries
MaxMinStd. Dev.MeanObsVariable
31.82978321.9549163,682Income level
811.8432125.2216764,475education
10.4997902.48370544,480employment
931817.5082346.873744,475Age
86493241712.922503.6174,475Age2
21.49355851.5803374,506gender
Notes: Author’s calculations using EVS
We can see the distribution of happiness for the nine
European countries in Figure 1 in the appendix; it shows that there
are four level of happiness from 1 to 4, where 1 represents the
lowest level of happiness and 4 represents the highest level of
happiness. In general the graph shows the different levels of
happiness among the people from these European countries.
MaxMinStd. Dev.MeanObsVariable
31.79596751.971985,282Income level
811.8812685.1661266,471Education
10.4856116.61923726,529Employment
1031617.3263149.527156,592Age
106092561782.3092753.0956,592Age2
21.49917881.5292966,605gender
Notes: Author’s calculations using EVS
Table 2 Summary statistics for developing countries
MaxMinStd. Dev.MeanObsVariable
31.82978321.9549163,682Income level
811.8432125.2216764,475education
10.4997902.48370544,480employment
931817.5082346.873744,475Age
86493241712.922503.6174,475Age2
21.49355851.5803374,506gender
Notes: Author’s calculations using EVS
We can see the distribution of happiness for the nine
European countries in Figure 1 in the appendix; it shows that there
are four level of happiness from 1 to 4, where 1 represents the
lowest level of happiness and 4 represents the highest level of
happiness. In general the graph shows the different levels of
happiness among the people from these European countries.
⊘ This is a preview!⊘
Do you want full access?
Subscribe today to unlock all pages.
Trusted by 1+ million students worldwide
1 out of 22


Your All-in-One AI-Powered Toolkit for Academic Success.
+13062052269
info@desklib.com
Available 24*7 on WhatsApp / Email
![[object Object]](/_next/static/media/star-bottom.7253800d.svg)
Unlock your academic potential
Copyright © 2020–2026 A2Z Services. All Rights Reserved. Developed and managed by ZUCOL.