Analysis of ISO 9000 Adoption Determinants and Firm Performance
VerifiedAdded on 2020/02/24
|20
|4242
|278
Report
AI Summary
This report investigates the determinants of ISO 9000 adoption and its subsequent impact on firm performance, using secondary data extracted from an Economic Census conducted by the National Bureau of Statistics, China. The study aims to determine if there are significant differences in return on assets (ROA) and return on sales (ROS) between ISO 9000 certified and uncertified companies, as well as revenue differences across various industry types. Through descriptive analysis, the study reveals that only a small percentage of firms are ISO 9000 certified, with Business services being the most prevalent industry type. The report employs two-sample t-tests and ANOVA to analyze the hypotheses, concluding that there is no significant difference in ROA, ROS, or revenues based on ISO 9000 certification or industry type within the dataset. The findings highlight the importance of quality management systems and their potential impact on firm performance, while also acknowledging limitations and suggesting avenues for further research.
Running Head: DETERMINANTS OF ADOPTION OF ISO9000 AND ITS IMPACT ON FIRM
PERFORMANCE
Determinants of Adoption of ISO9000 and its Impact on Firm Performance
Name of the Student
Name of the University
Author Note
PERFORMANCE
Determinants of Adoption of ISO9000 and its Impact on Firm Performance
Name of the Student
Name of the University
Author Note
Paraphrase This Document
Need a fresh take? Get an instant paraphrase of this document with our AI Paraphraser
1
DETERMINANTS OF ADOPTION OF ISO9000 AND ITS IMPACT ON FIRM
PERFORMANCE
Executive Summary
The main aim of this study is to identify some of the determinants of the adoption of ISO 9000
and hence to analyze the impact of these factors on the performance of the firm. The data to
conduct this study has been collected from an Economic Census conducted by the National
Bureau of Statistics, China. Thus, the source of the data is secondary. The difference in the return
on assets, return on sales earned between the certified and uncertified companies has been tested
here and it has been observed that there is no difference in these returns. The differences in the
revenues earned by different types of firms has also been tested and found out that there lies no
difference in this case either.
2
DETERMINANTS OF ADOPTION OF ISO9000 AND ITS IMPACT ON FIRM
PERFORMANCE
Table of Contents
1.0 Introduction................................................................................................................................3
2.0 Literature Review......................................................................................................................4
2.1 Sales Growth of Industry.......................................................................................................4
2.2 ISO 9000 and Return on Assets.............................................................................................4
2.3 Revenue and Type of Industry...............................................................................................5
3.0 Research Methodology..............................................................................................................5
4.0 Analyses and Findings...............................................................................................................6
4.1 Descriptive Analysis..............................................................................................................6
4.2 Inferential Statistics.............................................................................................................11
5.0 Results and Discussions...........................................................................................................13
6.0 Limitations and Further Study.................................................................................................14
References......................................................................................................................................15
⊘ This is a preview!⊘
Do you want full access?
Subscribe today to unlock all pages.
Trusted by 1+ million students worldwide
3
DETERMINANTS OF ADOPTION OF ISO9000 AND ITS IMPACT ON FIRM
PERFORMANCE
1.0 Introduction
The quality management system standard of ISO900 has been the major standard of
measurement of the product qualities and system standard measurements all over the world. This
is widely used to state the quality and standards of the products of the company all over the
world. This series is used since its introduction in 1987. By the end of 2013, ISO 9000 has been
so famous within the companies such that that this system has been adopted by more than
1,129,000 facilities in 189 countries.
Due to this huge popularity of the system, it has been of high interest to the academics
and practitioners to understand the determinants of adoption of ISO 9000 and the impact of its
adoption on the firm’s performance. The data has been collected from the National Bureau of
Statistics, China. This is a sample data from extracted from an Economic Census conducted in
2008of the service firms. The dataset contains 24 variables. The data considered in this case is
secondary data.
The main objectives of the research can thus be given as follows:
Is there any significant difference between the return on assets by the ISO certified and
not certified companies?
Is there any significant difference between the return on sales by the ISO certified and not
certified companies?
Is there any significant difference between the revenues earned by different types of
industries?
The analysis will be performed using the appropriate statistical techniques using the
statistical software SPSS.
Paraphrase This Document
Need a fresh take? Get an instant paraphrase of this document with our AI Paraphraser
4
DETERMINANTS OF ADOPTION OF ISO9000 AND ITS IMPACT ON FIRM
PERFORMANCE
2.0 Literature Review
2.1 Sales Growth of Industry
The companies that are growing highly with time inspire the new markets, which are
entering the market (Christmann & Taylor, 2006). These new companies are not that popular and
thus they need establishment and recognition for themselves (Wu, Chu, & Liu, 2007). The
certification from ISO 9000 is thus very important for the companies as this certification gives a
signaling effect to the market stating whether the companies have accepted the quality seriously
(Du, Yin, & Zhang, 2016). It has been seen that a lot of organizations take a very conventional
approach towards the industrial buying. This leads the firms to ask for proposals only from ISO
9000 certified firms (Fikru, 2014a). Thus, firms without the ISO 9000 certification are highly
probable to be ruled out from the potential lists of suppliers. Thus, this certification becomes
very important for the potential customers. From this theory, the following hypothesis can be
framed.
H1: There is significant difference between the return on sales (ROS) by the ISO certified and
uncertified companies.
2.2 ISO 9000 and Return onAssets
Return on Assets (ROA) is one of the most important feature to measure corporate
performance. It has been observed from past studies that the companies that are certified by the
ISO 9000 experience profit than the companies that are not registered. (researchgate.net, 2017).
Another study has shown that return on assets (ROA) and return on sales (ROS) of the ISO 9000
certified companies has been almost twice as that of the companies which are not certified
(Fikru, 2014b ). Thus, this can be said that the ISO certified companies are more profitable than
the companies, which are not certified. The overall findings have shown that the registered
5
DETERMINANTS OF ADOPTION OF ISO9000 AND ITS IMPACT ON FIRM
PERFORMANCE
companies have an earning which is much better than the companies which are not registered
(Fikru, 2016). It has also been observed that the companies certified by ISO 9000 has abnormal
growth towards their return of assets (ROA) and these improvements have been lasting for a long
period (Nakamura, Takahashi, & Vertinsky, 2001). Thus, the following hypothesis can be
framed from thus discussion.
H2: There is significant difference between the return on assets (ROA) by the ISO certified and
uncertified companies.
2.3 Revenue and Type of Industry
It has already been observed from the discussions about the past studies that the ISO
certified companies are highly profitable compared to the companies that are not certified
(Terziovski & Guerrero, 2014). Thus, the revenue earned by the certified companies must also be
higher than the companies that are not certified (Pekovic, 2010). Thus, it is important for the
industries to understand which type of industry earns more revenue. With the discussion of these
factors, the following hypothesis can be framed.
H3: There is significant difference between the revenues earned by different types of industries.
3.0 Research Methodology
The analysis of the hypotheses stated in the previous section has to be performed in this
study. The first hypothesis that has been stated is to be analyzed with the help of two sample t-
test. Two-sample t-test is the most appropriate method to compare the means of two variables. In
this case, the mean return on sales for the companies that are certified by ISO 9000 is to be
compared with the mean return on sales for the companies, which are not certified by ISO 9000.
⊘ This is a preview!⊘
Do you want full access?
Subscribe today to unlock all pages.
Trusted by 1+ million students worldwide
6
DETERMINANTS OF ADOPTION OF ISO9000 AND ITS IMPACT ON FIRM
PERFORMANCE
The second hypothesis that has been framed is also to be tested using the two-sample t-
test technique. In this case, the mean return on assets (ROA) for the companies that are certified
by the ISO 9000 is to be compared with the mean return on assets for the companies that are not
certified by ISO 9000.
The third hypothesis that has been stated is to be tested initially with the help of one-way
ANOVA technique. The Analysis of Variance (ANOVA) technique is the best measure to check
whether there is any significant relationship between the means of more than two variables or
not. The ANOVA technique is a generalization of the two-sample t-test.
4.0 Analyses and Findings
4.1 Descriptive Analysis
Here, descriptive analysis of all the variables considered in this study will be done. The
first variable that has been considered is the certification of the company. Whether a company is
certified or not is described in this variable. The qualities “certified” and “not certified” are
coded as 1 and 0 respectively. The coding is done for the sake of this study. According to the
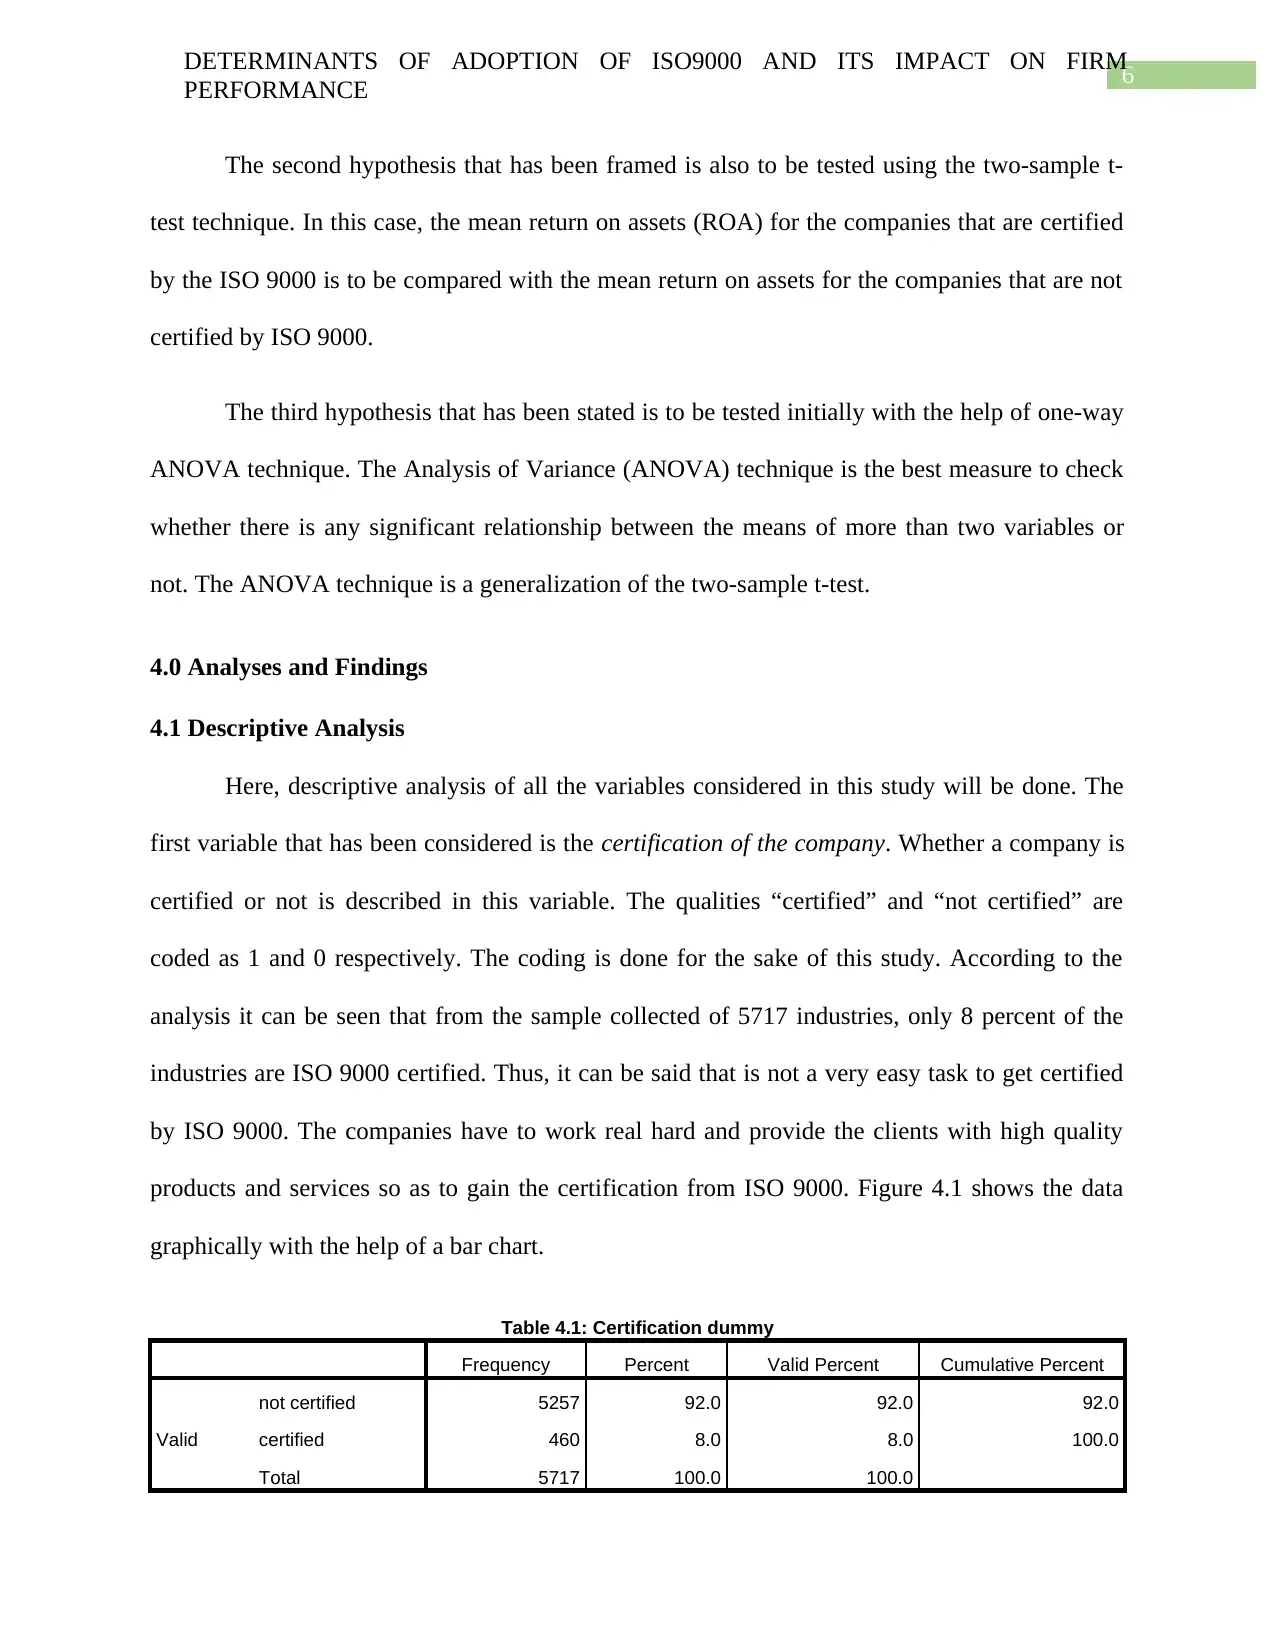
analysis it can be seen that from the sample collected of 5717 industries, only 8 percent of the
industries are ISO 9000 certified. Thus, it can be said that is not a very easy task to get certified
by ISO 9000. The companies have to work real hard and provide the clients with high quality
products and services so as to gain the certification from ISO 9000. Figure 4.1 shows the data
graphically with the help of a bar chart.
Table 4.1: Certification dummy
Frequency Percent Valid Percent Cumulative Percent
Valid
not certified 5257 92.0 92.0 92.0
certified 460 8.0 8.0 100.0
Total 5717 100.0 100.0
DETERMINANTS OF ADOPTION OF ISO9000 AND ITS IMPACT ON FIRM
PERFORMANCE
The second hypothesis that has been framed is also to be tested using the two-sample t-
test technique. In this case, the mean return on assets (ROA) for the companies that are certified
by the ISO 9000 is to be compared with the mean return on assets for the companies that are not
certified by ISO 9000.
The third hypothesis that has been stated is to be tested initially with the help of one-way
ANOVA technique. The Analysis of Variance (ANOVA) technique is the best measure to check
whether there is any significant relationship between the means of more than two variables or
not. The ANOVA technique is a generalization of the two-sample t-test.
4.0 Analyses and Findings
4.1 Descriptive Analysis
Here, descriptive analysis of all the variables considered in this study will be done. The
first variable that has been considered is the certification of the company. Whether a company is
certified or not is described in this variable. The qualities “certified” and “not certified” are
coded as 1 and 0 respectively. The coding is done for the sake of this study. According to the
analysis it can be seen that from the sample collected of 5717 industries, only 8 percent of the
industries are ISO 9000 certified. Thus, it can be said that is not a very easy task to get certified
by ISO 9000. The companies have to work real hard and provide the clients with high quality
products and services so as to gain the certification from ISO 9000. Figure 4.1 shows the data
graphically with the help of a bar chart.
Table 4.1: Certification dummy
Frequency Percent Valid Percent Cumulative Percent
Valid
not certified 5257 92.0 92.0 92.0
certified 460 8.0 8.0 100.0
Total 5717 100.0 100.0
Paraphrase This Document
Need a fresh take? Get an instant paraphrase of this document with our AI Paraphraser
7
DETERMINANTS OF ADOPTION OF ISO9000 AND ITS IMPACT ON FIRM
PERFORMANCE
Figure 4.1: bar graph showing the ISO 9000 certification of the companies
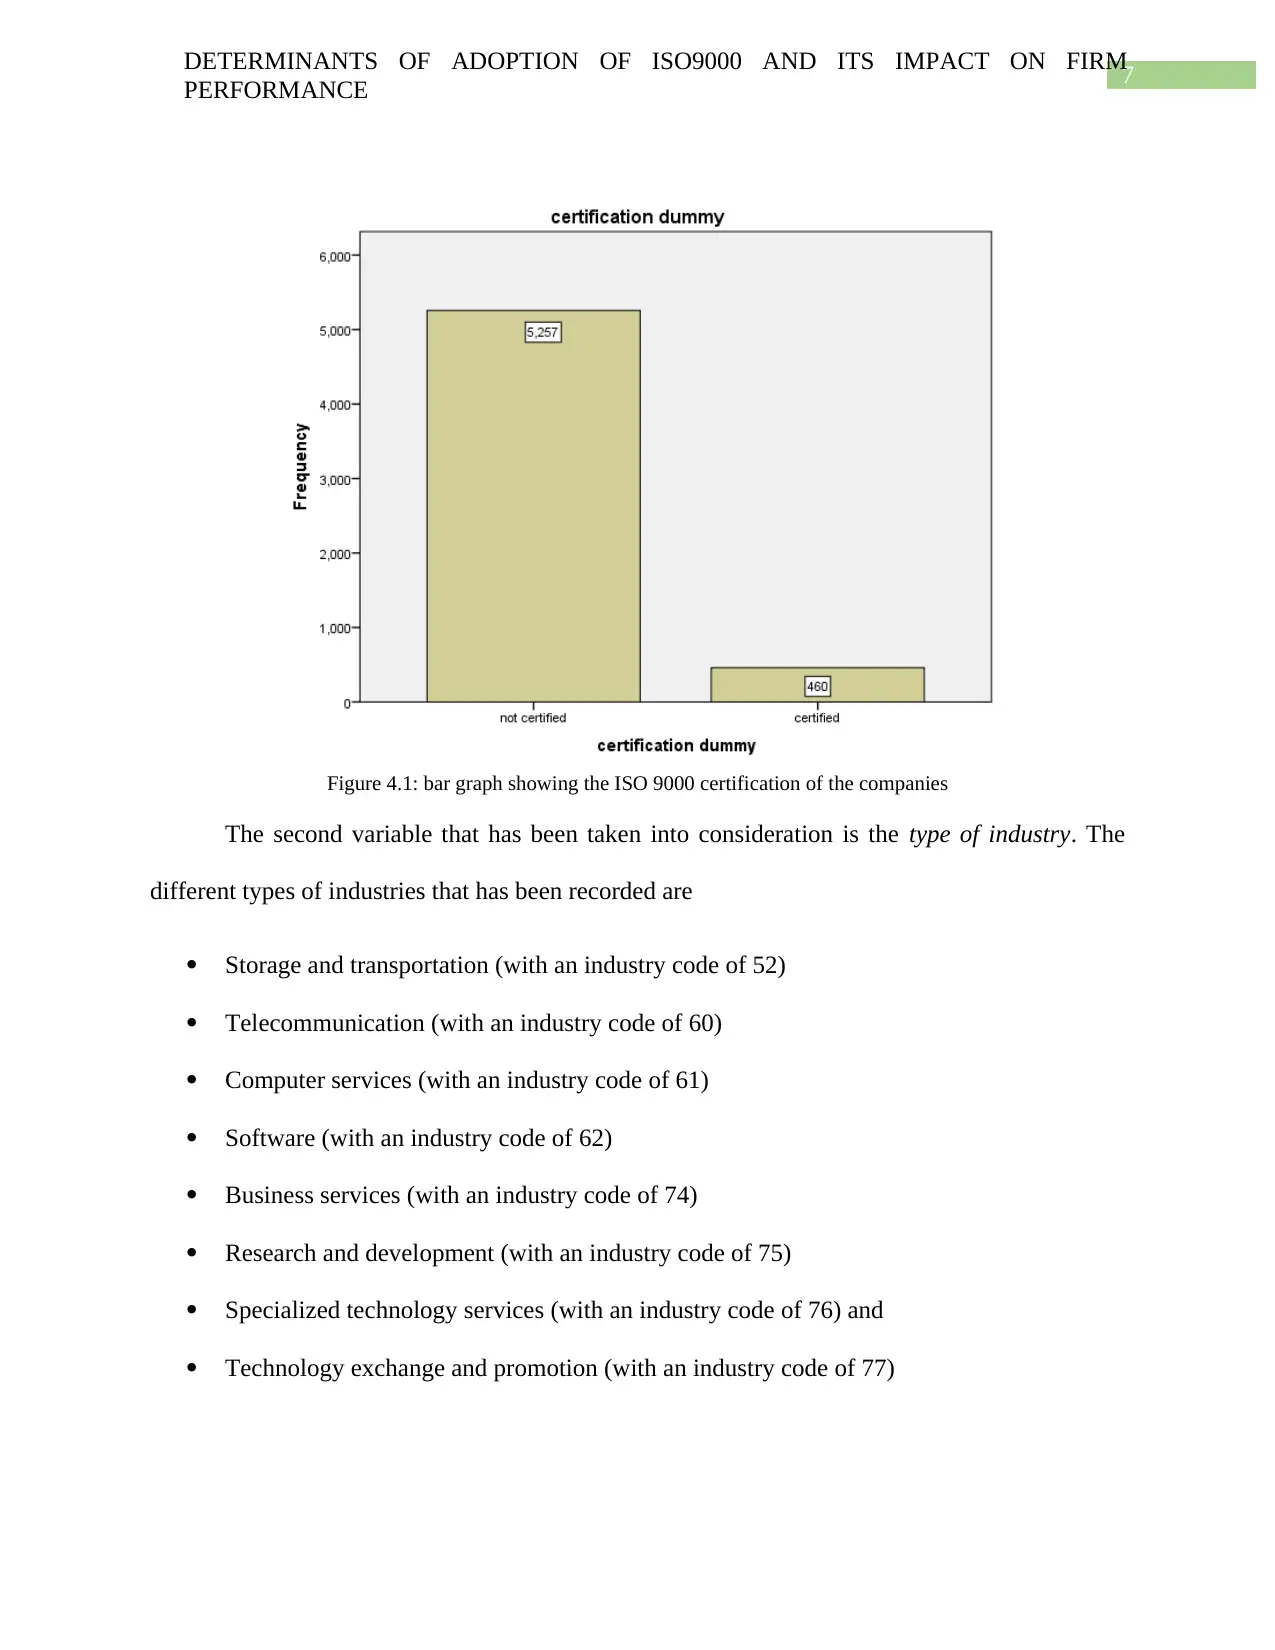
The second variable that has been taken into consideration is the type of industry. The
different types of industries that has been recorded are
Storage and transportation (with an industry code of 52)
Telecommunication (with an industry code of 60)
Computer services (with an industry code of 61)
Software (with an industry code of 62)
Business services (with an industry code of 74)
Research and development (with an industry code of 75)
Specialized technology services (with an industry code of 76) and
Technology exchange and promotion (with an industry code of 77)
DETERMINANTS OF ADOPTION OF ISO9000 AND ITS IMPACT ON FIRM
PERFORMANCE
Figure 4.1: bar graph showing the ISO 9000 certification of the companies
The second variable that has been taken into consideration is the type of industry. The
different types of industries that has been recorded are
Storage and transportation (with an industry code of 52)
Telecommunication (with an industry code of 60)
Computer services (with an industry code of 61)
Software (with an industry code of 62)
Business services (with an industry code of 74)
Research and development (with an industry code of 75)
Specialized technology services (with an industry code of 76) and
Technology exchange and promotion (with an industry code of 77)
8
DETERMINANTS OF ADOPTION OF ISO9000 AND ITS IMPACT ON FIRM
PERFORMANCE
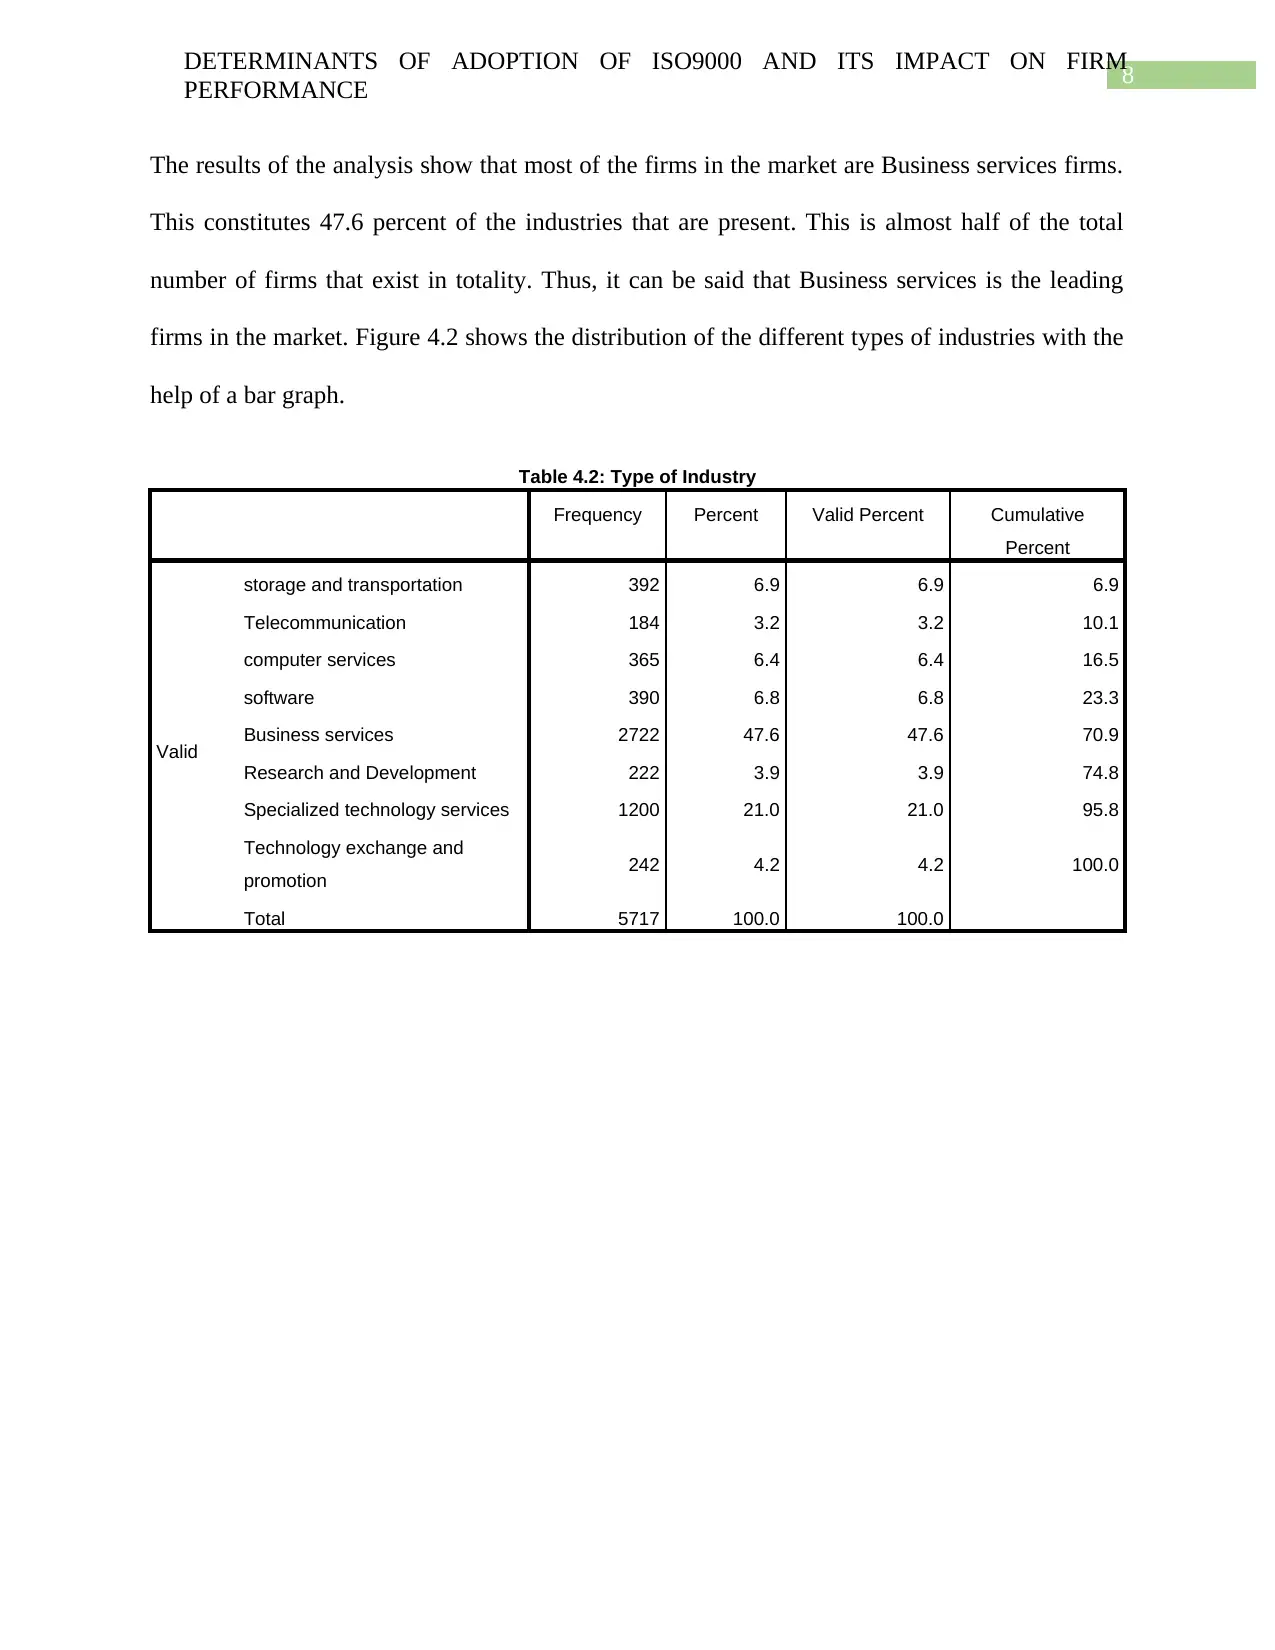
The results of the analysis show that most of the firms in the market are Business services firms.
This constitutes 47.6 percent of the industries that are present. This is almost half of the total
number of firms that exist in totality. Thus, it can be said that Business services is the leading
firms in the market. Figure 4.2 shows the distribution of the different types of industries with the
help of a bar graph.
Table 4.2: Type of Industry
Frequency Percent Valid Percent Cumulative
Percent
Valid
storage and transportation 392 6.9 6.9 6.9
Telecommunication 184 3.2 3.2 10.1
computer services 365 6.4 6.4 16.5
software 390 6.8 6.8 23.3
Business services 2722 47.6 47.6 70.9
Research and Development 222 3.9 3.9 74.8
Specialized technology services 1200 21.0 21.0 95.8
Technology exchange and
promotion 242 4.2 4.2 100.0
Total 5717 100.0 100.0
DETERMINANTS OF ADOPTION OF ISO9000 AND ITS IMPACT ON FIRM
PERFORMANCE
The results of the analysis show that most of the firms in the market are Business services firms.
This constitutes 47.6 percent of the industries that are present. This is almost half of the total
number of firms that exist in totality. Thus, it can be said that Business services is the leading
firms in the market. Figure 4.2 shows the distribution of the different types of industries with the
help of a bar graph.
Table 4.2: Type of Industry
Frequency Percent Valid Percent Cumulative
Percent
Valid
storage and transportation 392 6.9 6.9 6.9
Telecommunication 184 3.2 3.2 10.1
computer services 365 6.4 6.4 16.5
software 390 6.8 6.8 23.3
Business services 2722 47.6 47.6 70.9
Research and Development 222 3.9 3.9 74.8
Specialized technology services 1200 21.0 21.0 95.8
Technology exchange and
promotion 242 4.2 4.2 100.0
Total 5717 100.0 100.0
⊘ This is a preview!⊘
Do you want full access?
Subscribe today to unlock all pages.
Trusted by 1+ million students worldwide
9
DETERMINANTS OF ADOPTION OF ISO9000 AND ITS IMPACT ON FIRM
PERFORMANCE
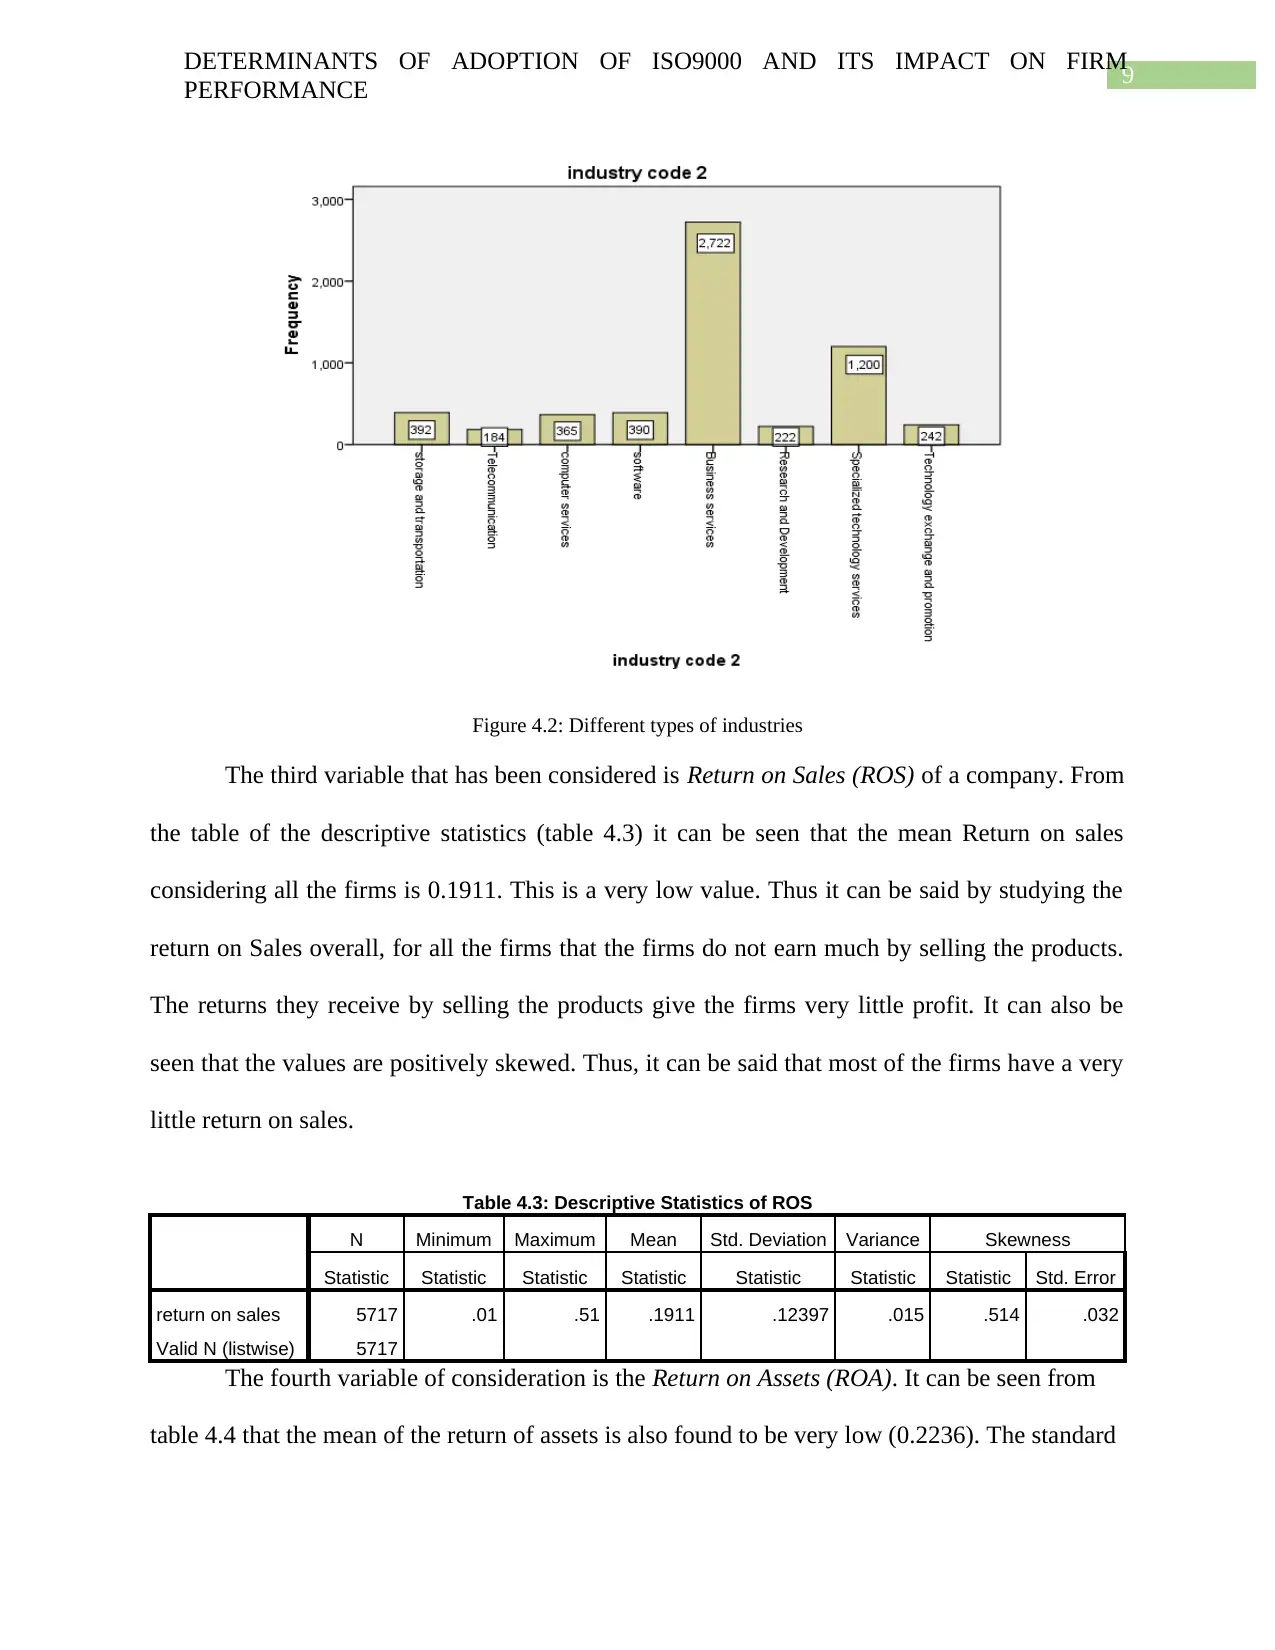
Figure 4.2: Different types of industries
The third variable that has been considered is Return on Sales (ROS) of a company. From
the table of the descriptive statistics (table 4.3) it can be seen that the mean Return on sales
considering all the firms is 0.1911. This is a very low value. Thus it can be said by studying the
return on Sales overall, for all the firms that the firms do not earn much by selling the products.
The returns they receive by selling the products give the firms very little profit. It can also be
seen that the values are positively skewed. Thus, it can be said that most of the firms have a very
little return on sales.
Table 4.3: Descriptive Statistics of ROS
N Minimum Maximum Mean Std. Deviation Variance Skewness
Statistic Statistic Statistic Statistic Statistic Statistic Statistic Std. Error
return on sales 5717 .01 .51 .1911 .12397 .015 .514 .032
Valid N (listwise) 5717
The fourth variable of consideration is the Return on Assets (ROA). It can be seen from
table 4.4 that the mean of the return of assets is also found to be very low (0.2236). The standard
DETERMINANTS OF ADOPTION OF ISO9000 AND ITS IMPACT ON FIRM
PERFORMANCE
Figure 4.2: Different types of industries
The third variable that has been considered is Return on Sales (ROS) of a company. From
the table of the descriptive statistics (table 4.3) it can be seen that the mean Return on sales
considering all the firms is 0.1911. This is a very low value. Thus it can be said by studying the
return on Sales overall, for all the firms that the firms do not earn much by selling the products.
The returns they receive by selling the products give the firms very little profit. It can also be
seen that the values are positively skewed. Thus, it can be said that most of the firms have a very
little return on sales.
Table 4.3: Descriptive Statistics of ROS
N Minimum Maximum Mean Std. Deviation Variance Skewness
Statistic Statistic Statistic Statistic Statistic Statistic Statistic Std. Error
return on sales 5717 .01 .51 .1911 .12397 .015 .514 .032
Valid N (listwise) 5717
The fourth variable of consideration is the Return on Assets (ROA). It can be seen from
table 4.4 that the mean of the return of assets is also found to be very low (0.2236). The standard
Paraphrase This Document
Need a fresh take? Get an instant paraphrase of this document with our AI Paraphraser
10
DETERMINANTS OF ADOPTION OF ISO9000 AND ITS IMPACT ON FIRM
PERFORMANCE
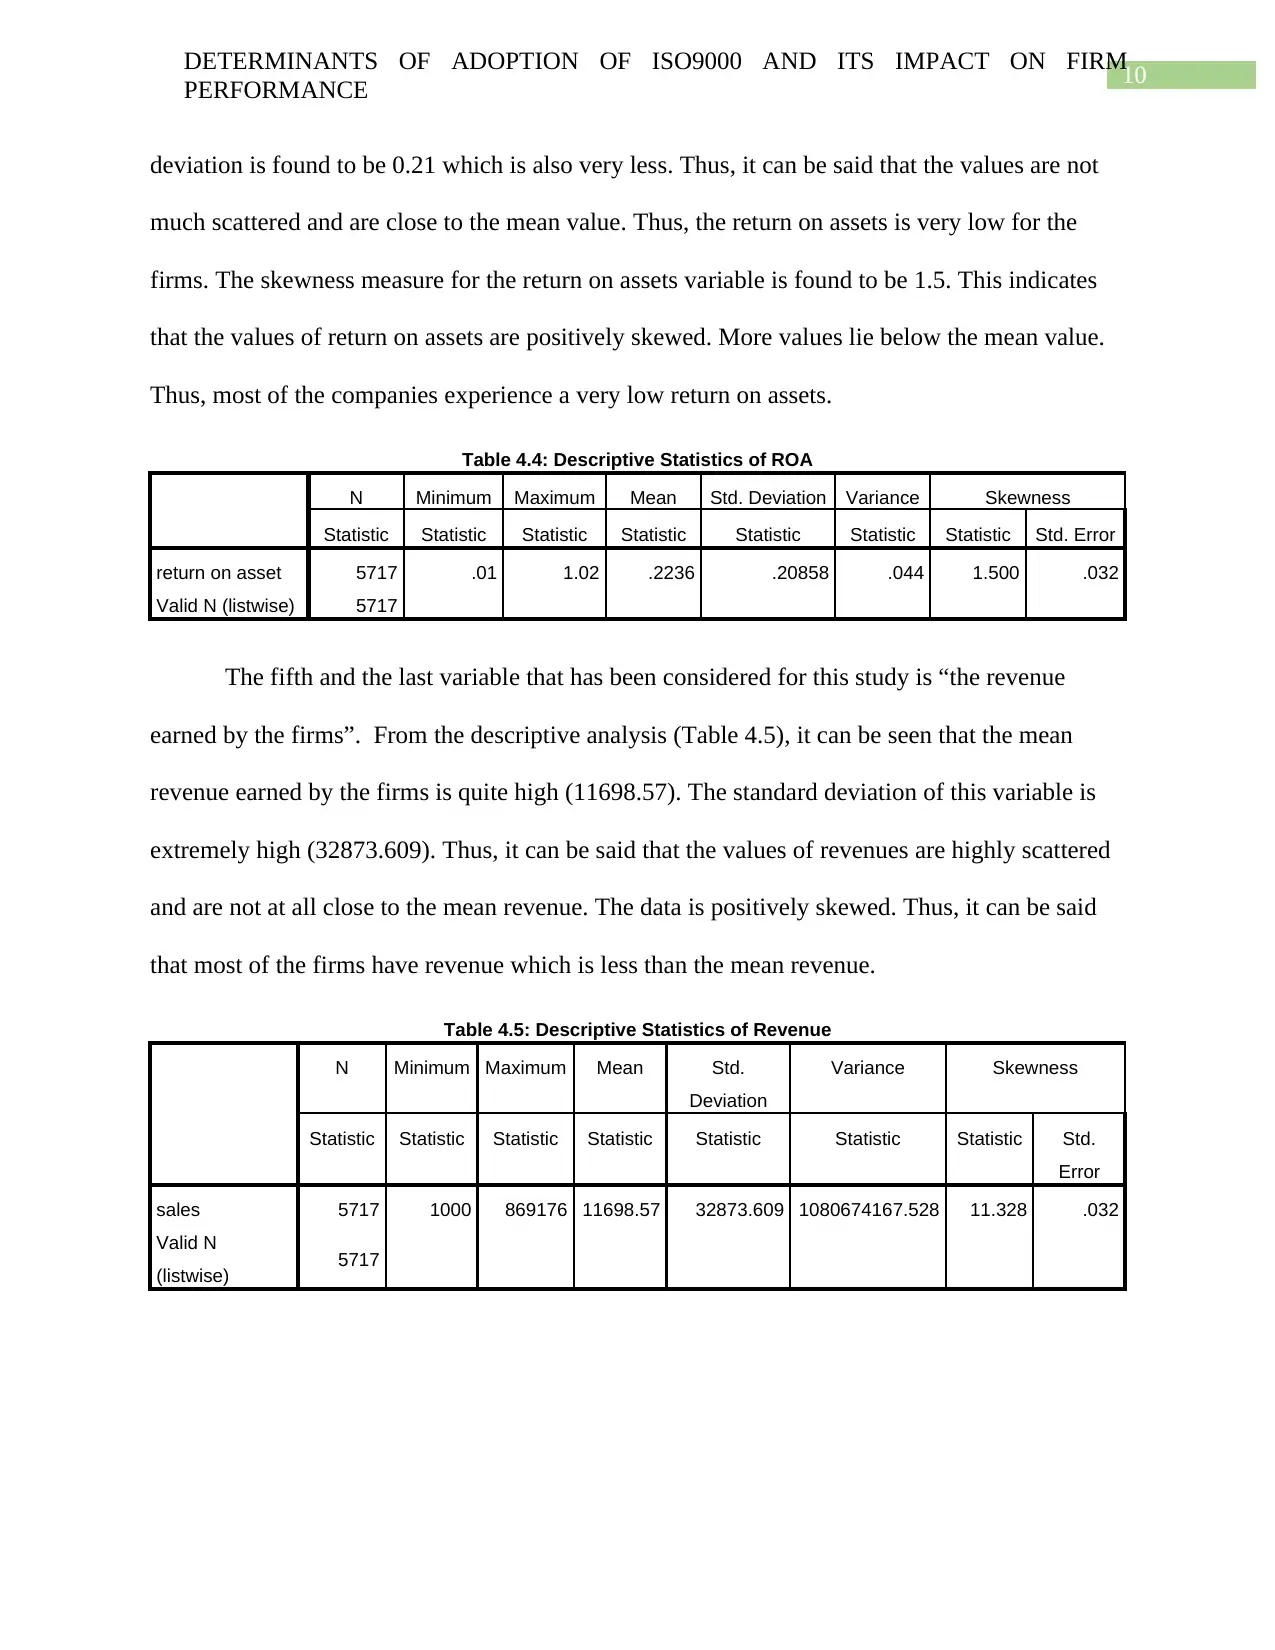
deviation is found to be 0.21 which is also very less. Thus, it can be said that the values are not
much scattered and are close to the mean value. Thus, the return on assets is very low for the
firms. The skewness measure for the return on assets variable is found to be 1.5. This indicates
that the values of return on assets are positively skewed. More values lie below the mean value.
Thus, most of the companies experience a very low return on assets.
Table 4.4: Descriptive Statistics of ROA
N Minimum Maximum Mean Std. Deviation Variance Skewness
Statistic Statistic Statistic Statistic Statistic Statistic Statistic Std. Error
return on asset 5717 .01 1.02 .2236 .20858 .044 1.500 .032
Valid N (listwise) 5717
The fifth and the last variable that has been considered for this study is “the revenue
earned by the firms”. From the descriptive analysis (Table 4.5), it can be seen that the mean
revenue earned by the firms is quite high (11698.57). The standard deviation of this variable is
extremely high (32873.609). Thus, it can be said that the values of revenues are highly scattered
and are not at all close to the mean revenue. The data is positively skewed. Thus, it can be said
that most of the firms have revenue which is less than the mean revenue.
Table 4.5: Descriptive Statistics of Revenue
N Minimum Maximum Mean Std.
Deviation
Variance Skewness
Statistic Statistic Statistic Statistic Statistic Statistic Statistic Std.
Error
sales 5717 1000 869176 11698.57 32873.609 1080674167.528 11.328 .032
Valid N
(listwise) 5717
DETERMINANTS OF ADOPTION OF ISO9000 AND ITS IMPACT ON FIRM
PERFORMANCE
deviation is found to be 0.21 which is also very less. Thus, it can be said that the values are not
much scattered and are close to the mean value. Thus, the return on assets is very low for the
firms. The skewness measure for the return on assets variable is found to be 1.5. This indicates
that the values of return on assets are positively skewed. More values lie below the mean value.
Thus, most of the companies experience a very low return on assets.
Table 4.4: Descriptive Statistics of ROA
N Minimum Maximum Mean Std. Deviation Variance Skewness
Statistic Statistic Statistic Statistic Statistic Statistic Statistic Std. Error
return on asset 5717 .01 1.02 .2236 .20858 .044 1.500 .032
Valid N (listwise) 5717
The fifth and the last variable that has been considered for this study is “the revenue
earned by the firms”. From the descriptive analysis (Table 4.5), it can be seen that the mean
revenue earned by the firms is quite high (11698.57). The standard deviation of this variable is
extremely high (32873.609). Thus, it can be said that the values of revenues are highly scattered
and are not at all close to the mean revenue. The data is positively skewed. Thus, it can be said
that most of the firms have revenue which is less than the mean revenue.
Table 4.5: Descriptive Statistics of Revenue
N Minimum Maximum Mean Std.
Deviation
Variance Skewness
Statistic Statistic Statistic Statistic Statistic Statistic Statistic Std.
Error
sales 5717 1000 869176 11698.57 32873.609 1080674167.528 11.328 .032
Valid N
(listwise) 5717
11
DETERMINANTS OF ADOPTION OF ISO9000 AND ITS IMPACT ON FIRM
PERFORMANCE
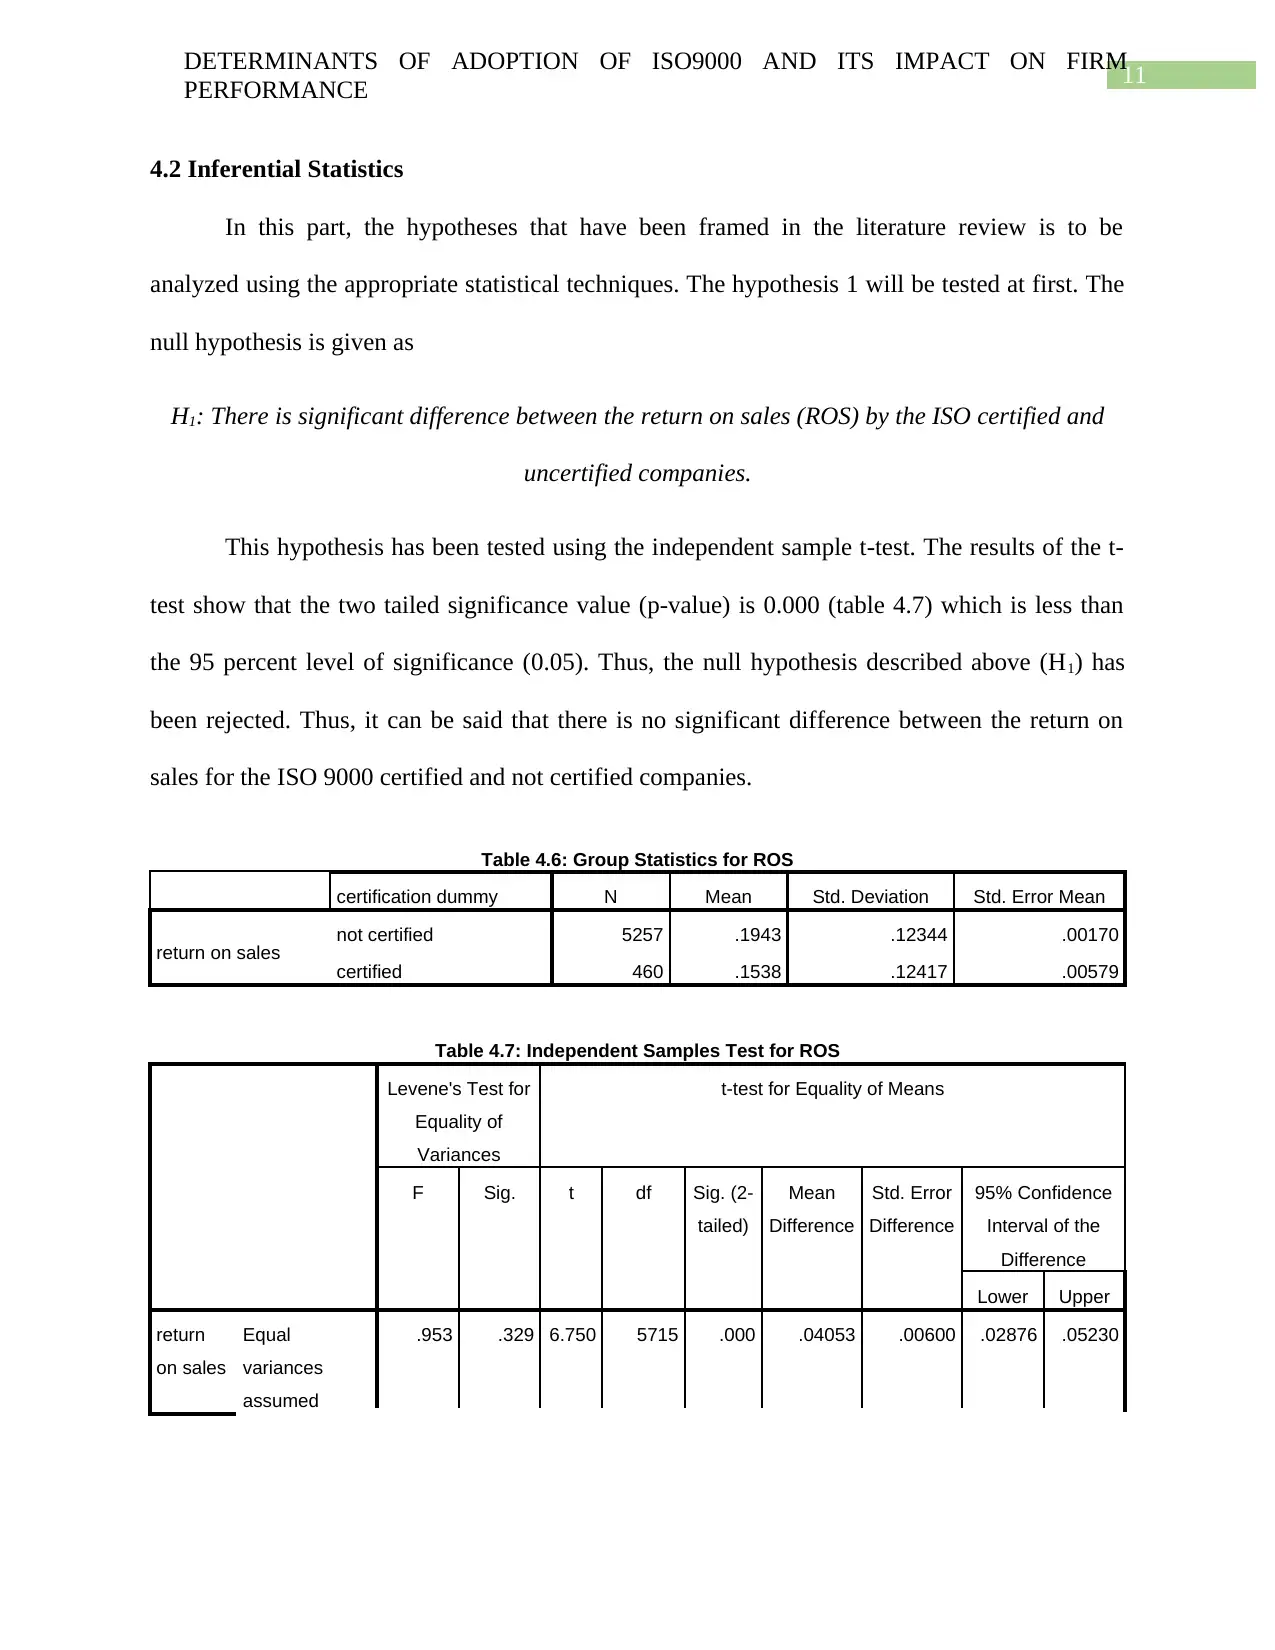
4.2 Inferential Statistics
In this part, the hypotheses that have been framed in the literature review is to be
analyzed using the appropriate statistical techniques. The hypothesis 1 will be tested at first. The
null hypothesis is given as
H1: There is significant difference between the return on sales (ROS) by the ISO certified and
uncertified companies.
This hypothesis has been tested using the independent sample t-test. The results of the t-
test show that the two tailed significance value (p-value) is 0.000 (table 4.7) which is less than
the 95 percent level of significance (0.05). Thus, the null hypothesis described above (H1) has
been rejected. Thus, it can be said that there is no significant difference between the return on
sales for the ISO 9000 certified and not certified companies.
Table 4.6: Group Statistics for ROS
certification dummy N Mean Std. Deviation Std. Error Mean
return on sales not certified 5257 .1943 .12344 .00170
certified 460 .1538 .12417 .00579
Table 4.7: Independent Samples Test for ROS
Levene's Test for
Equality of
Variances
t-test for Equality of Means
F Sig. t df Sig. (2-
tailed)
Mean
Difference
Std. Error
Difference
95% Confidence
Interval of the
Difference
Lower Upper
return
on sales
Equal
variances
assumed
.953 .329 6.750 5715 .000 .04053 .00600 .02876 .05230
DETERMINANTS OF ADOPTION OF ISO9000 AND ITS IMPACT ON FIRM
PERFORMANCE
4.2 Inferential Statistics
In this part, the hypotheses that have been framed in the literature review is to be
analyzed using the appropriate statistical techniques. The hypothesis 1 will be tested at first. The
null hypothesis is given as
H1: There is significant difference between the return on sales (ROS) by the ISO certified and
uncertified companies.
This hypothesis has been tested using the independent sample t-test. The results of the t-
test show that the two tailed significance value (p-value) is 0.000 (table 4.7) which is less than
the 95 percent level of significance (0.05). Thus, the null hypothesis described above (H1) has
been rejected. Thus, it can be said that there is no significant difference between the return on
sales for the ISO 9000 certified and not certified companies.
Table 4.6: Group Statistics for ROS
certification dummy N Mean Std. Deviation Std. Error Mean
return on sales not certified 5257 .1943 .12344 .00170
certified 460 .1538 .12417 .00579
Table 4.7: Independent Samples Test for ROS
Levene's Test for
Equality of
Variances
t-test for Equality of Means
F Sig. t df Sig. (2-
tailed)
Mean
Difference
Std. Error
Difference
95% Confidence
Interval of the
Difference
Lower Upper
return
on sales
Equal
variances
assumed
.953 .329 6.750 5715 .000 .04053 .00600 .02876 .05230
⊘ This is a preview!⊘
Do you want full access?
Subscribe today to unlock all pages.
Trusted by 1+ million students worldwide
1 out of 20
Related Documents


Your All-in-One AI-Powered Toolkit for Academic Success.
+13062052269
info@desklib.com
Available 24*7 on WhatsApp / Email
![[object Object]](/_next/static/media/star-bottom.7253800d.svg)
Unlock your academic potential
Copyright © 2020–2026 A2Z Services. All Rights Reserved. Developed and managed by ZUCOL.