The Adoption of ISO 9000 and Its Impact on Firm Performance: A Study
VerifiedAdded on 2021/06/14
|19
|4534
|48
Report
AI Summary
This report investigates the determinants of ISO 9000 adoption and its subsequent impact on firm performance, focusing on service firms in China. The study utilizes census data collected from 5717 firms by the National Bureau of Statistics of China, employing descriptive and inferential statistics such as Pearson correlation and paired sample t-tests to analyze the data. Key findings reveal the importance of employee numbers and education levels in determining firm size and management practices. The report examines the effects of ISO 9000 certification on financial and operational performance, reviewing relevant literature and providing insights into the benefits of ISO 9000 adoption, including improved management quality, enhanced financial outcomes, and external perspectives. The methodology includes data collection through questionnaires, detailed statistical analysis, and the interpretation of results to understand the relationship between ISO 9000 certification and firm success. The report concludes with recommendations for managers to consider employee characteristics and the implications of ISO 9000 certification for improved business outcomes.
Determinants of adoption of ISO 9000 and
its impact on firm performance
its impact on firm performance
Paraphrase This Document
Need a fresh take? Get an instant paraphrase of this document with our AI Paraphraser
Executive summary
The major purpose of this report was to assess the determinants of the adoption of ISO 9000 and
the impacts on the performance of the firms. The methods employed in data collection was
questionnaires through census that was conducted on the 5717 firms by the National Bureau of
Statistics of China. Descriptive such as mean, standard deviation etc. and inferential statistics
were used in the analysis of the collected data from the firms. The inferential statistics that were
used were Pearson correlation coefficient and the paired sample t-test. From the results the
number of employees was one of the factors that could be considered in the determination of the
size of the firm. The managers are advised to consider the number of employees and the level of
education when engaging or giving them contract.
Introduction
One of the major concerns of industries around the world is the quality of management for the
betterment of their operations. In the efforts made to improve the management quality of the
firms, ISO 9000 was developed and brought to being whose main aim was to give guidance tools
to the firms ensuring that the goods and services’ production is as per the customers’ desire and
of good quality Montiel, I., Husted, B. W., & Christmann, P. (2012). Since the emergence of ISO
9000 back in the year 1987, it has gained increasing popularity and adopted by both big and
small companies since it outlines the companies’ management operations. One of the functions
of the international standards organization (ISO) is to ensure that the design of products are at
per with the preset standards Lo et al., (2013). Almost 187 countries have adopted ISO 9000 in
the management of their companies and quality assurance since 1987. This report is focused in
achieving some of the goals by the end as stated below;
Objectives
Genera objective of this report was to determine the adoption of ISO 9000 and the impacts it has
on the performance of the firms.
Specific objectives
1. Assessing the impacts of adopting ISO 9000 in the financial performance of the firms
2. Assessing the effects of certifying a firm with ISO 9000 on the management of the firms
Better understanding will be rooted through achieving the two aforementioned objectives on the
determinants and impacts of adopting ISO 9000. The effects of certifications of the firms with
ISO 9000 in the firms’ management will as well be clarified.
⊘ This is a preview!⊘
Do you want full access?
Subscribe today to unlock all pages.
Trusted by 1+ million students worldwide
Literature review
Several researches have been conducted by the researchers around the world in relation to the
impacts of ISO 9000 since the time it came to being on the effects and success in business
performance Zhu, Q., Cordeiro, J., & Sarkis, J. (2013). Out of all the literatures available in
regards to ISO 9000, they will be reviewed to bring support to the results that will be achieved in
this report to review the impacts of ISO 9000 on the firms that adopt its use. Some of the
previous studies explained that ISO certification results to improved firm’s financial
performance Terziovski, M., & Guerrero, J. L. (2014). Further, the reviews of literatures over
ISO 9000 tried to show the components that could have effects and links on achieving the
financial performance with some of the involved financial benefits Ullah, B., Wei, Z., & Xie, F.
(2014). The measure of ISO 9000 can be done indirectly in the determination of the financial
performance by employing ample conceptual framework Tarí, J. J., Molina-Azorín, J. F., &
Heras, I. (2012). Measure of the success of ISO 9000 certification can be achieved by
considering the effectiveness of certification Mokhtar, M. Z., & Muda, M. S. (2012). Although
direct relationship might not exist between the financial performance and ISO, the operational
performance could be directly increased due to its direct effect on increasing the financial
performance. One of the most important benefits enjoyed from certification of the firms are the
external perspectives which could be achieved from the valuation of ISO implementation
impacts. In regards to that, more of the welfares of ISO 9000 are perceived to be external in
nature that showed greater operative performance Starke et al., (2012).
Business organizations adopt ISO 9000 with the focus of having quality addition on the ways the
business organizations are managed Prajogo, D., Huo, B., & Han, Z. (2012). Consequently,
adopting and incorporating ISO 9000 in business organization were towards developing the firms
Paraphrase This Document
Need a fresh take? Get an instant paraphrase of this document with our AI Paraphraser
and gearing them towards enjoying the maximum benefits instead of when it was used for non-
developmental reasons which would make them enjoy less benefits Heras-Saizarbitoria, I., &
Boiral, O. (2015). To seal and realize the benefits from ISO 9000, evaluation of companies
should be in accordance to their goals and categories independently to identify ISO 9000 benefits
Campos et al., (2015). Companies that are certified by ISO 9000 showed increased profits when
market differentiation strategy is carried out in operationalization cost leadership strategy. ISO
9000 gives some of the benefits that act as the motivational factors that are important when
carrying out positive predictions Abad, J., Lafuente, E., & Vilajosana, J. (2013). In order to cope
up with the everyday changes in the business environment and have particular focus on the
improvements of business operation, ISO have to be taken through series of updates to address
such changes. Level of practices in ISO 9000 certified companies is higher as compared to those
which are non-ISO 9000. All business operations consider time as a great factor for their
effectiveness felt. Due to that, companies that were long certified showed great and better
improvements of the TQM results than the ones that were newly certified by ISO 9000.
Companies that are certified with latest updated ISO with time realize more benefits as compared
to those companies that were certified with the traditional or non-updated or older versions of
ISO 9000 Nguyen, Q. A., & Hens, L. (2015). The improvement of financial performance of
businesses can be easily analyzed and visualized for companies certified with ISO 9000 using 3-
5 years period of post-certified.
Businesses and companies irrespective of their sizes are adopting ISO 9000 in their daily
management activities. The size of the company or the business does not have any impact upon
certification with ISO 9000 hence the effects remain constant Pereira-Moliner, J., Claver-Cortés,
E., Molina-Azorín, J. F., & Tarí, J. J. (2012). Different factors such as the area coverage of the
company, the number of employees a company have do not show any significant effect on the
implementation of ISO 9000 performance. Positive effects are realized on companies’
operational performance when they are certified with ISO 9000. Bids and general external
benefits are among other benefits that companies enjoy when they are certified with ISO 9000
hence improving their performances.
⊘ This is a preview!⊘
Do you want full access?
Subscribe today to unlock all pages.
Trusted by 1+ million students worldwide
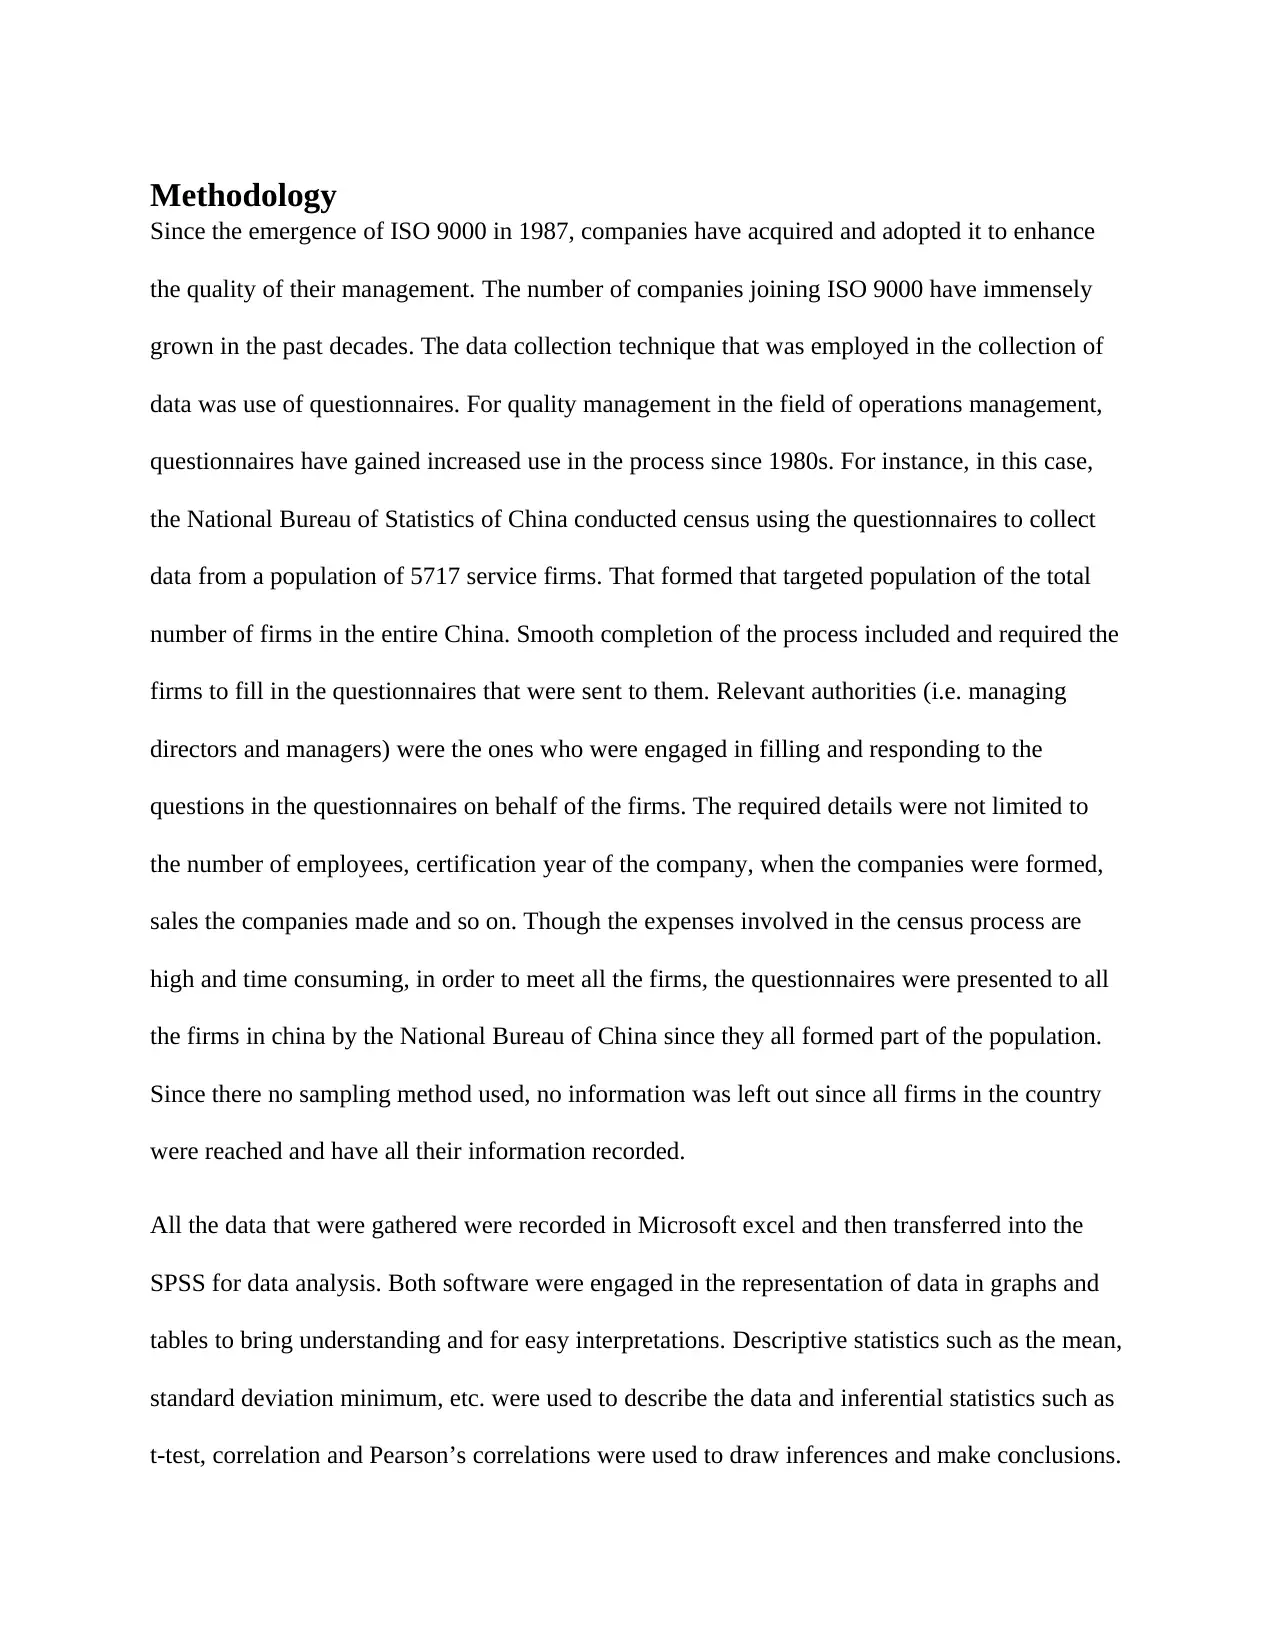
Methodology
Since the emergence of ISO 9000 in 1987, companies have acquired and adopted it to enhance
the quality of their management. The number of companies joining ISO 9000 have immensely
grown in the past decades. The data collection technique that was employed in the collection of
data was use of questionnaires. For quality management in the field of operations management,
questionnaires have gained increased use in the process since 1980s. For instance, in this case,
the National Bureau of Statistics of China conducted census using the questionnaires to collect
data from a population of 5717 service firms. That formed that targeted population of the total
number of firms in the entire China. Smooth completion of the process included and required the
firms to fill in the questionnaires that were sent to them. Relevant authorities (i.e. managing
directors and managers) were the ones who were engaged in filling and responding to the
questions in the questionnaires on behalf of the firms. The required details were not limited to
the number of employees, certification year of the company, when the companies were formed,
sales the companies made and so on. Though the expenses involved in the census process are
high and time consuming, in order to meet all the firms, the questionnaires were presented to all
the firms in china by the National Bureau of China since they all formed part of the population.
Since there no sampling method used, no information was left out since all firms in the country
were reached and have all their information recorded.
All the data that were gathered were recorded in Microsoft excel and then transferred into the
SPSS for data analysis. Both software were engaged in the representation of data in graphs and
tables to bring understanding and for easy interpretations. Descriptive statistics such as the mean,
standard deviation minimum, etc. were used to describe the data and inferential statistics such as
t-test, correlation and Pearson’s correlations were used to draw inferences and make conclusions.
Paraphrase This Document
Need a fresh take? Get an instant paraphrase of this document with our AI Paraphraser
The population parameter of the firms concerning the adoption of ISO 9000 was obtained from
the census data since all the firms in china were involved. Due to the accuracy of the data
obtained from the censuring process that included all the firms, the data can be relied upon when
determining the adoption and impacts of ISO 9000 on the determination of the certification and
financial performance of the firms.
Results
This part of the report contains the findings that will give support to the objectives and research
questions concerning the impacts of the adoption of ISO 9000 on the performance of the firms.
Descriptive statistics and inferential statistics will all be calculated to confirm whether or not ISO
9000 resulted to some impacts on financial performance in the service companies.
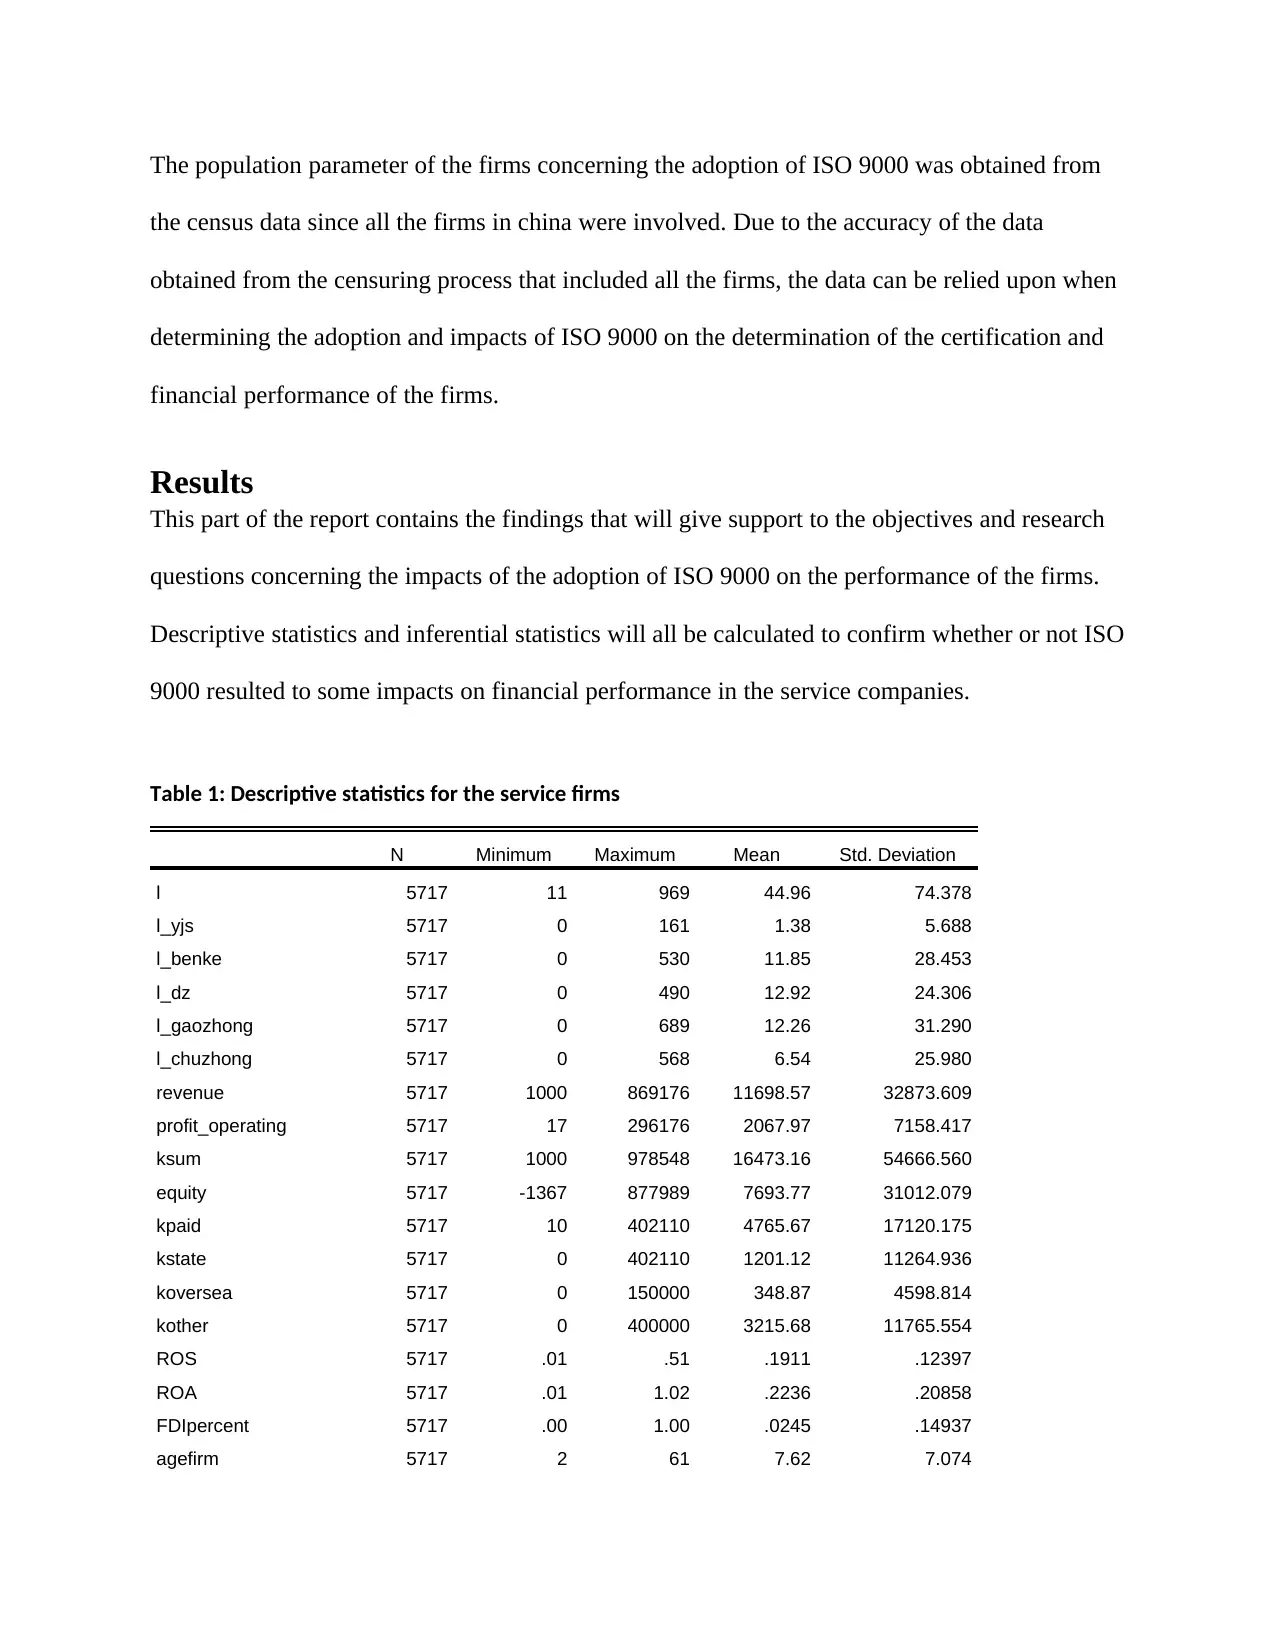
Table 1: Descriptive statistics for the service firms
N Minimum Maximum Mean Std. Deviation
l 5717 11 969 44.96 74.378
l_yjs 5717 0 161 1.38 5.688
l_benke 5717 0 530 11.85 28.453
l_dz 5717 0 490 12.92 24.306
l_gaozhong 5717 0 689 12.26 31.290
l_chuzhong 5717 0 568 6.54 25.980
revenue 5717 1000 869176 11698.57 32873.609
profit_operating 5717 17 296176 2067.97 7158.417
ksum 5717 1000 978548 16473.16 54666.560
equity 5717 -1367 877989 7693.77 31012.079
kpaid 5717 10 402110 4765.67 17120.175
kstate 5717 0 402110 1201.12 11264.936
koversea 5717 0 150000 348.87 4598.814
kother 5717 0 400000 3215.68 11765.554
ROS 5717 .01 .51 .1911 .12397
ROA 5717 .01 1.02 .2236 .20858
FDIpercent 5717 .00 1.00 .0245 .14937
agefirm 5717 2 61 7.62 7.074
the census data since all the firms in china were involved. Due to the accuracy of the data
obtained from the censuring process that included all the firms, the data can be relied upon when
determining the adoption and impacts of ISO 9000 on the determination of the certification and
financial performance of the firms.
Results
This part of the report contains the findings that will give support to the objectives and research
questions concerning the impacts of the adoption of ISO 9000 on the performance of the firms.
Descriptive statistics and inferential statistics will all be calculated to confirm whether or not ISO
9000 resulted to some impacts on financial performance in the service companies.
Table 1: Descriptive statistics for the service firms
N Minimum Maximum Mean Std. Deviation
l 5717 11 969 44.96 74.378
l_yjs 5717 0 161 1.38 5.688
l_benke 5717 0 530 11.85 28.453
l_dz 5717 0 490 12.92 24.306
l_gaozhong 5717 0 689 12.26 31.290
l_chuzhong 5717 0 568 6.54 25.980
revenue 5717 1000 869176 11698.57 32873.609
profit_operating 5717 17 296176 2067.97 7158.417
ksum 5717 1000 978548 16473.16 54666.560
equity 5717 -1367 877989 7693.77 31012.079
kpaid 5717 10 402110 4765.67 17120.175
kstate 5717 0 402110 1201.12 11264.936
koversea 5717 0 150000 348.87 4598.814
kother 5717 0 400000 3215.68 11765.554
ROS 5717 .01 .51 .1911 .12397
ROA 5717 .01 1.02 .2236 .20858
FDIpercent 5717 .00 1.00 .0245 .14937
agefirm 5717 2 61 7.62 7.074
Valid N (listwise) 5717
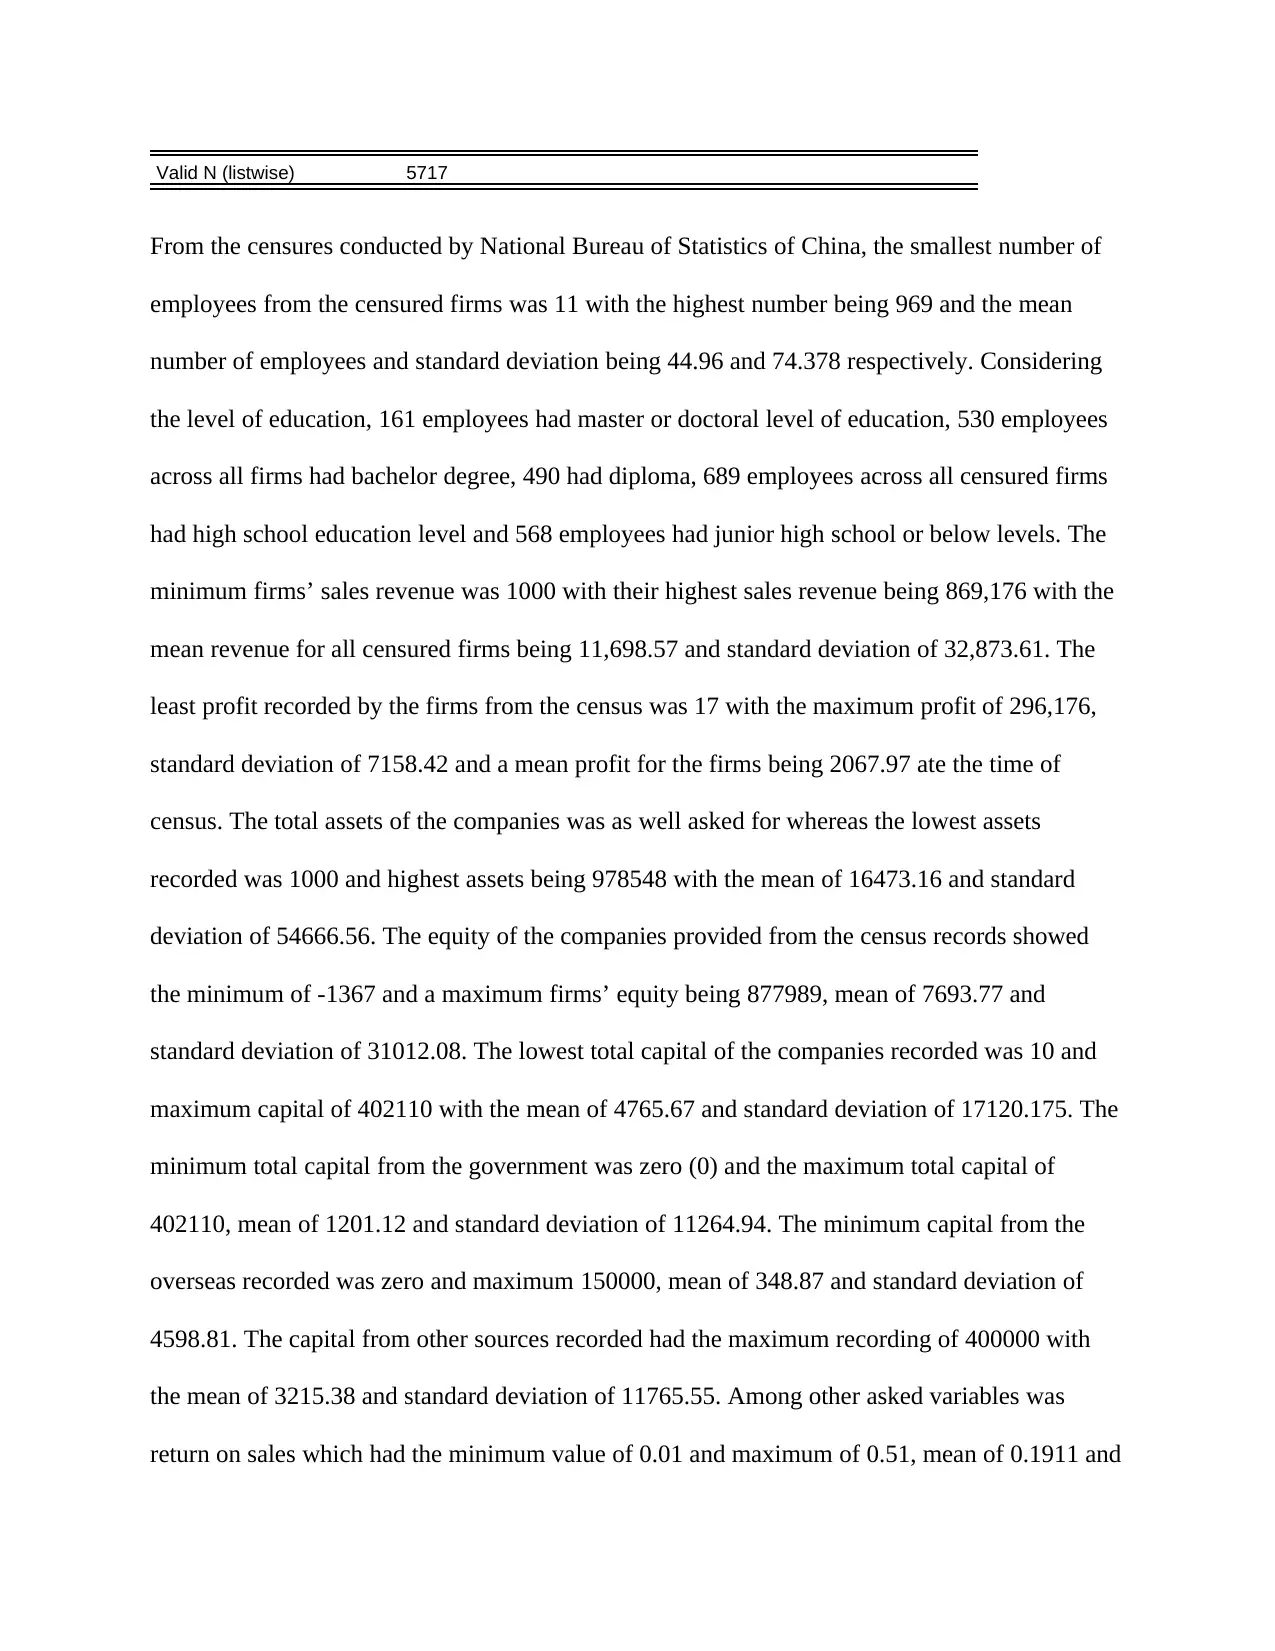
From the censures conducted by National Bureau of Statistics of China, the smallest number of
employees from the censured firms was 11 with the highest number being 969 and the mean
number of employees and standard deviation being 44.96 and 74.378 respectively. Considering
the level of education, 161 employees had master or doctoral level of education, 530 employees
across all firms had bachelor degree, 490 had diploma, 689 employees across all censured firms
had high school education level and 568 employees had junior high school or below levels. The
minimum firms’ sales revenue was 1000 with their highest sales revenue being 869,176 with the
mean revenue for all censured firms being 11,698.57 and standard deviation of 32,873.61. The
least profit recorded by the firms from the census was 17 with the maximum profit of 296,176,
standard deviation of 7158.42 and a mean profit for the firms being 2067.97 ate the time of
census. The total assets of the companies was as well asked for whereas the lowest assets
recorded was 1000 and highest assets being 978548 with the mean of 16473.16 and standard
deviation of 54666.56. The equity of the companies provided from the census records showed
the minimum of -1367 and a maximum firms’ equity being 877989, mean of 7693.77 and
standard deviation of 31012.08. The lowest total capital of the companies recorded was 10 and
maximum capital of 402110 with the mean of 4765.67 and standard deviation of 17120.175. The
minimum total capital from the government was zero (0) and the maximum total capital of
402110, mean of 1201.12 and standard deviation of 11264.94. The minimum capital from the
overseas recorded was zero and maximum 150000, mean of 348.87 and standard deviation of
4598.81. The capital from other sources recorded had the maximum recording of 400000 with
the mean of 3215.38 and standard deviation of 11765.55. Among other asked variables was
return on sales which had the minimum value of 0.01 and maximum of 0.51, mean of 0.1911 and
⊘ This is a preview!⊘
Do you want full access?
Subscribe today to unlock all pages.
Trusted by 1+ million students worldwide
standard deviation of 0.12397. On the other hand, the minimum returns on assets recorded was
0.01 and maximum of 1.02 with the mean of 0.2236 and standard deviation of 0.20858. The
minimum percentage of the overseas investment in the total investment was 0.00 with the
maximum percentage being 1.00 with the mean of 0.0245 and standard deviation of 0.14937.
Finally, the minimum age of certification for the firms with ISO 9000 was 2 years and oldest
firm certified with ISO was 61 years with the mean age of 7.62 and standard deviation of 7.074.
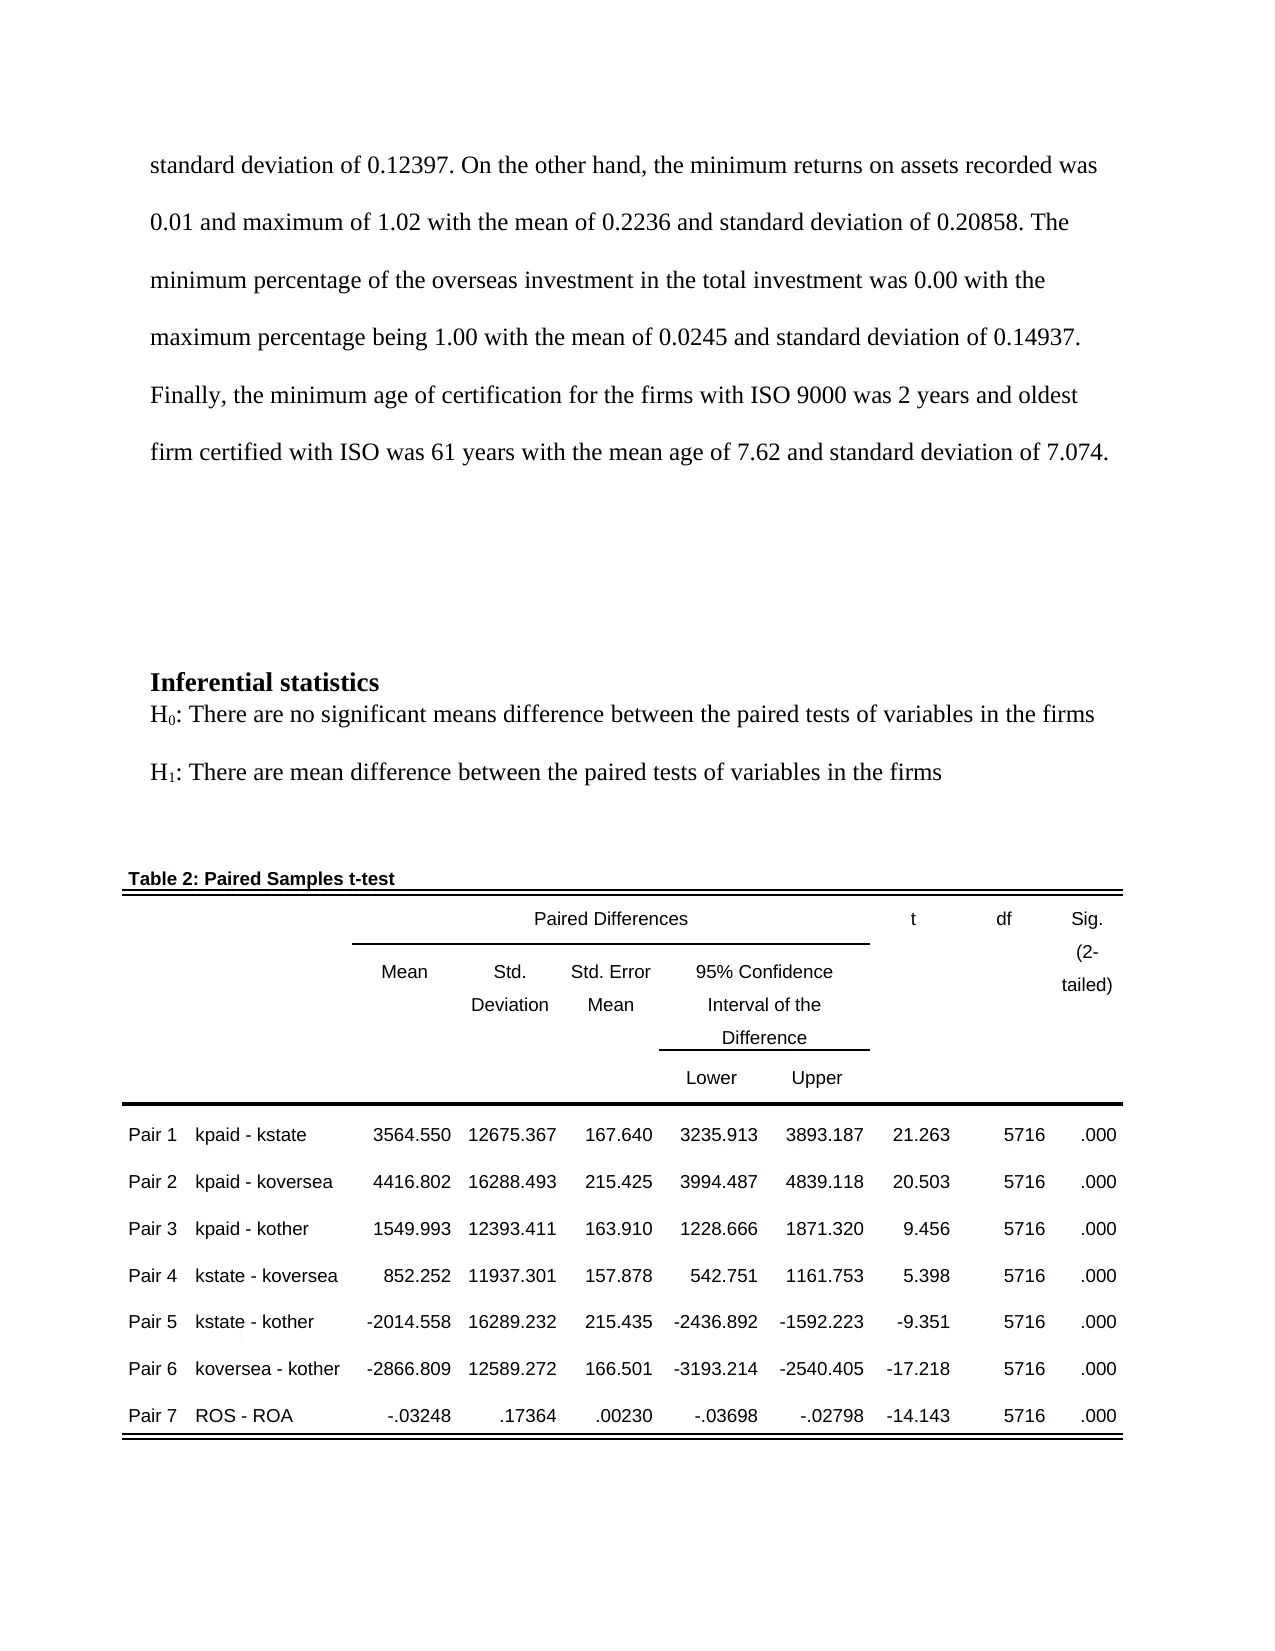
Inferential statistics
H0: There are no significant means difference between the paired tests of variables in the firms
H1: There are mean difference between the paired tests of variables in the firms
Table 2: Paired Samples t-test
Paired Differences t df Sig.
(2-
tailed)
Mean Std.
Deviation
Std. Error
Mean
95% Confidence
Interval of the
Difference
Lower Upper
Pair 1 kpaid - kstate 3564.550 12675.367 167.640 3235.913 3893.187 21.263 5716 .000
Pair 2 kpaid - koversea 4416.802 16288.493 215.425 3994.487 4839.118 20.503 5716 .000
Pair 3 kpaid - kother 1549.993 12393.411 163.910 1228.666 1871.320 9.456 5716 .000
Pair 4 kstate - koversea 852.252 11937.301 157.878 542.751 1161.753 5.398 5716 .000
Pair 5 kstate - kother -2014.558 16289.232 215.435 -2436.892 -1592.223 -9.351 5716 .000
Pair 6 koversea - kother -2866.809 12589.272 166.501 -3193.214 -2540.405 -17.218 5716 .000
Pair 7 ROS - ROA -.03248 .17364 .00230 -.03698 -.02798 -14.143 5716 .000
0.01 and maximum of 1.02 with the mean of 0.2236 and standard deviation of 0.20858. The
minimum percentage of the overseas investment in the total investment was 0.00 with the
maximum percentage being 1.00 with the mean of 0.0245 and standard deviation of 0.14937.
Finally, the minimum age of certification for the firms with ISO 9000 was 2 years and oldest
firm certified with ISO was 61 years with the mean age of 7.62 and standard deviation of 7.074.
Inferential statistics
H0: There are no significant means difference between the paired tests of variables in the firms
H1: There are mean difference between the paired tests of variables in the firms
Table 2: Paired Samples t-test
Paired Differences t df Sig.
(2-
tailed)
Mean Std.
Deviation
Std. Error
Mean
95% Confidence
Interval of the
Difference
Lower Upper
Pair 1 kpaid - kstate 3564.550 12675.367 167.640 3235.913 3893.187 21.263 5716 .000
Pair 2 kpaid - koversea 4416.802 16288.493 215.425 3994.487 4839.118 20.503 5716 .000
Pair 3 kpaid - kother 1549.993 12393.411 163.910 1228.666 1871.320 9.456 5716 .000
Pair 4 kstate - koversea 852.252 11937.301 157.878 542.751 1161.753 5.398 5716 .000
Pair 5 kstate - kother -2014.558 16289.232 215.435 -2436.892 -1592.223 -9.351 5716 .000
Pair 6 koversea - kother -2866.809 12589.272 166.501 -3193.214 -2540.405 -17.218 5716 .000
Pair 7 ROS - ROA -.03248 .17364 .00230 -.03698 -.02798 -14.143 5716 .000
Paraphrase This Document
Need a fresh take? Get an instant paraphrase of this document with our AI Paraphraser
From the paired t-test conducted between the total capital and the capital from the government,
(p<0.05) showing that there no statistical significant difference between the two variables in the
first pair. No statistical significant difference was as well tested between total capital paid and
the capital from the overseas since (p<0.05). Between total capital and the capital from other
sources showed not to have statistical significance since (p<0.05). For the test of the statistical
mean difference between capitals from the government and capital from the overseas showed no
significant difference. The same was tested between capital from the overseas and capital from
other sources as well as the test of significant difference between return on sales and returns on
assets since they all had the significant test (p<0.05). From the aforementioned test results, the
null hypothesis would be rejected and conclude otherwise that there were mean difference
between the tested variables in the pairs from the first to the sixth pair.
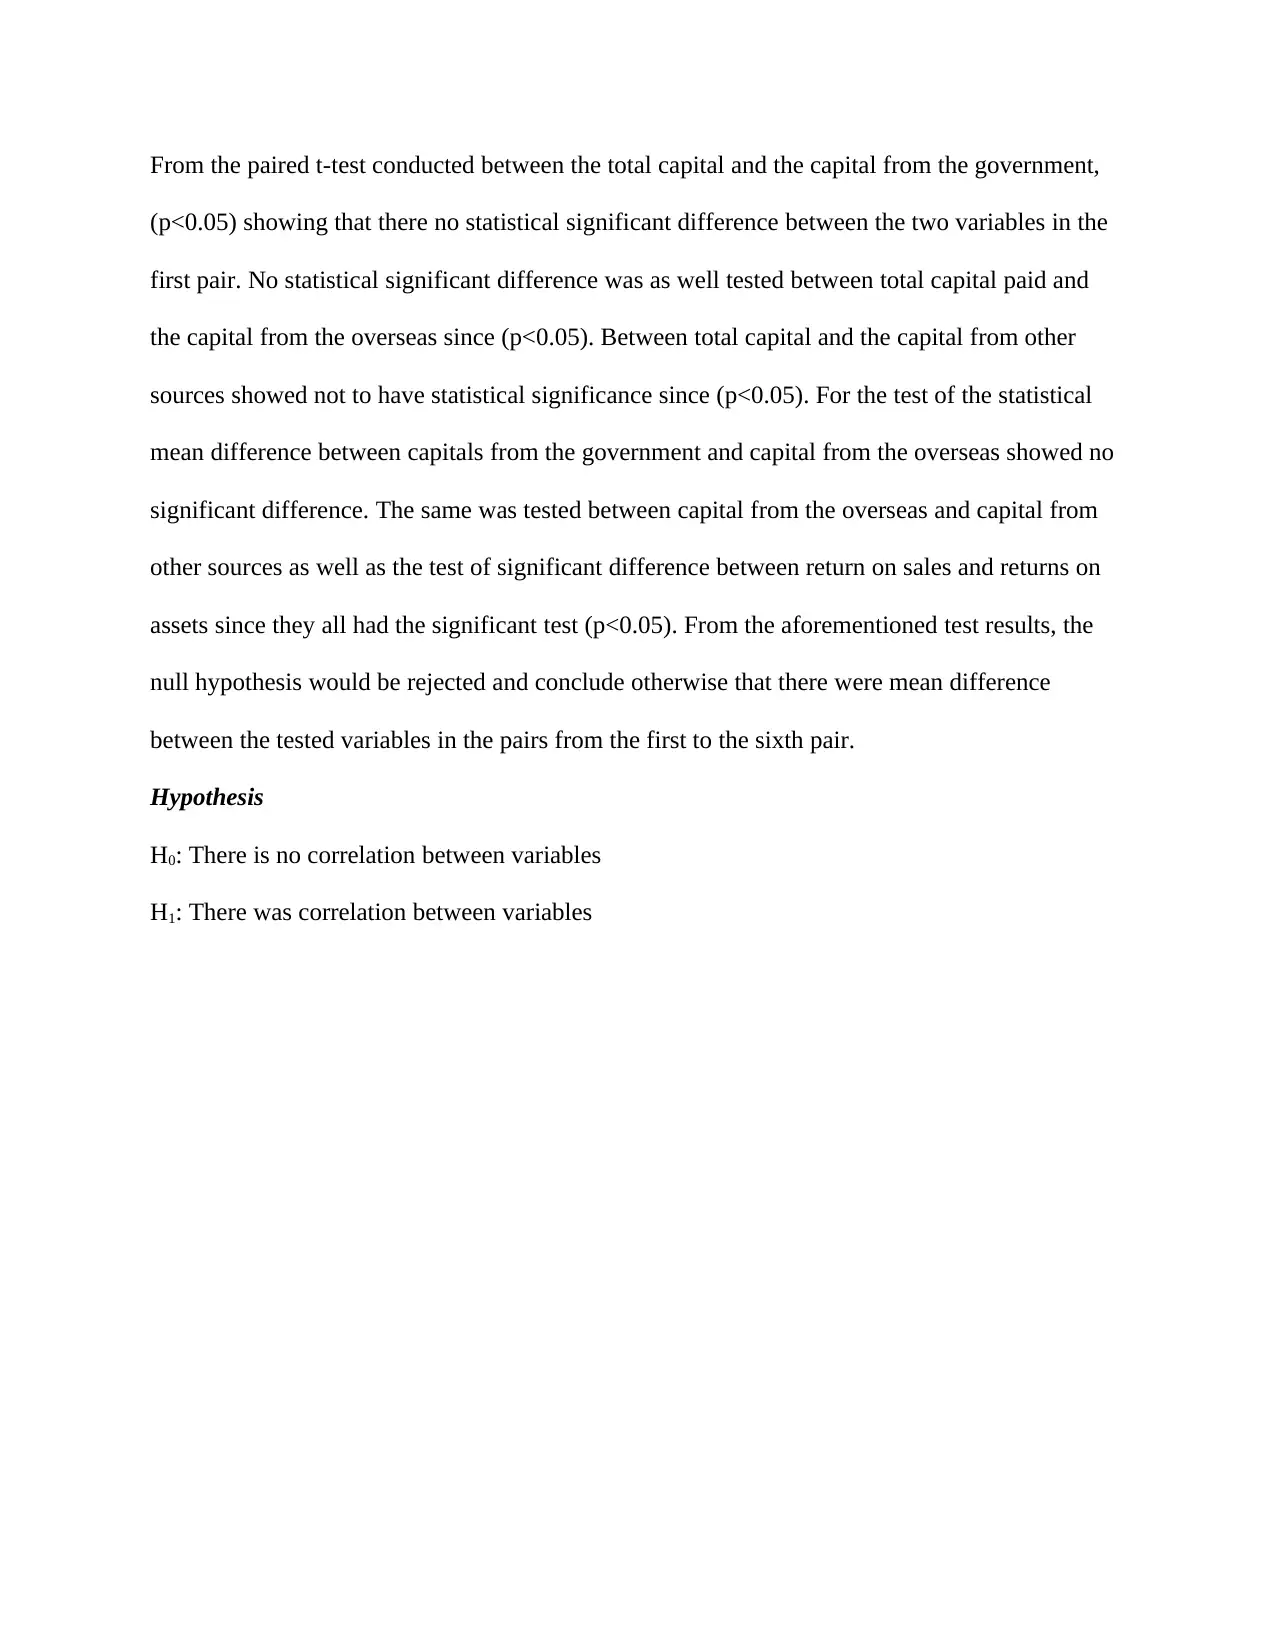
Hypothesis
H0: There is no correlation between variables
H1: There was correlation between variables
(p<0.05) showing that there no statistical significant difference between the two variables in the
first pair. No statistical significant difference was as well tested between total capital paid and
the capital from the overseas since (p<0.05). Between total capital and the capital from other
sources showed not to have statistical significance since (p<0.05). For the test of the statistical
mean difference between capitals from the government and capital from the overseas showed no
significant difference. The same was tested between capital from the overseas and capital from
other sources as well as the test of significant difference between return on sales and returns on
assets since they all had the significant test (p<0.05). From the aforementioned test results, the
null hypothesis would be rejected and conclude otherwise that there were mean difference
between the tested variables in the pairs from the first to the sixth pair.
Hypothesis
H0: There is no correlation between variables
H1: There was correlation between variables
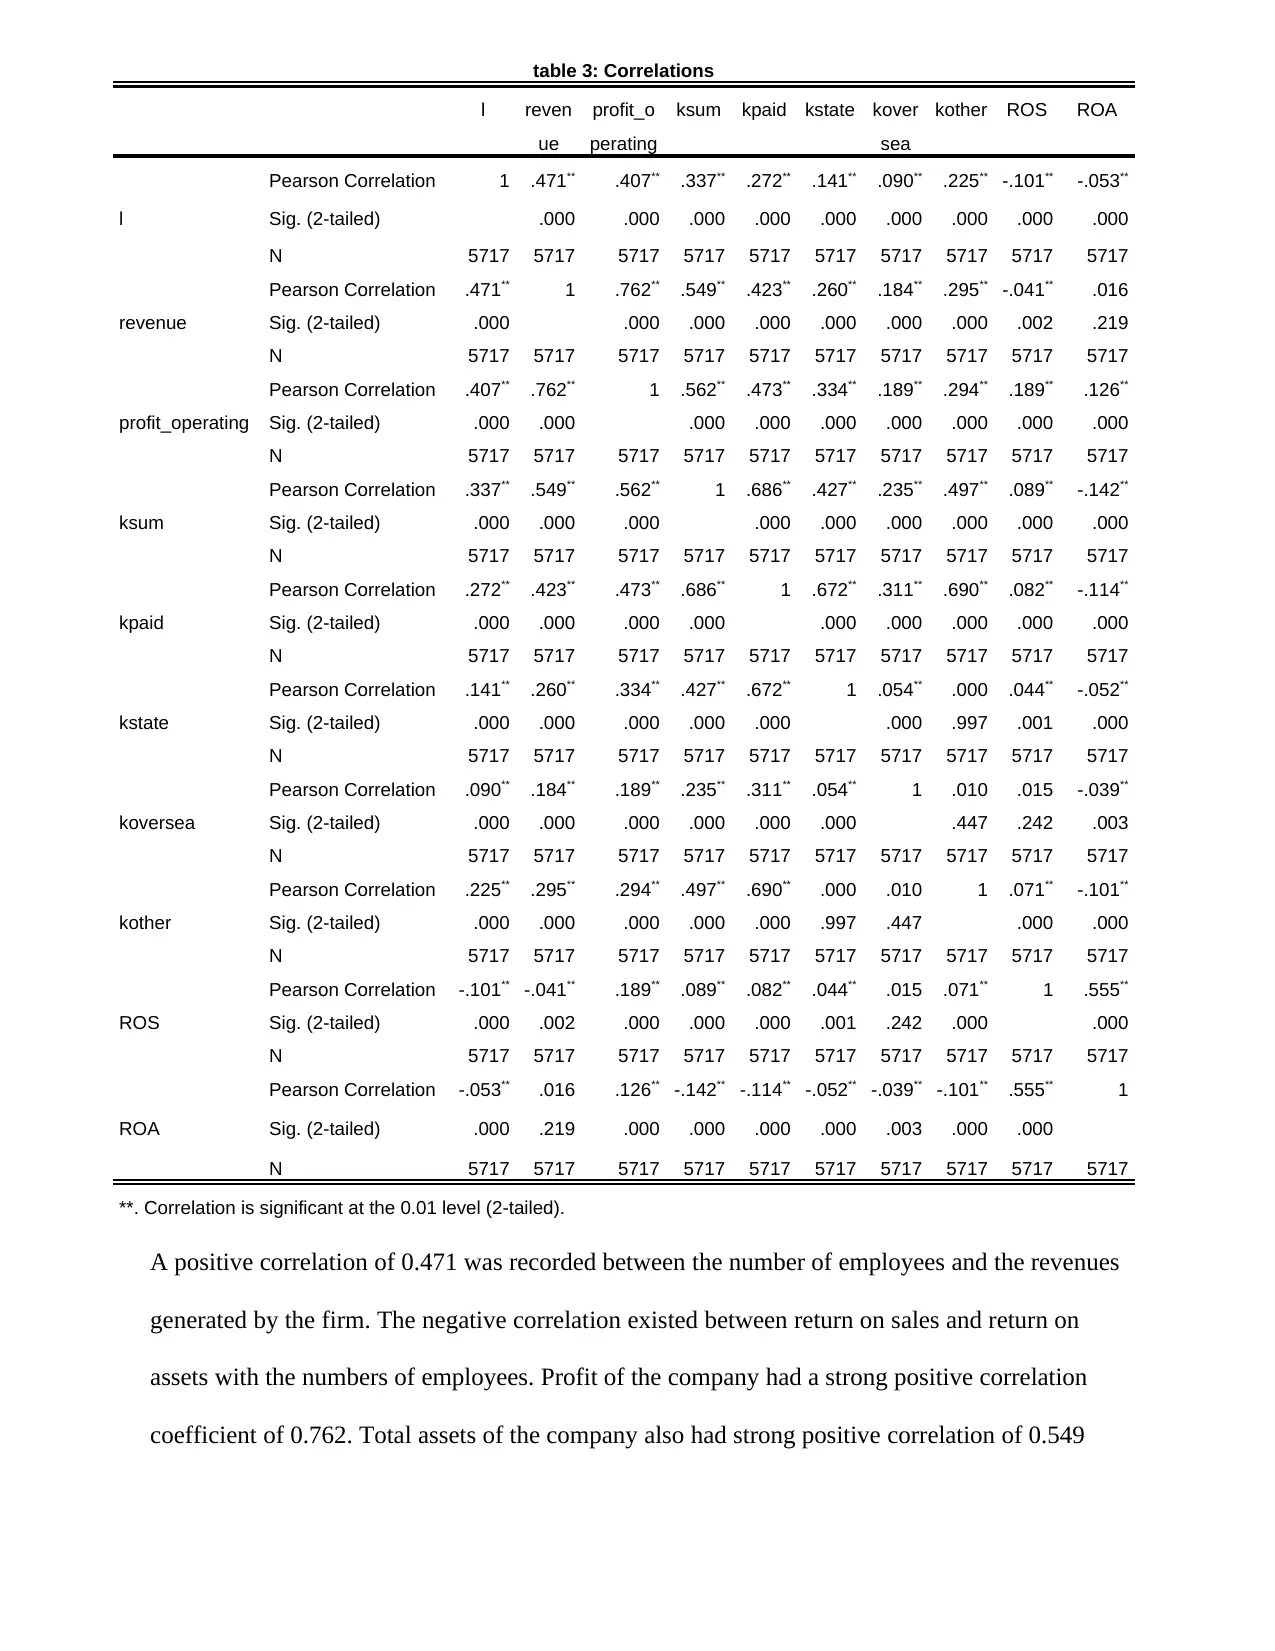
A positive correlation of 0.471 was recorded between the number of employees and the revenues
generated by the firm. The negative correlation existed between return on sales and return on
assets with the numbers of employees. Profit of the company had a strong positive correlation
coefficient of 0.762. Total assets of the company also had strong positive correlation of 0.549
table 3: Correlations
l reven
ue
profit_o
perating
ksum kpaid kstate kover
sea
kother ROS ROA
l
Pearson Correlation 1 .471** .407** .337** .272** .141** .090** .225** -.101** -.053**
Sig. (2-tailed) .000 .000 .000 .000 .000 .000 .000 .000 .000
N 5717 5717 5717 5717 5717 5717 5717 5717 5717 5717
revenue
Pearson Correlation .471** 1 .762** .549** .423** .260** .184** .295** -.041** .016
Sig. (2-tailed) .000 .000 .000 .000 .000 .000 .000 .002 .219
N 5717 5717 5717 5717 5717 5717 5717 5717 5717 5717
profit_operating
Pearson Correlation .407** .762** 1 .562** .473** .334** .189** .294** .189** .126**
Sig. (2-tailed) .000 .000 .000 .000 .000 .000 .000 .000 .000
N 5717 5717 5717 5717 5717 5717 5717 5717 5717 5717
ksum
Pearson Correlation .337** .549** .562** 1 .686** .427** .235** .497** .089** -.142**
Sig. (2-tailed) .000 .000 .000 .000 .000 .000 .000 .000 .000
N 5717 5717 5717 5717 5717 5717 5717 5717 5717 5717
kpaid
Pearson Correlation .272** .423** .473** .686** 1 .672** .311** .690** .082** -.114**
Sig. (2-tailed) .000 .000 .000 .000 .000 .000 .000 .000 .000
N 5717 5717 5717 5717 5717 5717 5717 5717 5717 5717
kstate
Pearson Correlation .141** .260** .334** .427** .672** 1 .054** .000 .044** -.052**
Sig. (2-tailed) .000 .000 .000 .000 .000 .000 .997 .001 .000
N 5717 5717 5717 5717 5717 5717 5717 5717 5717 5717
koversea
Pearson Correlation .090** .184** .189** .235** .311** .054** 1 .010 .015 -.039**
Sig. (2-tailed) .000 .000 .000 .000 .000 .000 .447 .242 .003
N 5717 5717 5717 5717 5717 5717 5717 5717 5717 5717
kother
Pearson Correlation .225** .295** .294** .497** .690** .000 .010 1 .071** -.101**
Sig. (2-tailed) .000 .000 .000 .000 .000 .997 .447 .000 .000
N 5717 5717 5717 5717 5717 5717 5717 5717 5717 5717
ROS
Pearson Correlation -.101** -.041** .189** .089** .082** .044** .015 .071** 1 .555**
Sig. (2-tailed) .000 .002 .000 .000 .000 .001 .242 .000 .000
N 5717 5717 5717 5717 5717 5717 5717 5717 5717 5717
ROA
Pearson Correlation -.053** .016 .126** -.142** -.114** -.052** -.039** -.101** .555** 1
Sig. (2-tailed) .000 .219 .000 .000 .000 .000 .003 .000 .000
N 5717 5717 5717 5717 5717 5717 5717 5717 5717 5717
**. Correlation is significant at the 0.01 level (2-tailed).
⊘ This is a preview!⊘
Do you want full access?
Subscribe today to unlock all pages.
Trusted by 1+ million students worldwide
1 out of 19
Related Documents


Your All-in-One AI-Powered Toolkit for Academic Success.
+13062052269
info@desklib.com
Available 24*7 on WhatsApp / Email
![[object Object]](/_next/static/media/star-bottom.7253800d.svg)
Unlock your academic potential
Copyright © 2020–2026 A2Z Services. All Rights Reserved. Developed and managed by ZUCOL.