An Empirical Analysis of Output Determinants in the French Economy
VerifiedAdded on 2022/01/18
|11
|3917
|101
Report
AI Summary
This report presents an analysis of the determinants of output in France, utilizing panel data from 1970 to 2016 to examine the influence of net export, consumption, investment, and government spending on GDP. The study employs a log-log model for empirical estimation and interprets the coefficients to assess the elasticity of GDP with respect to each independent variable. The report further delves into fiscal policy, discussing its role in macroeconomic stability and its impact on aggregate demand, with a focus on expansionary and contractionary fiscal policies. It also explores secondary determinants like population growth, aging population, and information technology, analyzing their effects on the French economy. The analysis includes references to various economic theories and empirical research, providing a comprehensive overview of the factors shaping France's economic output and offers recommendations on macroeconomic stability.
The analysis in this paper enumerates the determinants of output. The paper organized as follows.
Section I provides general information about the factors that impact on level of output. Section II
describes the data we employed and presents the effect of major determinant of GDP in a given
country. Section III provides some theoretical information about Fiscal policy and impacts of
policy to the France. Section IV provides brief information about secondary determinants of
output. Section V concludes and gives some recommendations in macroeconomic stability of
Uzbekistan. Appendices provide graphs and tables.
Introduction
Section I Brief literature review on the determinants of output
The research papers show that there were done many empirical investigations to test the impact of
consumption, investment, government expenditure, net export to the level of output. This
approach was also proved by classical and Keynesian economists. The classical economic theory
is directed in the concept of leissez-faire economic market, where leissez-faire can be defined as
in the free market there is little or no intervention from the side of government. According to them
the economic resources are allocated based on the desires of individuals and businesses.
Moreover, from the perspective of classical economists, national economic growth is not
influenced by government expenditure to much in comparison with the consumer spending and
business investments (Investopedia, 2018). However, Keynesian economists theories relies on
spending and aggregate demand in the economic marketplace. From Keynesian views
government expenditure plays the major role in the national economic growth and in absence of
consumption and investment, government spending can improve growth of economy
(Investopedia, 2018). There were many researchers who has done empirical research on economic
output determinants. According to their research, there are secondary determinants like FDI,
technological progress population growth that affect on the economic growth of a county. For
example neoclassical economist Solow (1956, p4) notes that the important determinant of short
run economic growth is saving, investment ratio. He also states that technological development
plays vital role in the growth of economy in the long run and seen as exogenous factor of
economic system (cited in Whelan,2005). The simplicity and good fit of data were the main factor
of the model and placed it at the core of most empirical research. Furthermore, Romer(1989) notes
that innovation and knowledge investment in human capital are significant contributors to the
economic growth. Human capital is the main source of growth in several models because the
majority of studies indicates that “human capital” includes itself proxies related to education
(p22). Therefore, educated population is the key determinants of productivity and economic
growth. This extension is in line with Zhang (1999), who established that newly industrialized
countries had been developing due to high investment rates, increasing labor force participation
rates and improvement in education. Yet some other papers shows a considerable impact of
country-specific factors such as the skills and knowledge of population, infrastructure,
impediments to trade and the effectiveness of government policies on GDP per capita (Plossner,
Levine and Renelt,1992, cited in Dritsakis, Varelas and Adamopoulos, 2008,p3). Real-world data
analyzed technological progress and productivity as the major determinants of per capita income
(Mankiw, Romer and Weil, 1992).
1
Paraphrase This Document
Need a fresh take? Get an instant paraphrase of this document with our AI Paraphraser
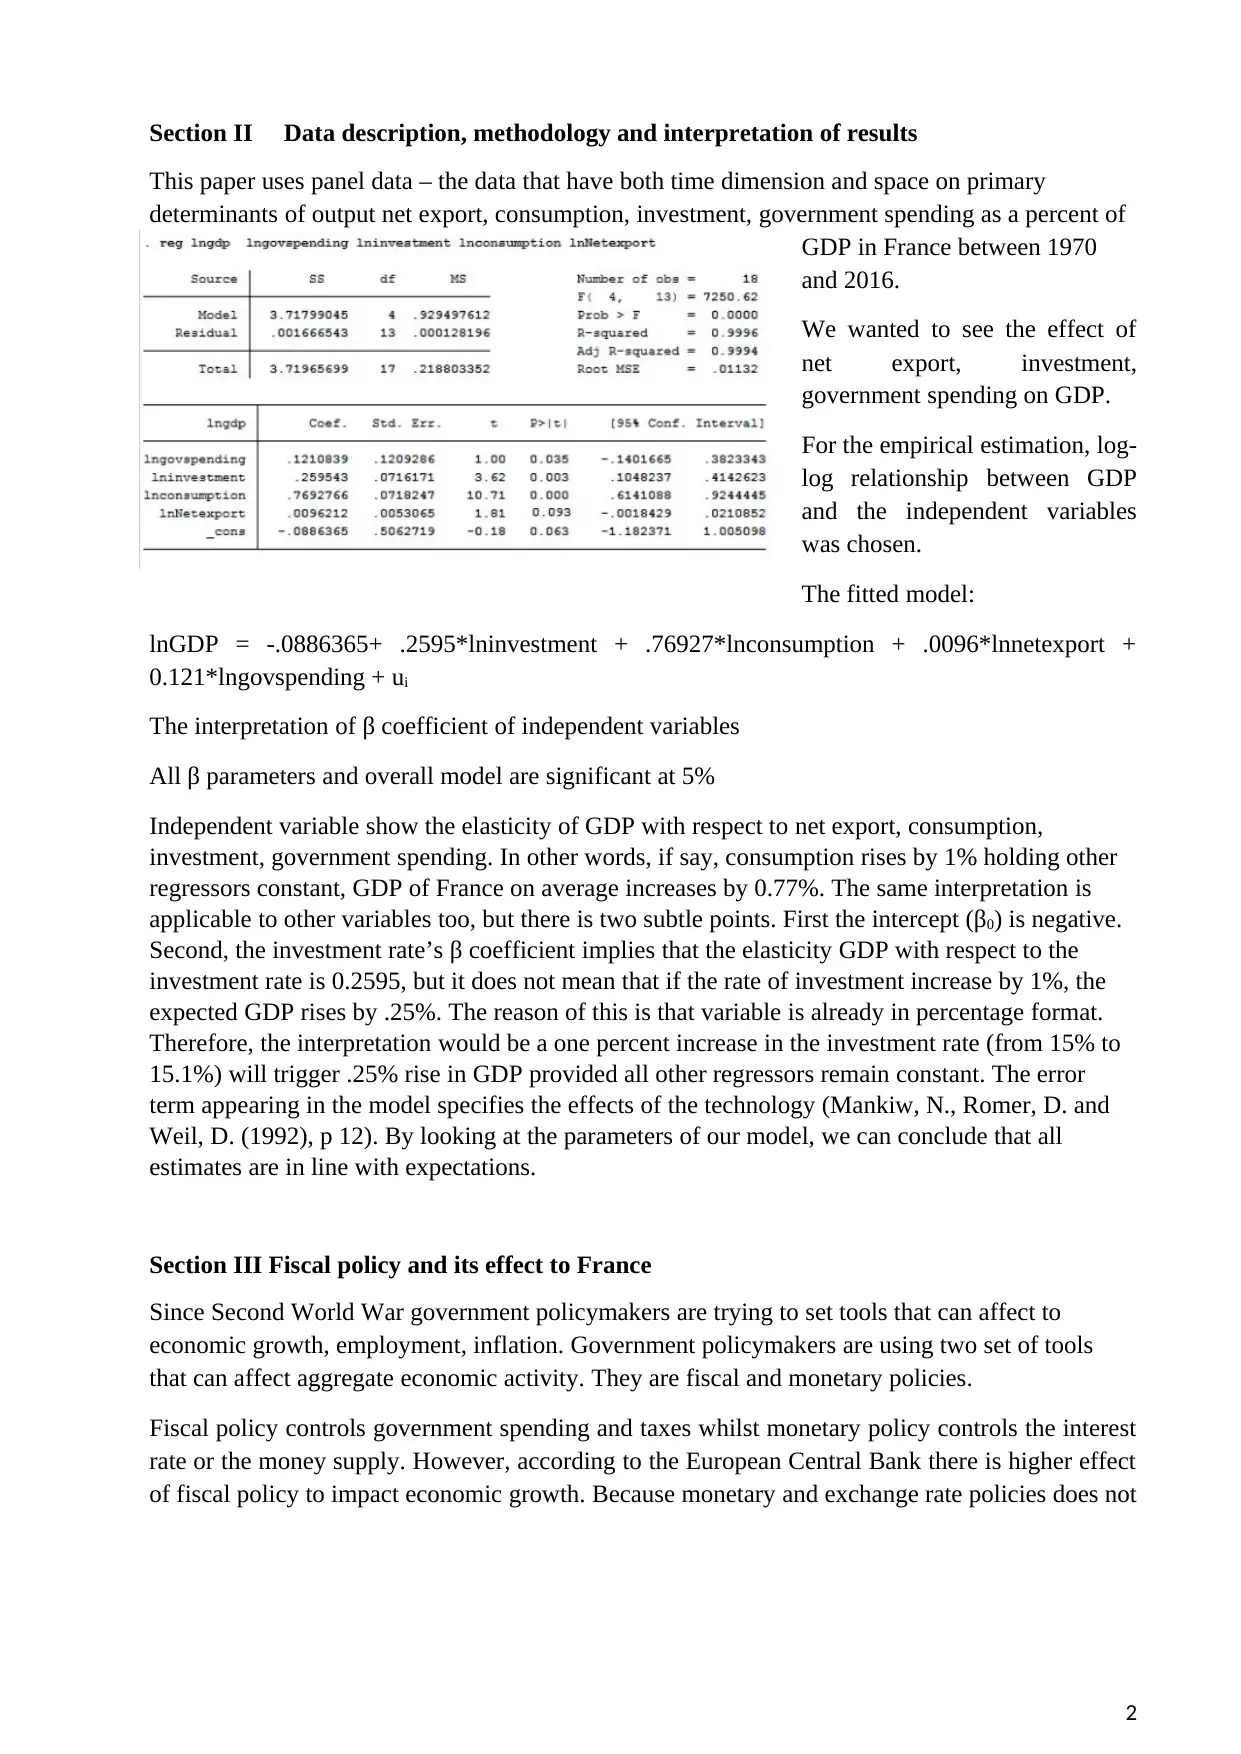
Section II Data description, methodology and interpretation of results
This paper uses panel data – the data that have both time dimension and space on primary
determinants of output net export, consumption, investment, government spending as a percent of
GDP in France between 1970
and 2016.
We wanted to see the effect of
net export, investment,
government spending on GDP.
For the empirical estimation, log-
log relationship between GDP
and the independent variables
was chosen.
The fitted model:
lnGDP = -.0886365+ .2595*lninvestment + .76927*lnconsumption + .0096*lnnetexport +
0.121*lngovspending + ui
The interpretation of β coefficient of independent variables
All β parameters and overall model are significant at 5%
Independent variable show the elasticity of GDP with respect to net export, consumption,
investment, government spending. In other words, if say, consumption rises by 1% holding other
regressors constant, GDP of France on average increases by 0.77%. The same interpretation is
applicable to other variables too, but there is two subtle points. First the intercept (β0) is negative.
Second, the investment rate’s β coefficient implies that the elasticity GDP with respect to the
investment rate is 0.2595, but it does not mean that if the rate of investment increase by 1%, the
expected GDP rises by .25%. The reason of this is that variable is already in percentage format.
Therefore, the interpretation would be a one percent increase in the investment rate (from 15% to
15.1%) will trigger .25% rise in GDP provided all other regressors remain constant. The error
term appearing in the model specifies the effects of the technology (Mankiw, N., Romer, D. and
Weil, D. (1992), p 12). By looking at the parameters of our model, we can conclude that all
estimates are in line with expectations.
Section III Fiscal policy and its effect to France
Since Second World War government policymakers are trying to set tools that can affect to
economic growth, employment, inflation. Government policymakers are using two set of tools
that can affect aggregate economic activity. They are fiscal and monetary policies.
Fiscal policy controls government spending and taxes whilst monetary policy controls the interest
rate or the money supply. However, according to the European Central Bank there is higher effect
of fiscal policy to impact economic growth. Because monetary and exchange rate policies does not
2
truly response to the country specific shocks in comparison with fiscal policy (Bank, 2018).
Therefore, fiscal policy is pivotal element of macroeconomic stability and has been seen as a
primary factor that affects the main determinants like consumption, investment and government
expenditure. The fiscal policy helps to manipulate the aggregate demand by changing the
government expenditure and taxes (Ecb.europa.eu, 2018). Government spending affects directly
on the output, whilst changes in taxes effect on consumption expenditure and then influence on
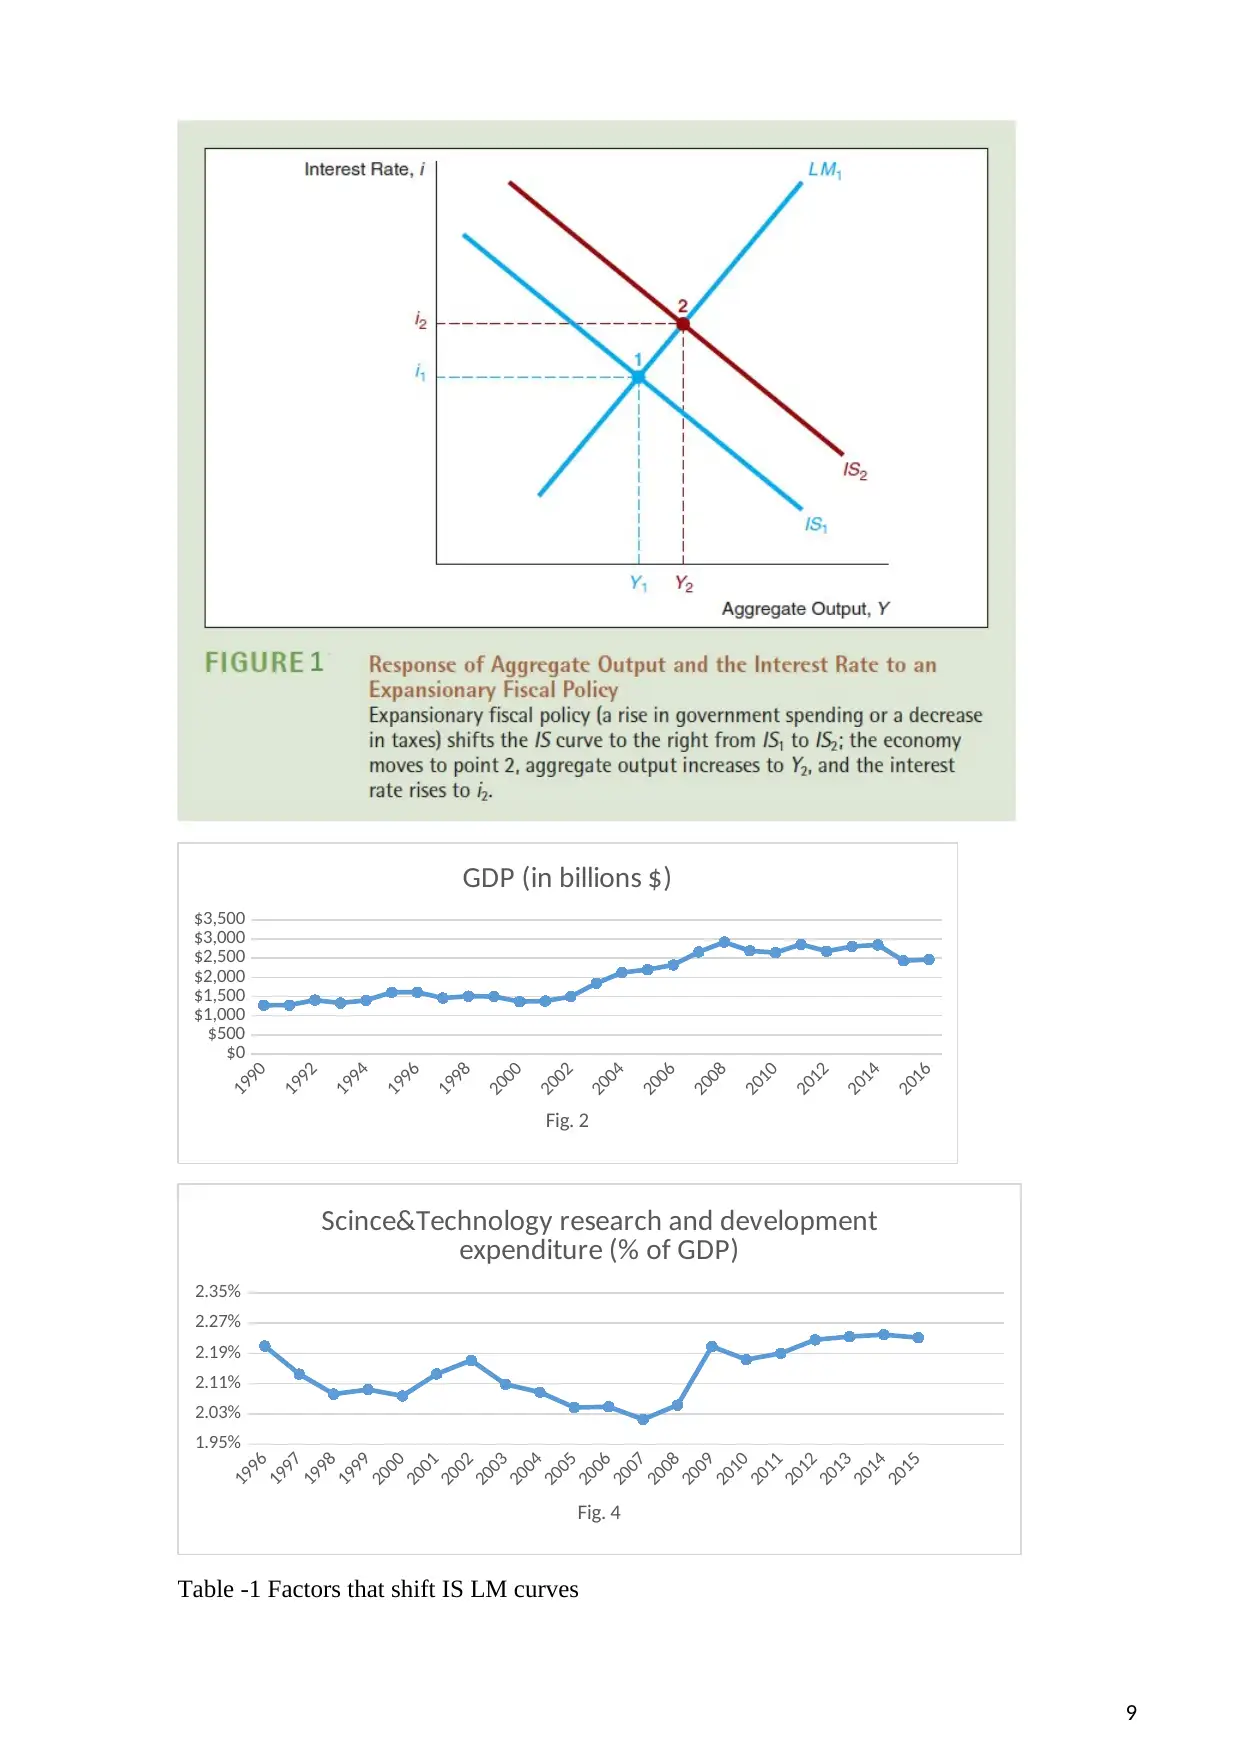
the economic growth. Fiscal policy is categorized into two: expansionary and contractionary.
Expansionary fiscal policy tend to increase aggregate demand by increasing government spending
or decreasing taxes. However, contractionary fiscal policy cause aggregate demand to fall by
decreasing government expenditure and increasing taxes (Investopedia, 2018). This policy can be
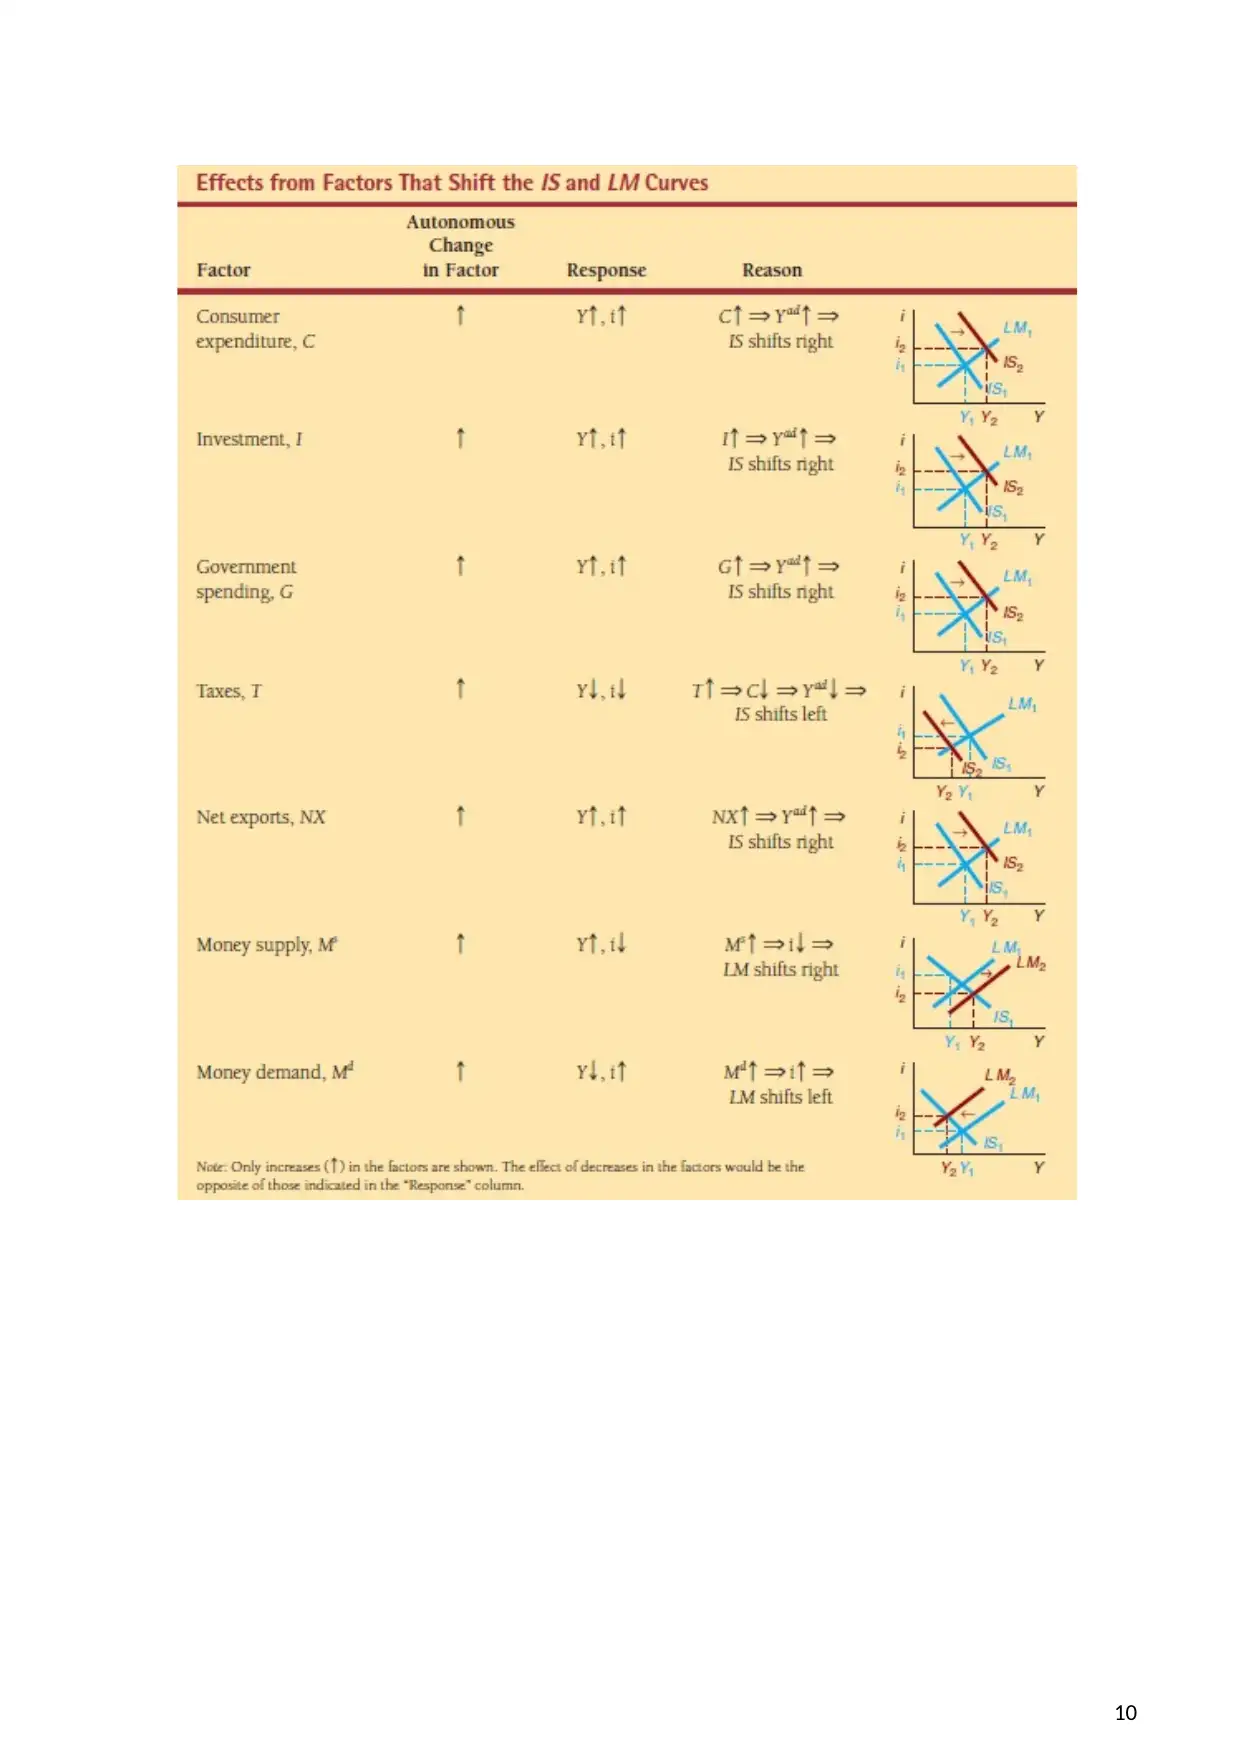
explained by IS-LM model. Research shows that in the IS-LM curve aggregate output and interest
rate are negatively related to taxes and positively related to government spending (see figure1).
According to the paper Macroeconomic effects from government purchases and taxes, changes in
taxes has smaller effect on the aggregate demand than equivalent change in government spending
(Barro and Redlick, 2018,p4). Additionally, the graphs that represent shifts of IS-LM curve can be
found in summary table 1. Observations shows that France enters to G7 countries and has higher
GDP. According to the World Bank 2017 report, France GDP constituted 2.465454 mln $US in
2016, which ranked the country in the 6th place in the world (World Bank, 2018). The research
shows that France tried to manipulate output by using fiscal policies and started expansionary
fiscal policy in 2002. According to the research of Flynn (2009), France has experienced high
budget deficit. According to the statistics provided by OECD, government deficit constituted
7.2% of GDP. France could lower this deficit ratio to 3.4% of GDP in 2016 (OECD, 2018). In
2005, French budget started to cut taxes and increased its spending. According to the statistical
research of Flynn(2009) tax cuts of civil sectors, public job sectors, households lead to decrease
budget deficit and increase economic growth rate by 2.5% (p17).These tax cuts attracted inward
and outflow investment. Direct inflow investment rose from 16.4 to 45.3 Bln $US from 1993 to
2003. Likewise, in these decade outflow investment rise from 19.7 to 55.2 Bln $US. Observations
of Flynn(2009) shows that France increased its total tax revenue gradually from 1975 to 2003. In
1975 tax revenue represented 35.9% of GDP, whilst in 2003 it amounted 44.2% of France GDP
(p22).
Section IV Secondary determinants of output
Nowadays, besides primary determinants, some secondary figures also stay at the core of
country’s Gross Domestic Product (GDP). Increase or decrease in these factors can stimulate GDP
or, on the contrary, lead to growth retardation; therefore, it is necessary to measure their
significance each. Within the national economy, these determinants are interconnected links of
chain. All statistical analysis is based on different literature articles and aimed to reckon up how it
does work in the context of France.
One of the secondary determinants is a population growth. Becker,
Glaeser and K. Murphy conducted an empirical analysis comparing countries and concluded that
there is a relation between economic growth, investments in human capital and the level
of economic development. They began analysis from the consideration of
Thomas Malthus theory. According to his model, higher population reduces incomes per
capita through diminishing marginal productivity. However, modern estimations show that
increase in average income per capita caused most likely by accumulation of human capital and
new technology development. Authors argue that poorer economies of agrarian type with a limited
human capital, the simplest technologies and a big population usually experience the downward
tendency of average earnings per capita according to Malthus and neoclassical assumption of
3
Therefore, fiscal policy is pivotal element of macroeconomic stability and has been seen as a
primary factor that affects the main determinants like consumption, investment and government
expenditure. The fiscal policy helps to manipulate the aggregate demand by changing the
government expenditure and taxes (Ecb.europa.eu, 2018). Government spending affects directly
on the output, whilst changes in taxes effect on consumption expenditure and then influence on
the economic growth. Fiscal policy is categorized into two: expansionary and contractionary.
Expansionary fiscal policy tend to increase aggregate demand by increasing government spending
or decreasing taxes. However, contractionary fiscal policy cause aggregate demand to fall by
decreasing government expenditure and increasing taxes (Investopedia, 2018). This policy can be
explained by IS-LM model. Research shows that in the IS-LM curve aggregate output and interest
rate are negatively related to taxes and positively related to government spending (see figure1).
According to the paper Macroeconomic effects from government purchases and taxes, changes in
taxes has smaller effect on the aggregate demand than equivalent change in government spending
(Barro and Redlick, 2018,p4). Additionally, the graphs that represent shifts of IS-LM curve can be
found in summary table 1. Observations shows that France enters to G7 countries and has higher
GDP. According to the World Bank 2017 report, France GDP constituted 2.465454 mln $US in
2016, which ranked the country in the 6th place in the world (World Bank, 2018). The research
shows that France tried to manipulate output by using fiscal policies and started expansionary
fiscal policy in 2002. According to the research of Flynn (2009), France has experienced high
budget deficit. According to the statistics provided by OECD, government deficit constituted
7.2% of GDP. France could lower this deficit ratio to 3.4% of GDP in 2016 (OECD, 2018). In
2005, French budget started to cut taxes and increased its spending. According to the statistical
research of Flynn(2009) tax cuts of civil sectors, public job sectors, households lead to decrease
budget deficit and increase economic growth rate by 2.5% (p17).These tax cuts attracted inward
and outflow investment. Direct inflow investment rose from 16.4 to 45.3 Bln $US from 1993 to
2003. Likewise, in these decade outflow investment rise from 19.7 to 55.2 Bln $US. Observations
of Flynn(2009) shows that France increased its total tax revenue gradually from 1975 to 2003. In
1975 tax revenue represented 35.9% of GDP, whilst in 2003 it amounted 44.2% of France GDP
(p22).
Section IV Secondary determinants of output
Nowadays, besides primary determinants, some secondary figures also stay at the core of
country’s Gross Domestic Product (GDP). Increase or decrease in these factors can stimulate GDP
or, on the contrary, lead to growth retardation; therefore, it is necessary to measure their
significance each. Within the national economy, these determinants are interconnected links of
chain. All statistical analysis is based on different literature articles and aimed to reckon up how it
does work in the context of France.
One of the secondary determinants is a population growth. Becker,
Glaeser and K. Murphy conducted an empirical analysis comparing countries and concluded that
there is a relation between economic growth, investments in human capital and the level
of economic development. They began analysis from the consideration of
Thomas Malthus theory. According to his model, higher population reduces incomes per
capita through diminishing marginal productivity. However, modern estimations show that
increase in average income per capita caused most likely by accumulation of human capital and
new technology development. Authors argue that poorer economies of agrarian type with a limited
human capital, the simplest technologies and a big population usually experience the downward
tendency of average earnings per capita according to Malthus and neoclassical assumption of
3
⊘ This is a preview!⊘
Do you want full access?
Subscribe today to unlock all pages.
Trusted by 1+ million students worldwide
diminishing marginal productivity with growth of labor supply. In more developed countries, the
Malthusian effects are slight. Moreover, in such economies, the higher population density and
strong urbanization promote job specialization, human capital investments and fast accumulation
of new knowledge, and economic growth. When economy starts booming, people invest in human
capital. The cities are becoming more preferable for population to live. Concentration of people in
the cities is one the most important factors of economic growth as the dense population leads to
market expansion and, as a result, to growth in income per capita. Authors particularly emphasize
that the rate of technology development practically does not depend
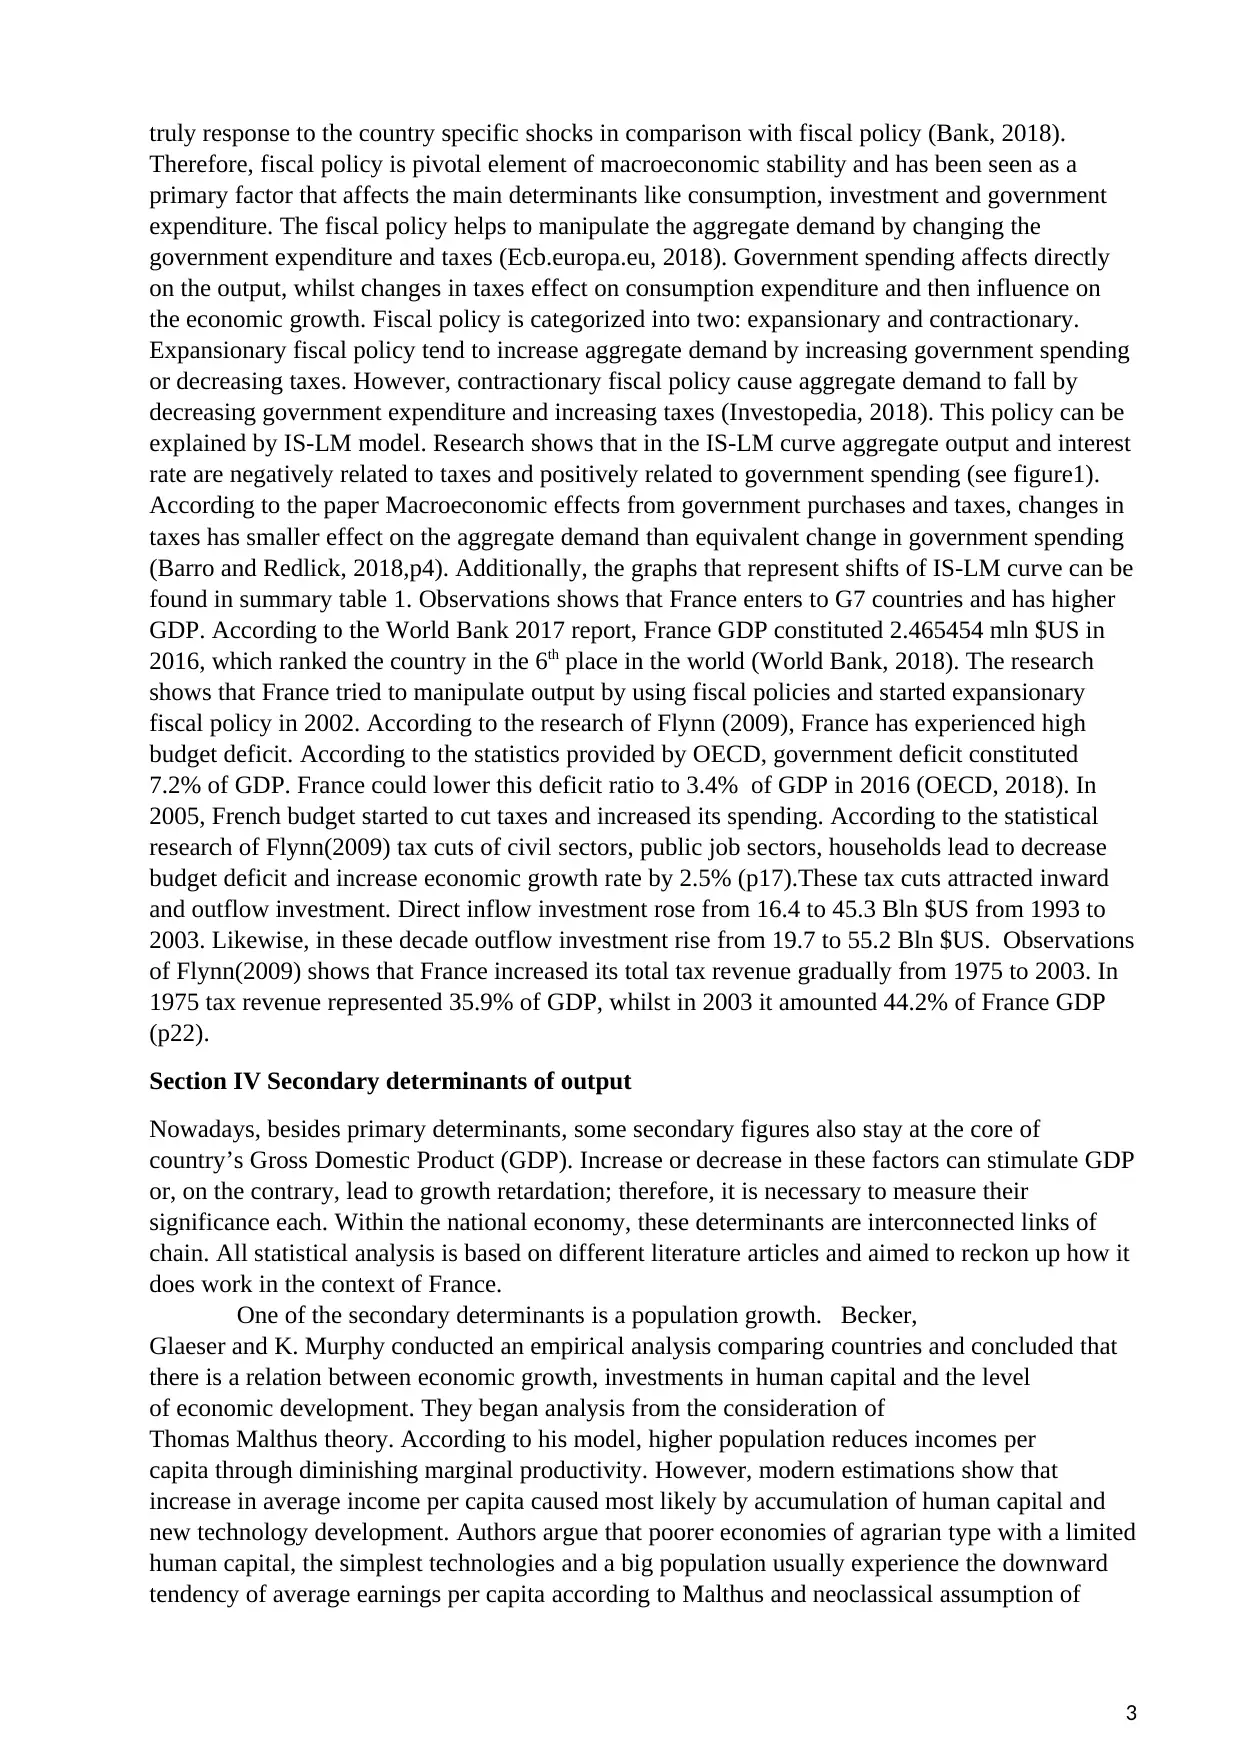
on population growth rate (Becker, Glaeser, Murphy, 1999). Applying this to France, gradual
increase in GDP and population with some insignificant fluctuations is observed from 1990 till
2008 (Fig.2, Fig.6). Taking into account the diversified economy with well-developed agriculture
and industry sectors, it is reasonable to assume that population rise together with
other determinants had a positive impact on French GDP. However, from 2009 French economy
has been experiencing long fluctuations caused by the world economic crisis of 2008. In addition,
a big tide of immigrants and refugees coming from North Africa and the Middle East led to the
population explosion, aggravated a situation in the country and brought French economy into
recession.
Not primary, but worth to consider determinant is the ageing of the population. Before starting the
discussion about ageing of the population effects on GDP, this term must be explained briefly.
Ageing of the population stems from the declining fertility rate and excessive life expectancy.
Ageing of the population is the positive indicator of welfare, living standards and health care, but
at the same time, it is considered an economic problem for countries, since people who are getting
old generally lose labor productivity. Ageing of the population is the cause of an increase in the
number of people who are above the retirement age and an increase in the number of pensioners,
which leads to more government spending on pensions, health care and benefits, related to old
age. In the case of France, retirement age is 60 and 25.3 % or 16.9 million of France’s population
is over 60. France is considered to be one of the countries which spends more than 10% of GDP
on pensions and it is almost 14%.
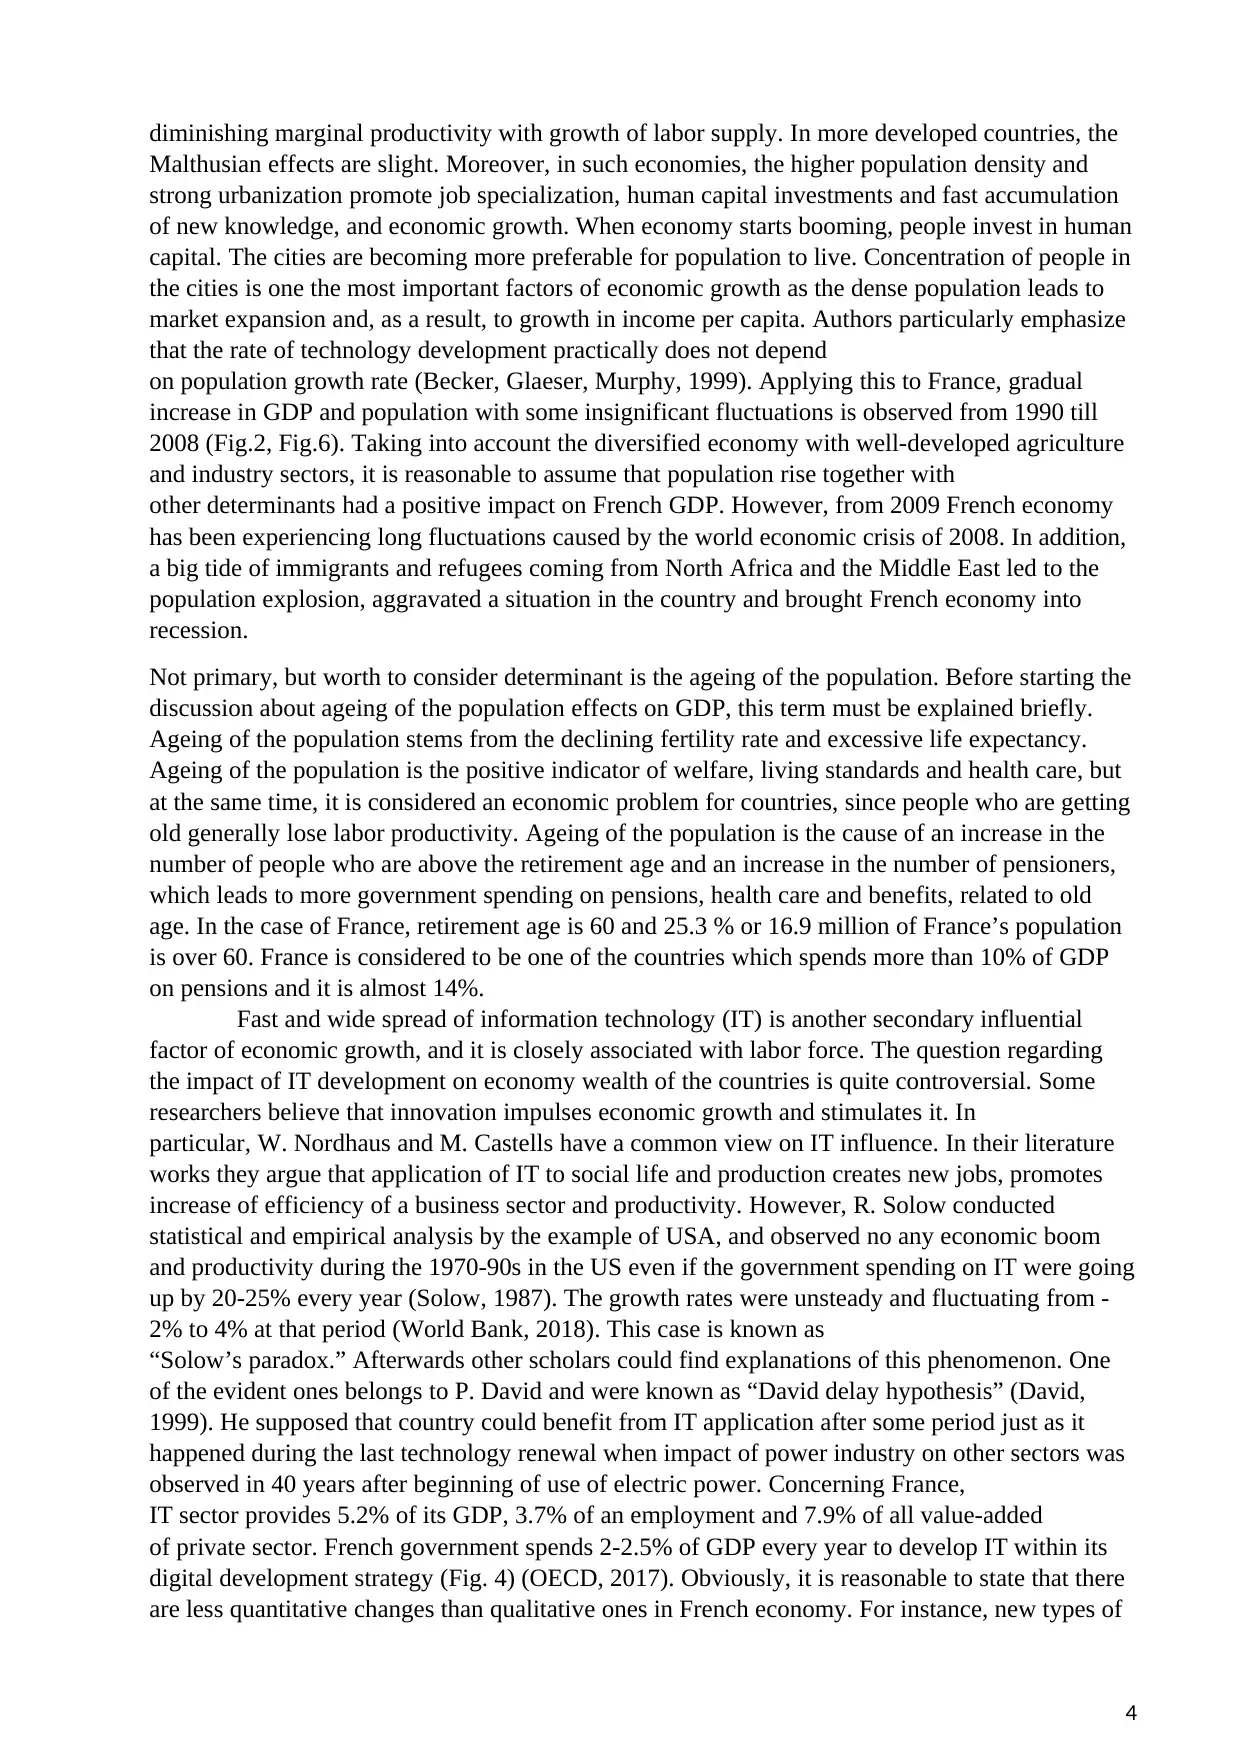
Fast and wide spread of information technology (IT) is another secondary influential
factor of economic growth, and it is closely associated with labor force. The question regarding
the impact of IT development on economy wealth of the countries is quite controversial. Some
researchers believe that innovation impulses economic growth and stimulates it. In
particular, W. Nordhaus and M. Castells have a common view on IT influence. In their literature
works they argue that application of IT to social life and production creates new jobs, promotes
increase of efficiency of a business sector and productivity. However, R. Solow conducted
statistical and empirical analysis by the example of USA, and observed no any economic boom
and productivity during the 1970-90s in the US even if the government spending on IT were going
up by 20-25% every year (Solow, 1987). The growth rates were unsteady and fluctuating from -
2% to 4% at that period (World Bank, 2018). This case is known as
“Solow’s paradox.” Afterwards other scholars could find explanations of this phenomenon. One
of the evident ones belongs to P. David and were known as “David delay hypothesis” (David,
1999). He supposed that country could benefit from IT application after some period just as it
happened during the last technology renewal when impact of power industry on other sectors was
observed in 40 years after beginning of use of electric power. Concerning France,
IT sector provides 5.2% of its GDP, 3.7% of an employment and 7.9% of all value-added
of private sector. French government spends 2-2.5% of GDP every year to develop IT within its
digital development strategy (Fig. 4) (OECD, 2017). Obviously, it is reasonable to state that there
are less quantitative changes than qualitative ones in French economy. For instance, new types of
4
Malthusian effects are slight. Moreover, in such economies, the higher population density and
strong urbanization promote job specialization, human capital investments and fast accumulation
of new knowledge, and economic growth. When economy starts booming, people invest in human
capital. The cities are becoming more preferable for population to live. Concentration of people in
the cities is one the most important factors of economic growth as the dense population leads to
market expansion and, as a result, to growth in income per capita. Authors particularly emphasize
that the rate of technology development practically does not depend
on population growth rate (Becker, Glaeser, Murphy, 1999). Applying this to France, gradual
increase in GDP and population with some insignificant fluctuations is observed from 1990 till
2008 (Fig.2, Fig.6). Taking into account the diversified economy with well-developed agriculture
and industry sectors, it is reasonable to assume that population rise together with
other determinants had a positive impact on French GDP. However, from 2009 French economy
has been experiencing long fluctuations caused by the world economic crisis of 2008. In addition,
a big tide of immigrants and refugees coming from North Africa and the Middle East led to the
population explosion, aggravated a situation in the country and brought French economy into
recession.
Not primary, but worth to consider determinant is the ageing of the population. Before starting the
discussion about ageing of the population effects on GDP, this term must be explained briefly.
Ageing of the population stems from the declining fertility rate and excessive life expectancy.
Ageing of the population is the positive indicator of welfare, living standards and health care, but
at the same time, it is considered an economic problem for countries, since people who are getting
old generally lose labor productivity. Ageing of the population is the cause of an increase in the
number of people who are above the retirement age and an increase in the number of pensioners,
which leads to more government spending on pensions, health care and benefits, related to old
age. In the case of France, retirement age is 60 and 25.3 % or 16.9 million of France’s population
is over 60. France is considered to be one of the countries which spends more than 10% of GDP
on pensions and it is almost 14%.
Fast and wide spread of information technology (IT) is another secondary influential
factor of economic growth, and it is closely associated with labor force. The question regarding
the impact of IT development on economy wealth of the countries is quite controversial. Some
researchers believe that innovation impulses economic growth and stimulates it. In
particular, W. Nordhaus and M. Castells have a common view on IT influence. In their literature
works they argue that application of IT to social life and production creates new jobs, promotes
increase of efficiency of a business sector and productivity. However, R. Solow conducted
statistical and empirical analysis by the example of USA, and observed no any economic boom
and productivity during the 1970-90s in the US even if the government spending on IT were going
up by 20-25% every year (Solow, 1987). The growth rates were unsteady and fluctuating from -
2% to 4% at that period (World Bank, 2018). This case is known as
“Solow’s paradox.” Afterwards other scholars could find explanations of this phenomenon. One
of the evident ones belongs to P. David and were known as “David delay hypothesis” (David,
1999). He supposed that country could benefit from IT application after some period just as it
happened during the last technology renewal when impact of power industry on other sectors was
observed in 40 years after beginning of use of electric power. Concerning France,
IT sector provides 5.2% of its GDP, 3.7% of an employment and 7.9% of all value-added
of private sector. French government spends 2-2.5% of GDP every year to develop IT within its
digital development strategy (Fig. 4) (OECD, 2017). Obviously, it is reasonable to state that there
are less quantitative changes than qualitative ones in French economy. For instance, new types of
4
Paraphrase This Document
Need a fresh take? Get an instant paraphrase of this document with our AI Paraphraser
employment and education appear (distance education and jobs), opportunity to expand trade
of goods and services and to enter the foreign markets by means of opening online shops is getting
real. These qualitative changes are, thus, evidence of progressive development of national
households that confirms a thesis about the influence of IT spread on economy.
In the modern world, foreign direct investments (FDI) are developing faster and getting
one of the main secondary economic determinants. M. Porter presented the results of his large-
scale research conducted in ten leading industrialized countries (Porter, 1990). In his analysis,
known as “The Competitive Advantage of Nations”, he tried to understand why investments of
multinational companies in several countries essentially increase technology efficiency of local
firms and why in other cases it does not work. Porter also illustrated dynamic interaction between
the strategy of the Multinational Corporation and competitive advantages of the recipient
countries. For example, he stated that FDI donor countries should base on the analytical data of
sectorial clusters, i.e. the list of the interconnected productions of the countries getting foreign
capital. Moreover, for recipient countries the strategy of investment raising can become successful
if their governments make efforts to develop the interconnected industrial productions. They also
should create a propitious investment atmosphere to maximize the national benefits
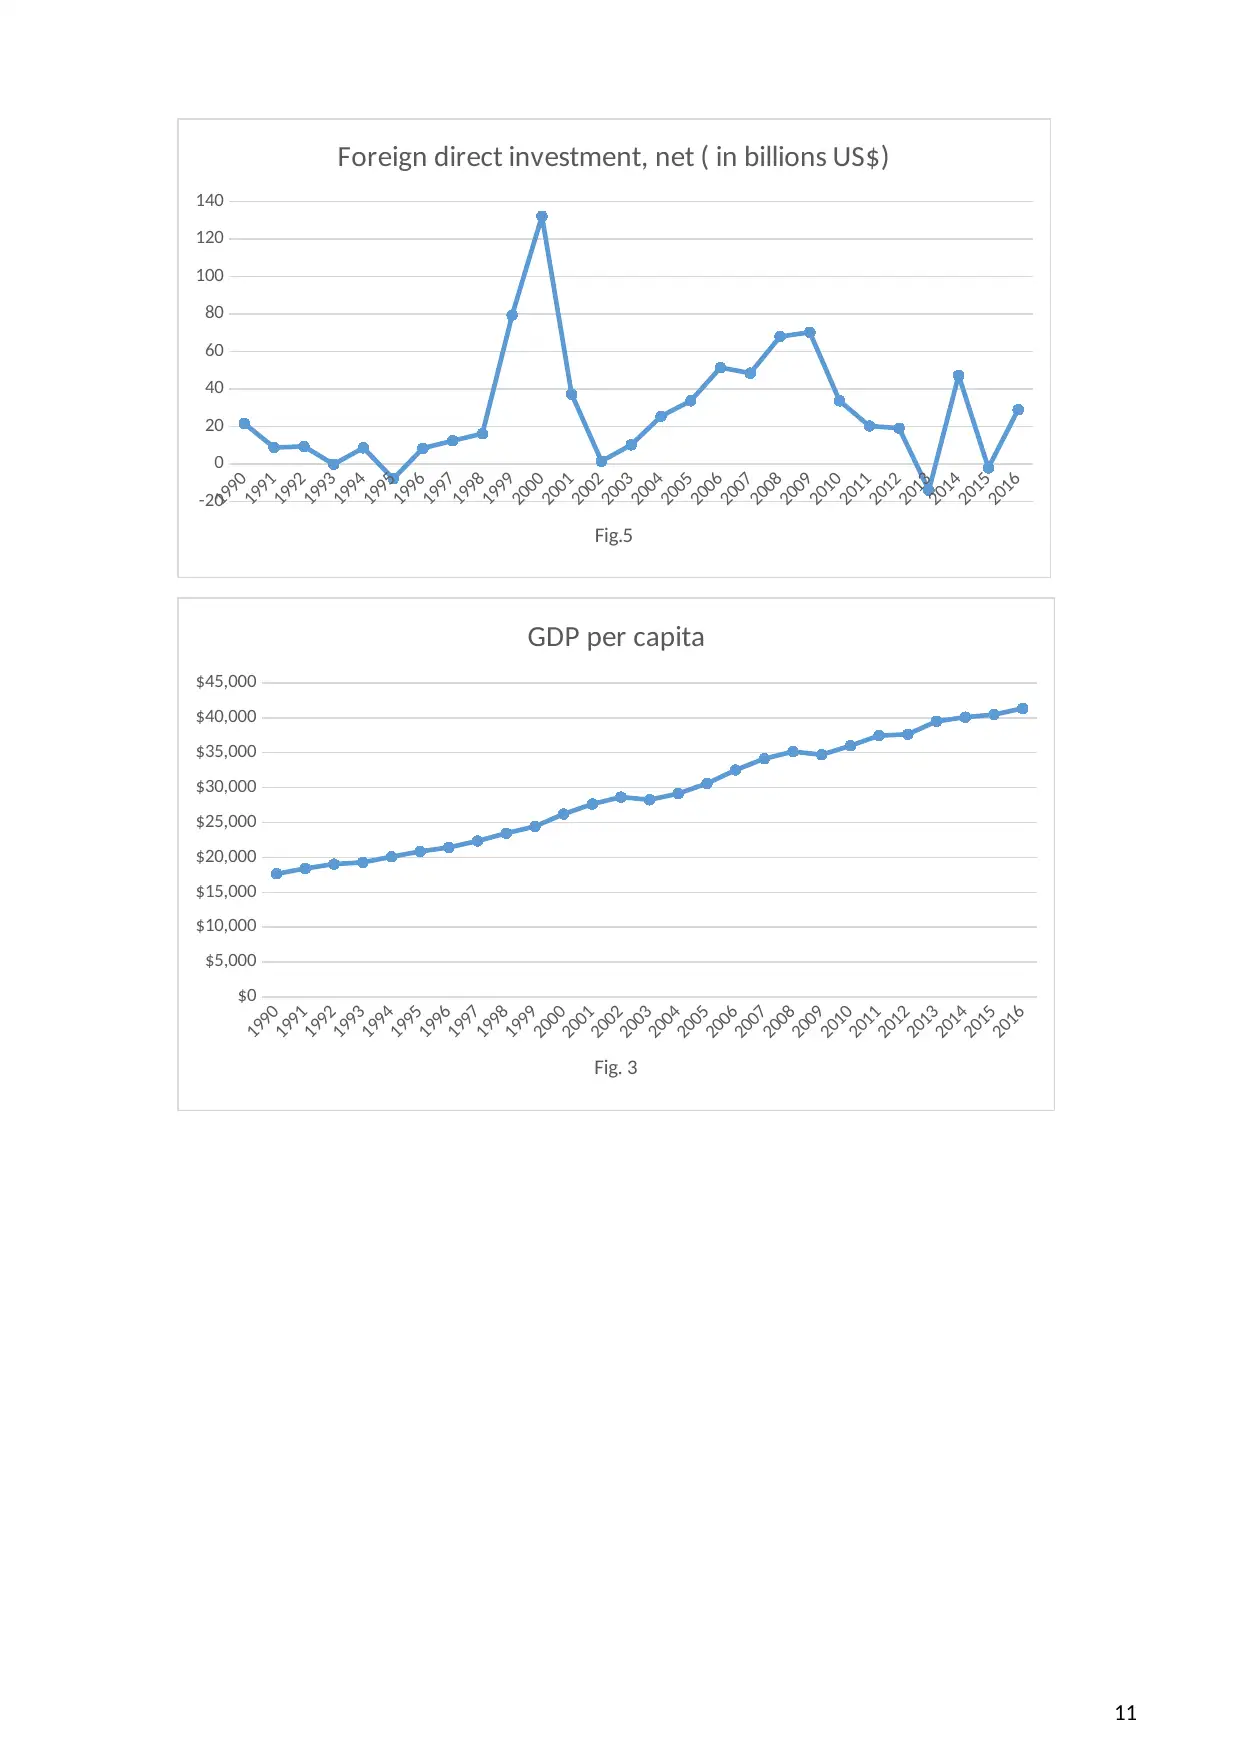
of FDI raising. Taking into consideration France, one could assume that it generally
demonstrates a tendency appeal growth for investors for the last 25 years (Fig.5) (World Bank,
2018). Particularly, according INSEE, France realized and received about 1,000 investments from
more than 50 countries in 2015. Primarily, foreign companies invest in industry (30% of all
investments realized in France), in technology and science development (9% of all
investments). FDI provides 19% of turnover of French economy (INSEE, 2017). Hence, it is self-
evident that a role of FDI in French economy is one of the leadings and has salutary effect in
practice.
Conclusion and recommendation
To conclude it was analysed by our group that economic growth influenced by primary and
secondary determinants. As it is observed that primary determinants are consumption, investment,
government expenditure and net export. The level of output also influenced by FDI, population
growth and technological advancement. Moreover, we learnt how policies can affect the aggregate
demand and factors that shifts IS-LM curve.
In most advanced countries, monetary policy is one major policy instruments, which is used to
stimulate the economy when it is in recession and to regulate the general price level in the
economy. Monetary policy is carried out through open market operation in which government
bonds are bought or sold to the public depending on the type of the monetary policy. The ultimate
aim of this policy is to achieve a target interest rate, not to control the amount of the money in the
economy. Unfortunately, in Uzbekistan monetary policy is not carried out in this way since
Uzbekistan does not issue government bonds, meaning that the government does not have full
control over the interest rate. During the last year government of Uzbekistan enhanced open
market operations by some economic action such as liberalization of monetary market, decreasing
import tariffs etc. The government of Uzbekistan should generate system of selling and buying
government bonds rather than just printing money in order to control money supply in the
economy. However, further developments on monetary policy is needed. Moreover, Uzbekistan is
the observer in World Trade Organization (WTO) and planning to join as a resident country to the
organization. Being resident of the organization makes positive effects on the economy of
5
of goods and services and to enter the foreign markets by means of opening online shops is getting
real. These qualitative changes are, thus, evidence of progressive development of national
households that confirms a thesis about the influence of IT spread on economy.
In the modern world, foreign direct investments (FDI) are developing faster and getting
one of the main secondary economic determinants. M. Porter presented the results of his large-
scale research conducted in ten leading industrialized countries (Porter, 1990). In his analysis,
known as “The Competitive Advantage of Nations”, he tried to understand why investments of
multinational companies in several countries essentially increase technology efficiency of local
firms and why in other cases it does not work. Porter also illustrated dynamic interaction between
the strategy of the Multinational Corporation and competitive advantages of the recipient
countries. For example, he stated that FDI donor countries should base on the analytical data of
sectorial clusters, i.e. the list of the interconnected productions of the countries getting foreign
capital. Moreover, for recipient countries the strategy of investment raising can become successful
if their governments make efforts to develop the interconnected industrial productions. They also
should create a propitious investment atmosphere to maximize the national benefits
of FDI raising. Taking into consideration France, one could assume that it generally
demonstrates a tendency appeal growth for investors for the last 25 years (Fig.5) (World Bank,
2018). Particularly, according INSEE, France realized and received about 1,000 investments from
more than 50 countries in 2015. Primarily, foreign companies invest in industry (30% of all
investments realized in France), in technology and science development (9% of all
investments). FDI provides 19% of turnover of French economy (INSEE, 2017). Hence, it is self-
evident that a role of FDI in French economy is one of the leadings and has salutary effect in
practice.
Conclusion and recommendation
To conclude it was analysed by our group that economic growth influenced by primary and
secondary determinants. As it is observed that primary determinants are consumption, investment,
government expenditure and net export. The level of output also influenced by FDI, population
growth and technological advancement. Moreover, we learnt how policies can affect the aggregate
demand and factors that shifts IS-LM curve.
In most advanced countries, monetary policy is one major policy instruments, which is used to
stimulate the economy when it is in recession and to regulate the general price level in the
economy. Monetary policy is carried out through open market operation in which government
bonds are bought or sold to the public depending on the type of the monetary policy. The ultimate
aim of this policy is to achieve a target interest rate, not to control the amount of the money in the
economy. Unfortunately, in Uzbekistan monetary policy is not carried out in this way since
Uzbekistan does not issue government bonds, meaning that the government does not have full
control over the interest rate. During the last year government of Uzbekistan enhanced open
market operations by some economic action such as liberalization of monetary market, decreasing
import tariffs etc. The government of Uzbekistan should generate system of selling and buying
government bonds rather than just printing money in order to control money supply in the
economy. However, further developments on monetary policy is needed. Moreover, Uzbekistan is
the observer in World Trade Organization (WTO) and planning to join as a resident country to the
organization. Being resident of the organization makes positive effects on the economy of
5
Uzbekistan with attracting foreign investors, increasing living standards and decreasing level of
prices by high competition amongst producers. However, it is recommended that in order to be a
member of WTO, Uzbekistan must be ready for international competition. It is obvious that
Multinational corporations are ready to operate losses until they get full market, in this case, local
producers and firms cannot drive their businesses. Consequently, local businesses quits the market
and foreign companies cause monetary reserves to decline.
6
⊘ This is a preview!⊘
Do you want full access?
Subscribe today to unlock all pages.
Trusted by 1+ million students worldwide
Bibliography
Bank, E. (2018). Fiscal policies. [online] European Central Bank. Available at:
https://www.ecb.europa.eu/mopo/eaec/fiscal/html/index.en.html [Accessed 2 Mar. 2018].
Barro, R. and Redlick, C. (2018). Macroeconomic Effects from Government Purchases and
Taxes. [online] NBER. Available at: http://www.nber.org/papers/w15369 [Accessed 5 Mar.
2018].
Castells, M. and Himanen, P. (2006). The information society and the welfare state. Oxford [u.a.]:
Oxford Univ. Press.
Dritsakis, N., Varelas and Adamopoulos (2008). The Main Determinants of Economic
Growth : An Empirical Investigation with Granger Causality Analysis for Greece. [online]
Ideas.repec.org. Available at: https://ideas.repec.org/a/ers/journl/vixy2006i3-4p47-58.html
[Accessed 1 Mar. 2018].
Ecb.europa.eu. (2018). Cite a Website - Cite This For Me. [online] Available at:
https://www.ecb.europa.eu/pub/pdf/other/mb201403_focus06.en.pdf?
230b495b386ab0a767952be3cf09d909 [Accessed 3 Mar. 2018].
Ecb.europa.eu. (2018). Cite a Website - Cite This For Me. [online] Available at:
https://www.ecb.europa.eu/pub/pdf/scpops/ecbop176.en.pdf?
3039f4785c44fa610d3c30188b812153 [Accessed 2 Mar. 2018].
En.businessfrance.fr. (2018). Business France. [online] Available at: http://en.businessfrance.fr/
[Accessed 4 Mar. 2018].
Flynn, N. (2018). Fiscal policies, social spending and economic performance in France,
Germany and the UK since 1970 from In Search of Social Democracy: Responses to Crisis
and Modernisation on JSTOR. [online] Jstor.org. Available at:
http://www.jstor.org/stable/j.ctt1wn0s45.7 [Accessed 2 Mar. 2018].
Freeman, C. and Nordhaus, W. (1971). Invention, Growth, and Welfare: A Theoretical Treatment of
Technological Change. Technology and Culture, 12(2), p.375.
Hansen, G. and Prescott, E. (1999). Malthus to Solow. [Minneapolis, Minn.]: Federal Reserve Bank
of Minneapolis.
Investopedia. (2018). Economic Theories. [online] Available at:
https://www.investopedia.com/exam-guide/cfa-level-1/macroeconomics/economic-
theories.asp [Accessed 2 Mar. 2018].
Investopedia. (2018). Fiscal Policy. [online] Available at: https://www.investopedia.com/exam-
guide/finra-series-6/economic-factors/fiscal-policy.asp [Accessed 1 Mar. 2018].
Long, J. and Summers, L. (1991). Equipment Investment and Economic Growth. The
Quarterly Journal of Economics, 106(2), p.445.
Mankiw, N., Romer, D. and Weil, D. (1992). A Contribution to the Empirics of Economic
Growth.
7
Paraphrase This Document
Need a fresh take? Get an instant paraphrase of this document with our AI Paraphraser
Nordhaus, W. (2002). Productivity Growth and the New Economy. Brookings Papers on Economic
Activity, 2002(2), pp.211-265.
Porter, M. (1990). Competitive Advantage of Nations. Competitive Intelligence Review, 1(1), pp.14-
14.
Romer, P. (1989). Human Capital and Growth: Theory and Evidence. [online] Pdf.usaid.gov.
Available at: http://pdf.usaid.gov/pdf_docs/PNABD361.pdf [Accessed 2 Mar. 2018].
Whelan, K. (2005). Human capital and technological development. [online] Tcd.ie. Available
at: https://www.tcd.ie/Economics/staff/whelanka/topic1.pdf [Accessed 2 Mar. 2018].
Appendices
8
1990
1992
1994
1996
1998
2000
2002
2004
2006
2008
2010
2012
2014
2016
$0
$500
$1,000
$1,500
$2,000
$2,500
$3,000
$3,500
GDP (in billions $)
Fig. 2
1996
1997
1998
1999
2000
2001
2002
2003
2004
2005
2006
2007
2008
2009
2010
2011
2012
2013
2014
2015
1.95%
2.03%
2.11%
2.19%
2.27%
2.35%
Scince&Technology research and development
expenditure (% of GDP)
Fig. 4
Table -1 Factors that shift IS LM curves
9
⊘ This is a preview!⊘
Do you want full access?
Subscribe today to unlock all pages.
Trusted by 1+ million students worldwide
10
Paraphrase This Document
Need a fresh take? Get an instant paraphrase of this document with our AI Paraphraser
1990
1991
1992
1993
1994
1995
1996
1997
1998
1999
2000
2001
2002
2003
2004
2005
2006
2007
2008
2009
2010
2011
2012
2013
2014
2015
2016
-20
0
20
40
60
80
100
120
140
Foreign direct investment, net ( in billions US$)
Fig.5
1990
1991
1992
1993
1994
1995
1996
1997
1998
1999
2000
2001
2002
2003
2004
2005
2006
2007
2008
2009
2010
2011
2012
2013
2014
2015
2016
$0
$5,000
$10,000
$15,000
$20,000
$25,000
$30,000
$35,000
$40,000
$45,000
GDP per capita
Fig. 3
11
1991
1992
1993
1994
1995
1996
1997
1998
1999
2000
2001
2002
2003
2004
2005
2006
2007
2008
2009
2010
2011
2012
2013
2014
2015
2016
-20
0
20
40
60
80
100
120
140
Foreign direct investment, net ( in billions US$)
Fig.5
1990
1991
1992
1993
1994
1995
1996
1997
1998
1999
2000
2001
2002
2003
2004
2005
2006
2007
2008
2009
2010
2011
2012
2013
2014
2015
2016
$0
$5,000
$10,000
$15,000
$20,000
$25,000
$30,000
$35,000
$40,000
$45,000
GDP per capita
Fig. 3
11
1 out of 11
Related Documents


Your All-in-One AI-Powered Toolkit for Academic Success.
+13062052269
info@desklib.com
Available 24*7 on WhatsApp / Email
![[object Object]](/_next/static/media/star-bottom.7253800d.svg)
Unlock your academic potential
Copyright © 2020–2026 A2Z Services. All Rights Reserved. Developed and managed by ZUCOL.