Physics Lab Report: Investigating the Resistivity of Different Wires
VerifiedAdded on 2022/10/19
|14
|1908
|126
Practical Assignment
AI Summary
This physics lab report details an experiment to determine the resistivity of nichrome and constantan wires. The aim was to investigate the relationship between a wire's resistance, its length, and its diameter. The experiment involved setting up a circuit, measuring the voltage and current across different lengths of the wires, and calculating the resistance. The data collected was then used to plot graphs of resistance against length, from which the resistivity of the wires was calculated using the gradient of the graphs. The report includes tables of the collected data, graphs of the results, and an analysis of the findings, comparing the experimental resistivity values with theoretical values. The discussion section addresses potential sources of error and suggests improvements for future experiments.
RESISTIVITY OF A WIRE 1
RESISTIVITY OF A WIRE
by Student’s Name
Code + Course Name
Professor’s Name
University Name
City, State
Date
RESISTIVITY OF A WIRE
by Student’s Name
Code + Course Name
Professor’s Name
University Name
City, State
Date
Paraphrase This Document
Need a fresh take? Get an instant paraphrase of this document with our AI Paraphraser
Resistivity 2
Table of Contents
List of figures.......................................................................................................................2
List of tables........................................................................................................................2
RESISTIVITY.....................................................................................................................3
Aim..................................................................................................................................3
Introduction......................................................................................................................3
Equipment........................................................................................................................4
Procedure.........................................................................................................................5
Results..............................................................................................................................6
Analysis...........................................................................................................................7
Discussion and conclusion.............................................................................................11
List of figures
Figure 1: The schematics of the set up...........................................................................................................................5
Figure 2: The experimental set up for the exercise.........................................................................................................5
Figure 3: a graph of total resistance against length for 0.28 mm nichrome wire.........................................................8
Figure 4: A graph of total resistance against length for 0.45 mm nichrome wire........................................................9
Figure 5: A graph of resistance against length for 0.28 mm constant wire.................................................................10
Figure 6: A graph of resistance against length for 0.45 mm constant wire.................................................................11
List of tables
Table 1: The reading for the nichrome wire of 0.28 mm diameter................................................................................6
Table 2: The reading for the nichrome wire of 0.45 mm diameter................................................................................6
Table 3: The reading for the Constantan wire of 0.28 mm diameter.............................................................................7
Table 4: The reading for the Constantan wire of 0.45 mm diameter.............................................................................7
Resistivity 3
RESISTIVITY
Aim
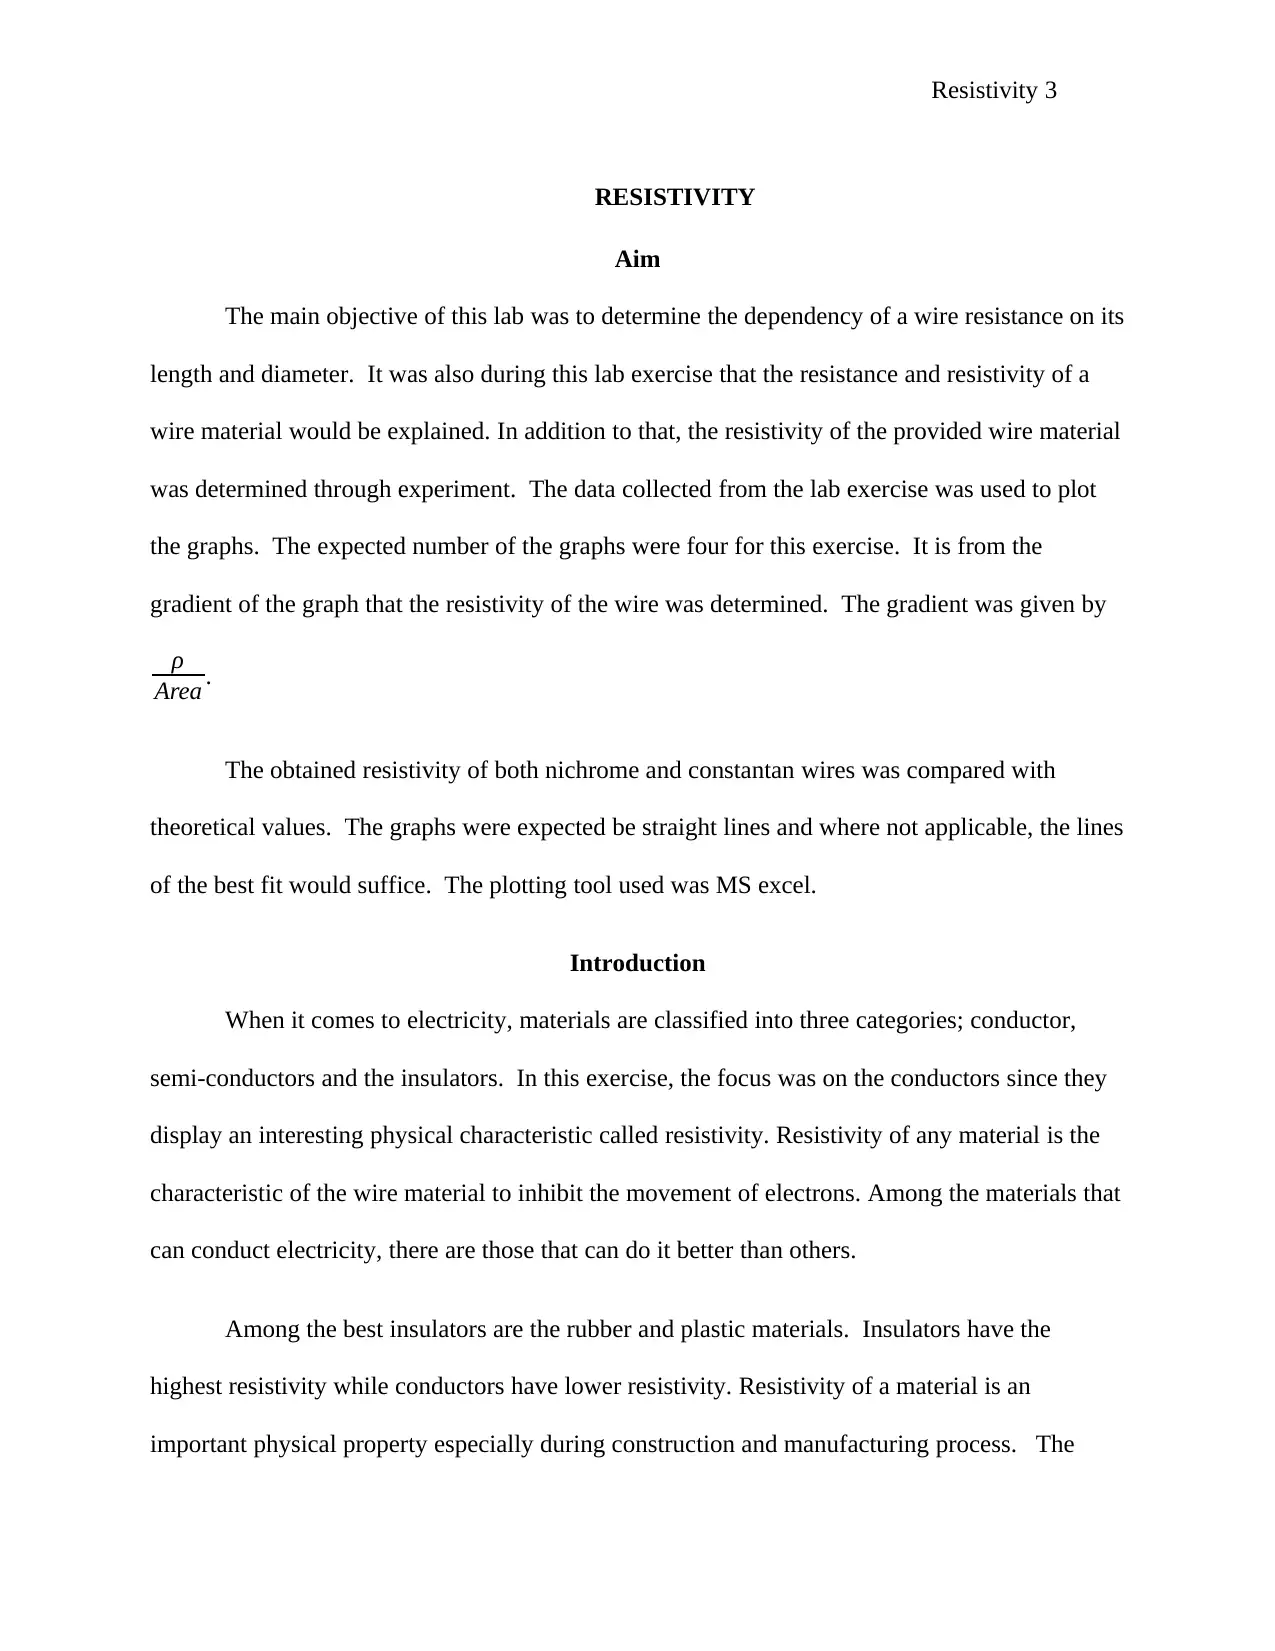
The main objective of this lab was to determine the dependency of a wire resistance on its
length and diameter. It was also during this lab exercise that the resistance and resistivity of a
wire material would be explained. In addition to that, the resistivity of the provided wire material
was determined through experiment. The data collected from the lab exercise was used to plot
the graphs. The expected number of the graphs were four for this exercise. It is from the
gradient of the graph that the resistivity of the wire was determined. The gradient was given by
ρ
Area .
The obtained resistivity of both nichrome and constantan wires was compared with
theoretical values. The graphs were expected be straight lines and where not applicable, the lines
of the best fit would suffice. The plotting tool used was MS excel.
Introduction
When it comes to electricity, materials are classified into three categories; conductor,
semi-conductors and the insulators. In this exercise, the focus was on the conductors since they
display an interesting physical characteristic called resistivity. Resistivity of any material is the
characteristic of the wire material to inhibit the movement of electrons. Among the materials that
can conduct electricity, there are those that can do it better than others.
Among the best insulators are the rubber and plastic materials. Insulators have the
highest resistivity while conductors have lower resistivity. Resistivity of a material is an
important physical property especially during construction and manufacturing process. The
RESISTIVITY
Aim
The main objective of this lab was to determine the dependency of a wire resistance on its
length and diameter. It was also during this lab exercise that the resistance and resistivity of a
wire material would be explained. In addition to that, the resistivity of the provided wire material
was determined through experiment. The data collected from the lab exercise was used to plot
the graphs. The expected number of the graphs were four for this exercise. It is from the
gradient of the graph that the resistivity of the wire was determined. The gradient was given by
ρ
Area .
The obtained resistivity of both nichrome and constantan wires was compared with
theoretical values. The graphs were expected be straight lines and where not applicable, the lines
of the best fit would suffice. The plotting tool used was MS excel.
Introduction
When it comes to electricity, materials are classified into three categories; conductor,
semi-conductors and the insulators. In this exercise, the focus was on the conductors since they
display an interesting physical characteristic called resistivity. Resistivity of any material is the
characteristic of the wire material to inhibit the movement of electrons. Among the materials that
can conduct electricity, there are those that can do it better than others.
Among the best insulators are the rubber and plastic materials. Insulators have the
highest resistivity while conductors have lower resistivity. Resistivity of a material is an
important physical property especially during construction and manufacturing process. The
⊘ This is a preview!⊘
Do you want full access?
Subscribe today to unlock all pages.
Trusted by 1+ million students worldwide
Resistivity 4
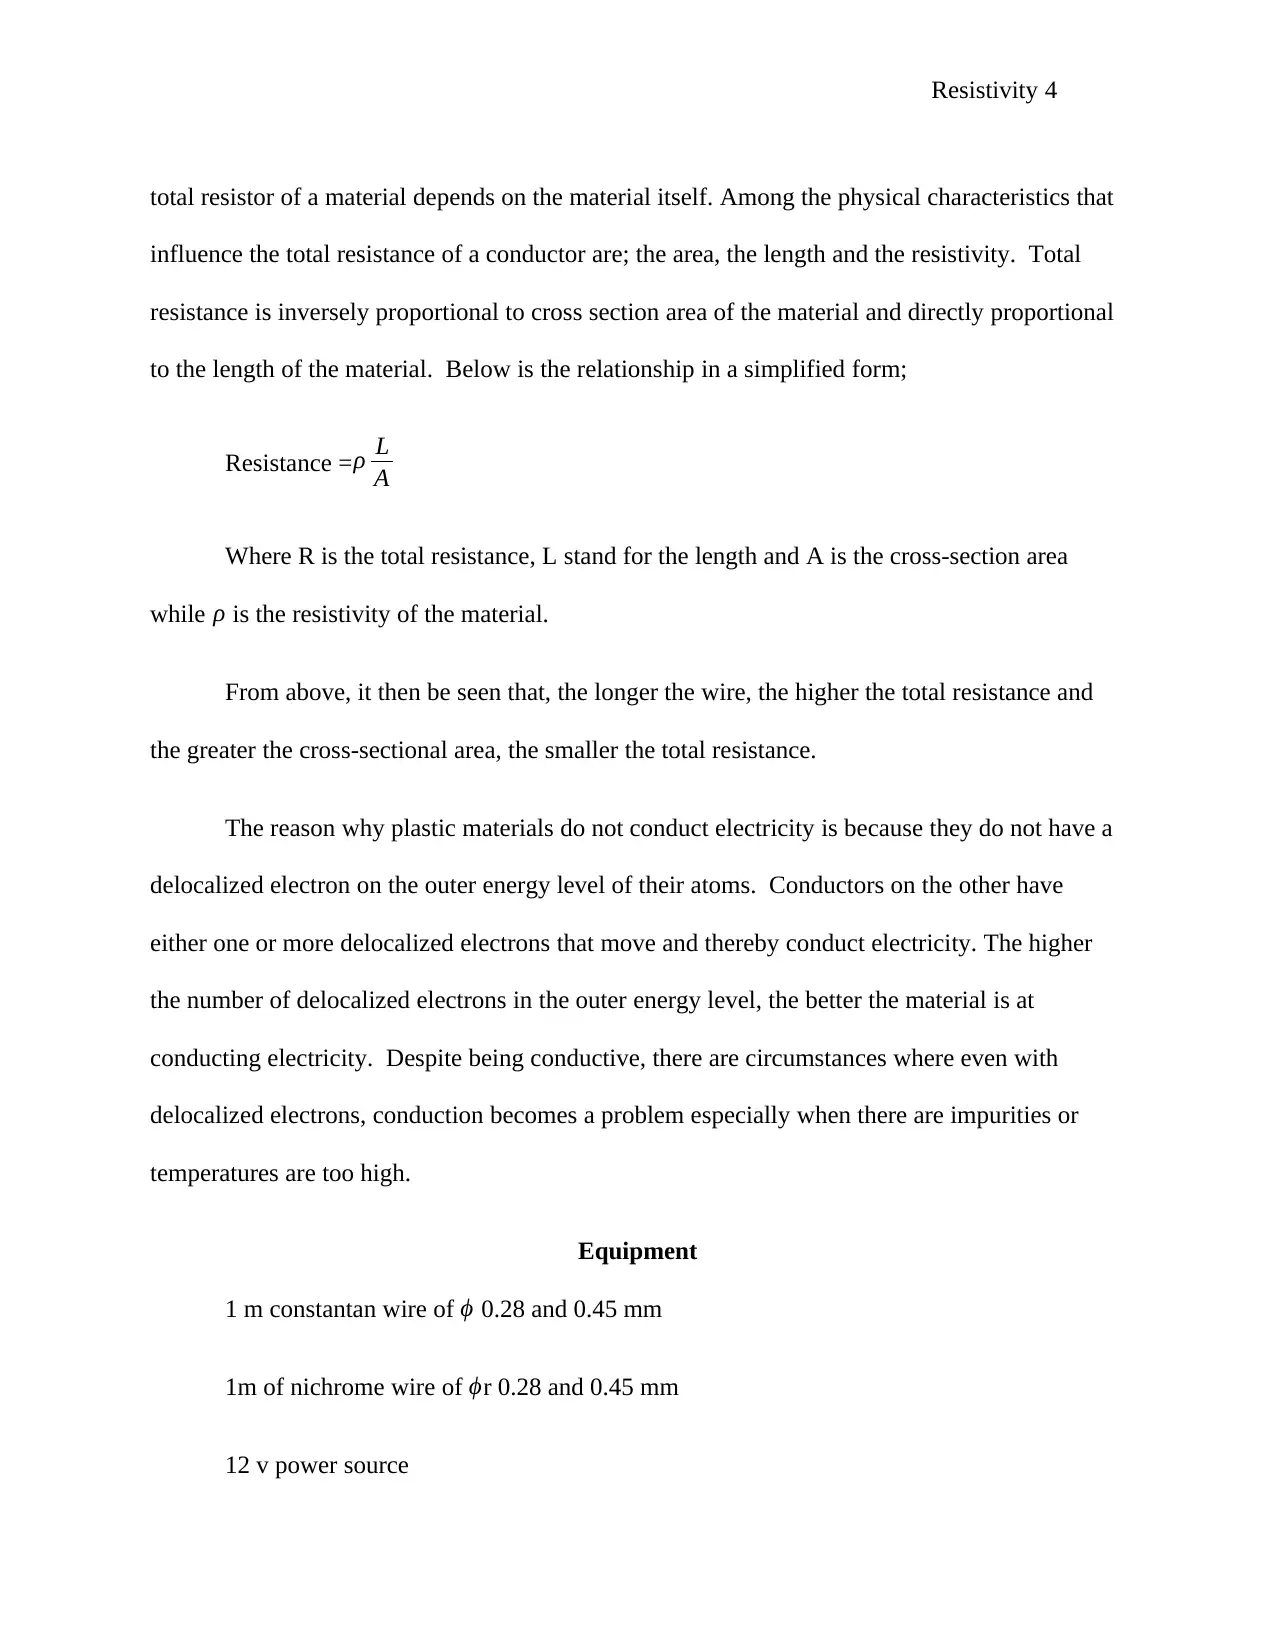
total resistor of a material depends on the material itself. Among the physical characteristics that
influence the total resistance of a conductor are; the area, the length and the resistivity. Total
resistance is inversely proportional to cross section area of the material and directly proportional
to the length of the material. Below is the relationship in a simplified form;
Resistance =ρ L
A
Where R is the total resistance, L stand for the length and A is the cross-section area
while ρ is the resistivity of the material.
From above, it then be seen that, the longer the wire, the higher the total resistance and
the greater the cross-sectional area, the smaller the total resistance.
The reason why plastic materials do not conduct electricity is because they do not have a
delocalized electron on the outer energy level of their atoms. Conductors on the other have
either one or more delocalized electrons that move and thereby conduct electricity. The higher
the number of delocalized electrons in the outer energy level, the better the material is at
conducting electricity. Despite being conductive, there are circumstances where even with
delocalized electrons, conduction becomes a problem especially when there are impurities or
temperatures are too high.
Equipment
1 m constantan wire of ϕ 0.28 and 0.45 mm
1m of nichrome wire of ϕr 0.28 and 0.45 mm
12 v power source
Paraphrase This Document
Need a fresh take? Get an instant paraphrase of this document with our AI Paraphraser
Resistivity 5
multimeters (2)
Procedure
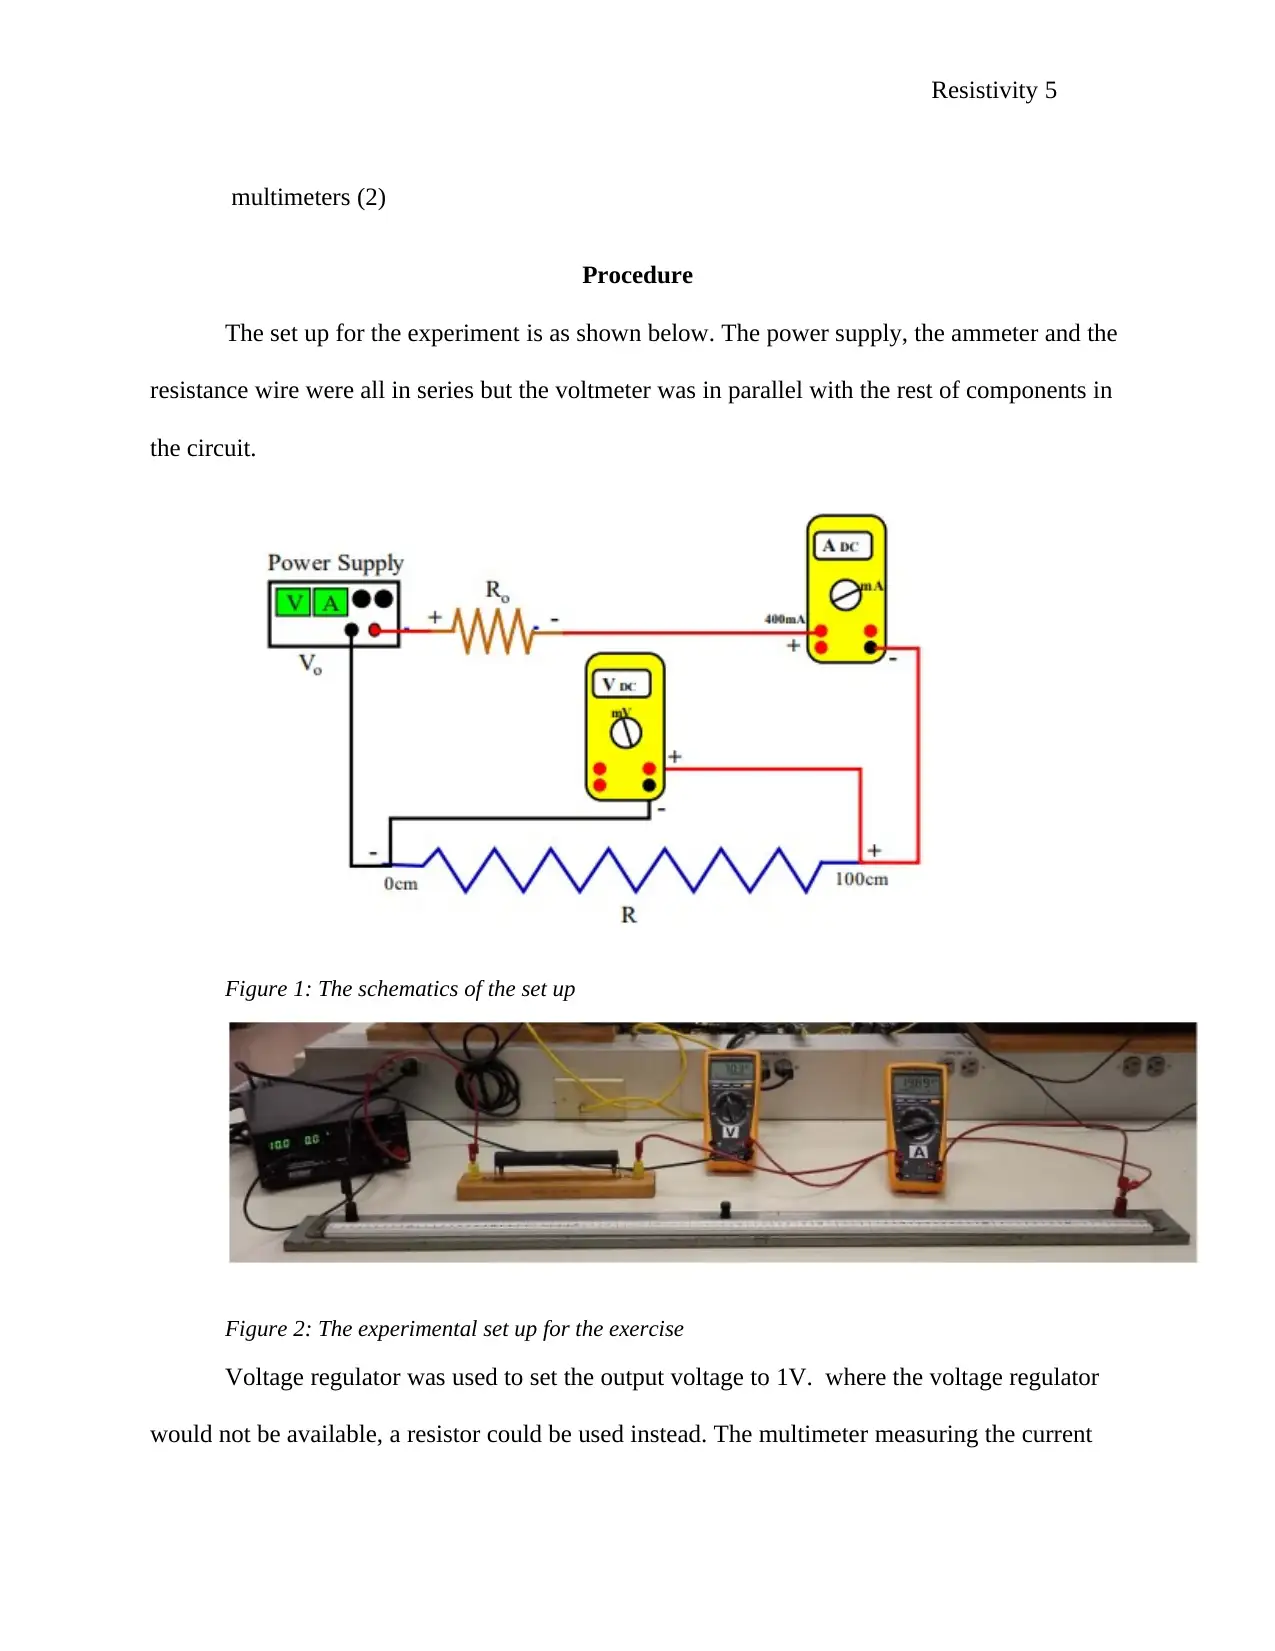
The set up for the experiment is as shown below. The power supply, the ammeter and the
resistance wire were all in series but the voltmeter was in parallel with the rest of components in
the circuit.
Figure 1: The schematics of the set up
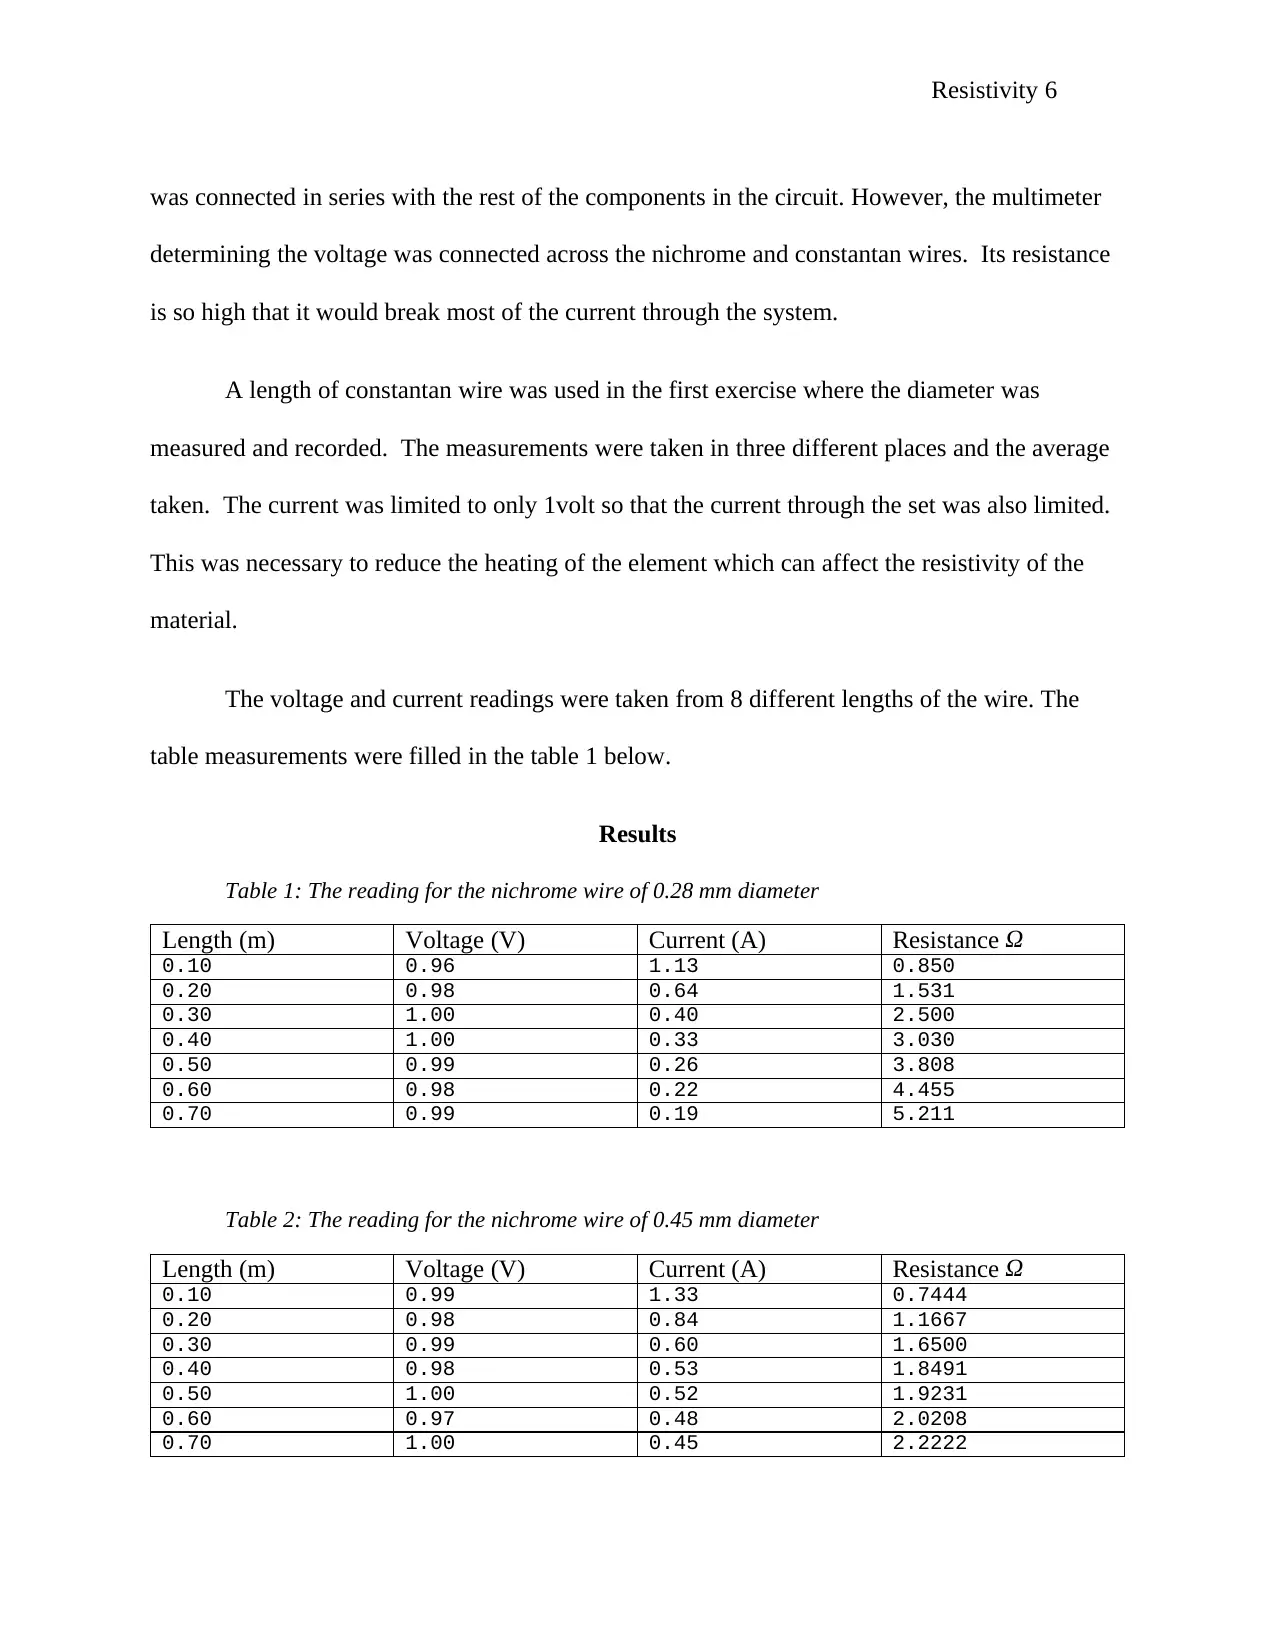
Figure 2: The experimental set up for the exercise
Voltage regulator was used to set the output voltage to 1V. where the voltage regulator
would not be available, a resistor could be used instead. The multimeter measuring the current
multimeters (2)
Procedure
The set up for the experiment is as shown below. The power supply, the ammeter and the
resistance wire were all in series but the voltmeter was in parallel with the rest of components in
the circuit.
Figure 1: The schematics of the set up
Figure 2: The experimental set up for the exercise
Voltage regulator was used to set the output voltage to 1V. where the voltage regulator
would not be available, a resistor could be used instead. The multimeter measuring the current
Resistivity 6
was connected in series with the rest of the components in the circuit. However, the multimeter
determining the voltage was connected across the nichrome and constantan wires. Its resistance
is so high that it would break most of the current through the system.
A length of constantan wire was used in the first exercise where the diameter was
measured and recorded. The measurements were taken in three different places and the average
taken. The current was limited to only 1volt so that the current through the set was also limited.
This was necessary to reduce the heating of the element which can affect the resistivity of the
material.
The voltage and current readings were taken from 8 different lengths of the wire. The
table measurements were filled in the table 1 below.
Results
Table 1: The reading for the nichrome wire of 0.28 mm diameter
Length (m) Voltage (V) Current (A) Resistance Ω
0.10 0.96 1.13 0.850
0.20 0.98 0.64 1.531
0.30 1.00 0.40 2.500
0.40 1.00 0.33 3.030
0.50 0.99 0.26 3.808
0.60 0.98 0.22 4.455
0.70 0.99 0.19 5.211
Table 2: The reading for the nichrome wire of 0.45 mm diameter
Length (m) Voltage (V) Current (A) Resistance Ω
0.10 0.99 1.33 0.7444
0.20 0.98 0.84 1.1667
0.30 0.99 0.60 1.6500
0.40 0.98 0.53 1.8491
0.50 1.00 0.52 1.9231
0.60 0.97 0.48 2.0208
0.70 1.00 0.45 2.2222
⊘ This is a preview!⊘
Do you want full access?
Subscribe today to unlock all pages.
Trusted by 1+ million students worldwide
Resistivity 7
Table 3: The reading for the Constantan wire of 0.28 mm diameter
Length (m) Voltage (V) Current (A) Resistance Ω
0.10 0.99 0.1755 5.6417
0.20 0.98 0.1606 6.1035
0.30 1.00 0.1850 5.4054
0.40 0.99 0.2045 4.8407
0.50 1.00 0.2424 4.1257
0.60 1.00 0.2707 3.6938
0.70 0.96 0.3055 3.1421
Table 4: The reading for the Constantan wire of 0.45 mm diameter
Length (m) Voltage (V) Current (A) Resistance Ω
0.10 1.00 0.20561 4.86368
0.20 0.96 0.21951 4.37342
0.30 1.00 0.19868 5.03321
0.40 0.99 0.18181 5.44528
0.50 1.00 0.16176 6.18196
0.60 0.97 0.15020 6.45815
0.70 1.00 0.13529 7.39153
Analysis
The area of 0.28 mm wire
A= π D2∗0.25
= π∗0.0282∗0.25
= 6.157 x 10⁻⁴ m2
The cross-sectional area of 0.45 mm wire
A= π D2∗0.25
= π∗0.0452∗0.25
= 1.59 x 10⁻³ m2
Paraphrase This Document
Need a fresh take? Get an instant paraphrase of this document with our AI Paraphraser
Resistivity 8
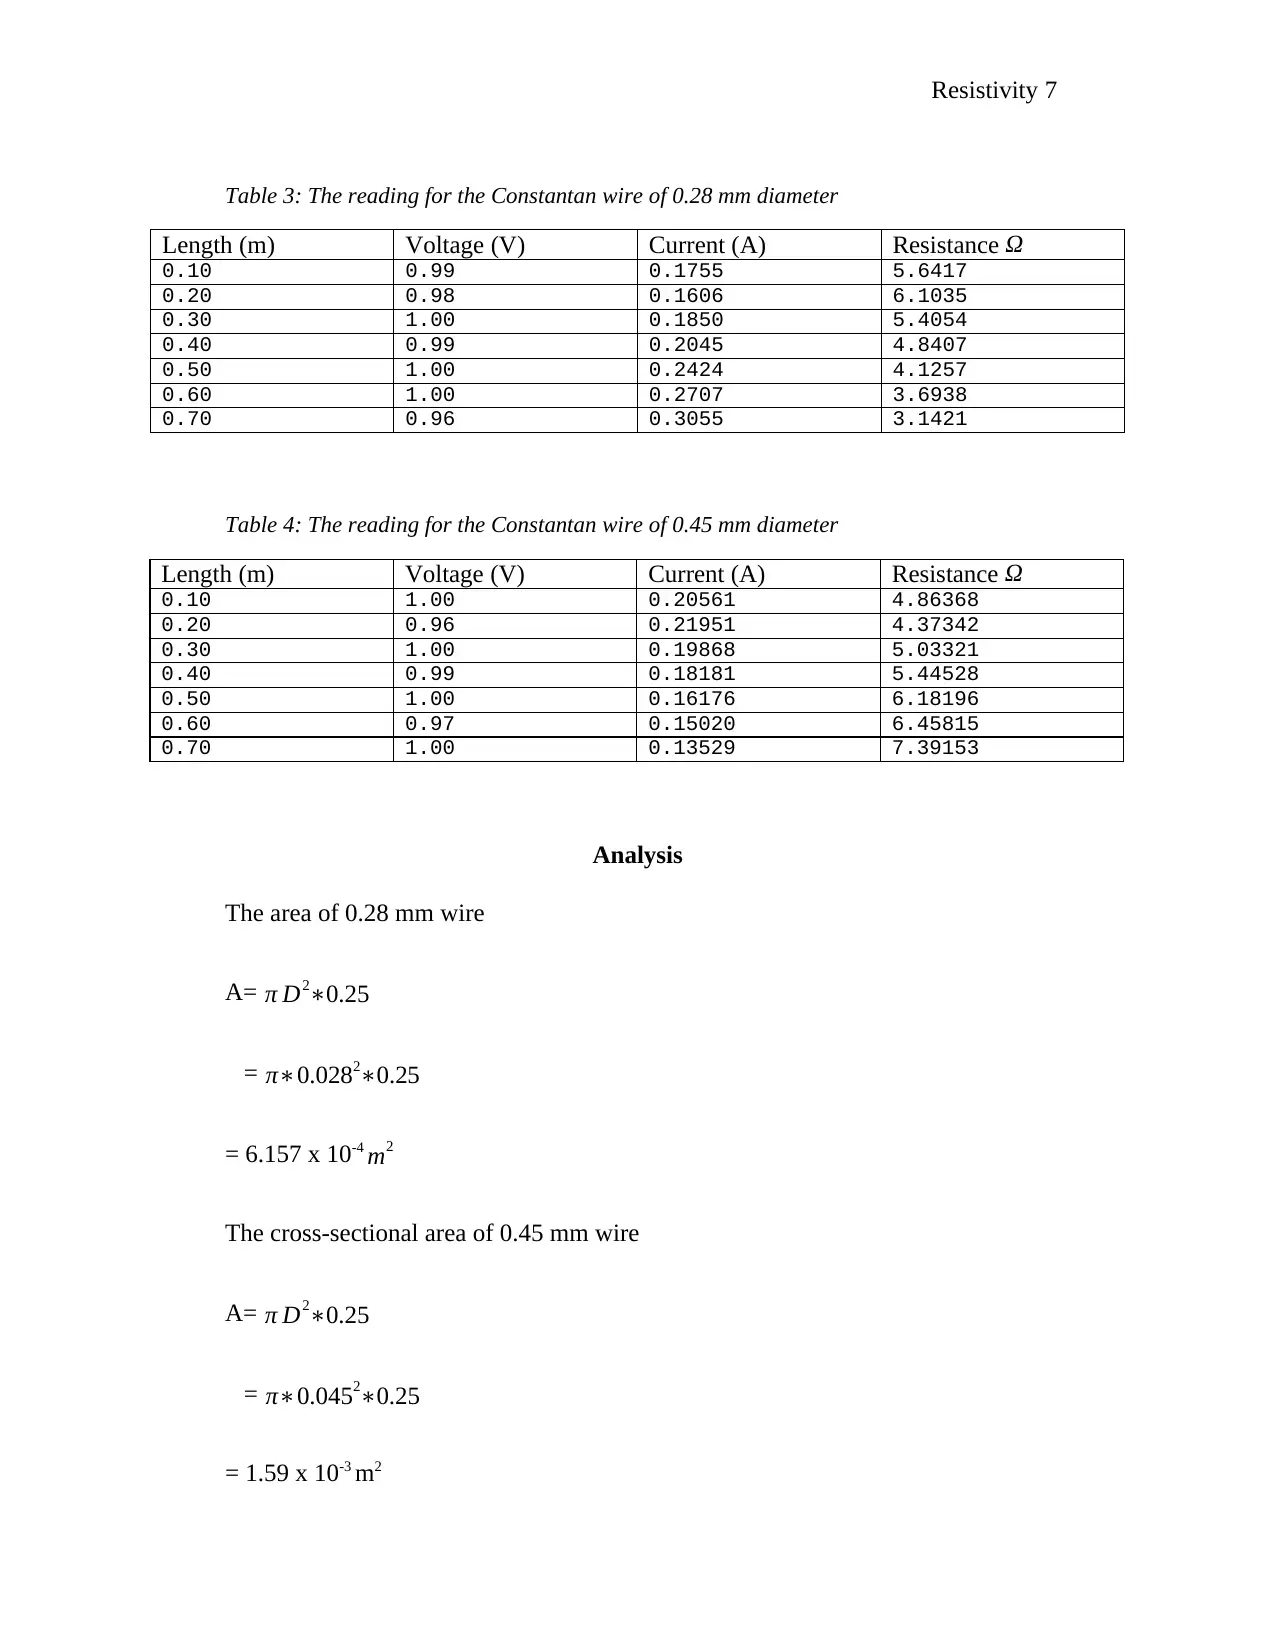
The following are graphs of the both wires for ϕ 0.28 mm and 0.45 mm
0.00 0.10 0.20 0.30 0.40 0.50 0.60 0.70 0.80 0.90
0.000
1.000
2.000
3.000
4.000
5.000
6.000
7.000
f(x) = 7.42892911489354 x + 0.103403727104677
R² = 0.996839726186329
a graph of resistance agaisnt length for 0.28 mm nichrome
wire
Length (m)
Resistance
Figure 3: a graph of total resistance against length for 0.28 mm nichrome wire
Since the gradient = ρ
A ………………………. equation 1
The resistivity is obtained as follows
ρ=A x gradient
= 6.157 x 10-4 x 7.4
= 4.55 x 10⁻³ Ω m
Resistivity 9
0.00 0.10 0.20 0.30 0.40 0.50 0.60 0.70 0.80 0.90
0.0000
0.5000
1.0000
1.5000
2.0000
2.5000 f(x) = 2.13338552951884 x + 0.784622640751614
A graph of resistance agaisnt length for 0.45 mm nichrome wire
Length (m)
Resistance (ohm)
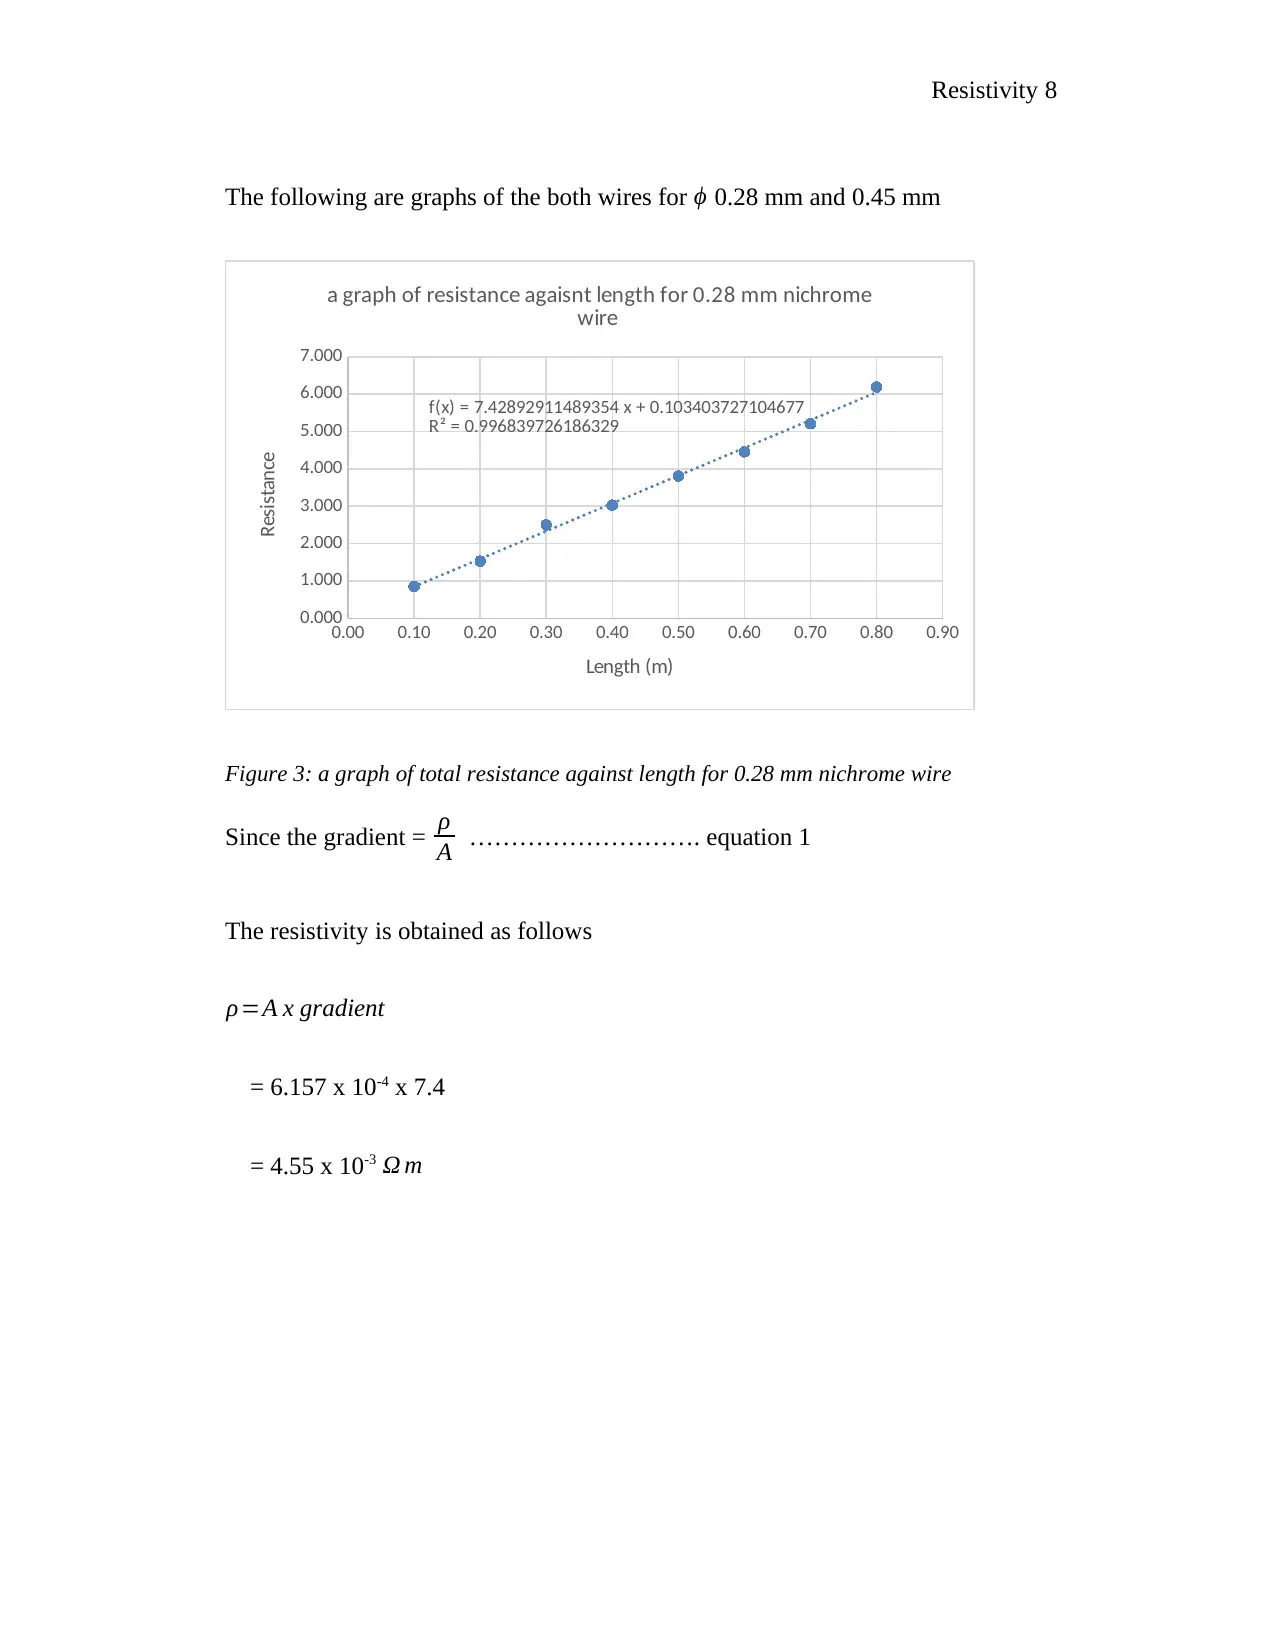
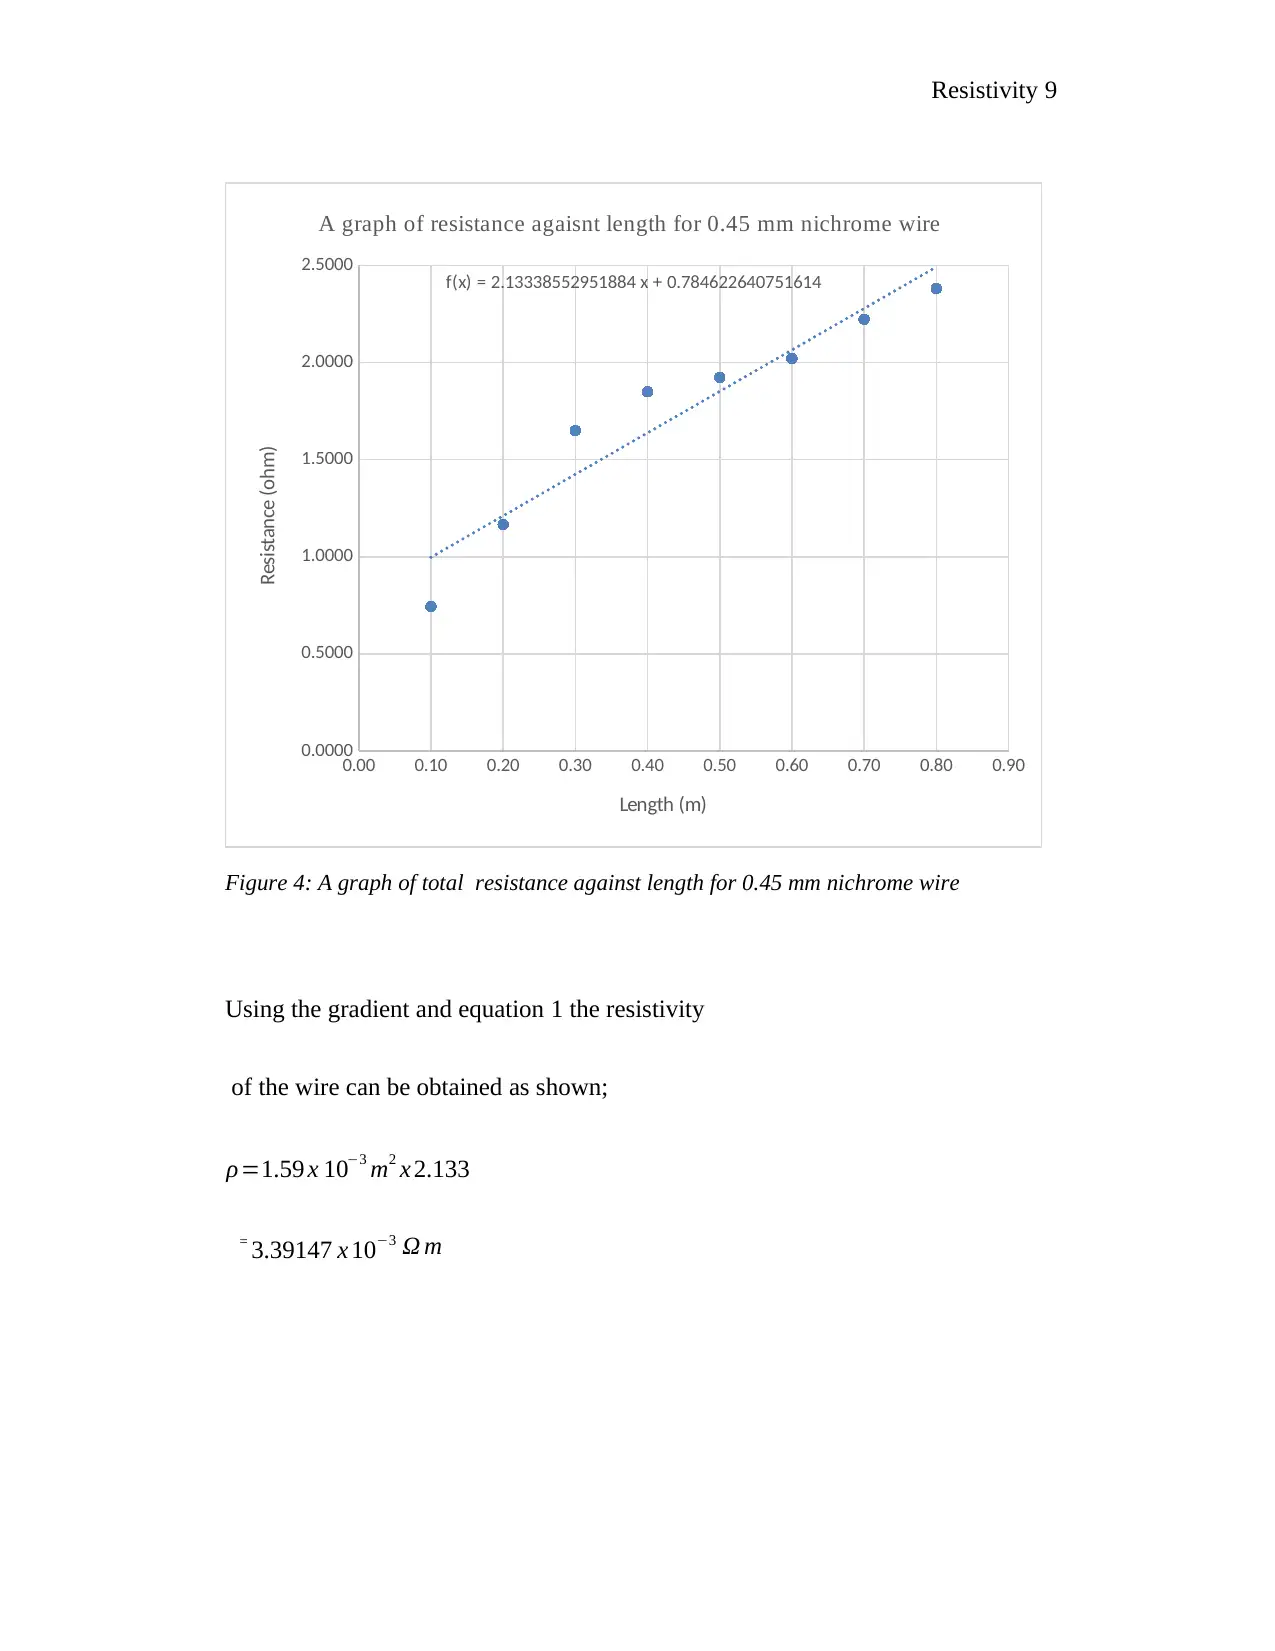
Figure 4: A graph of total resistance against length for 0.45 mm nichrome wire
Using the gradient and equation 1 the resistivity
of the wire can be obtained as shown;
ρ=1.59 x 10⁻³ m2 x 2.133
= 3.39147 x 10⁻³ Ω m
0.00 0.10 0.20 0.30 0.40 0.50 0.60 0.70 0.80 0.90
0.0000
0.5000
1.0000
1.5000
2.0000
2.5000 f(x) = 2.13338552951884 x + 0.784622640751614
A graph of resistance agaisnt length for 0.45 mm nichrome wire
Length (m)
Resistance (ohm)
Figure 4: A graph of total resistance against length for 0.45 mm nichrome wire
Using the gradient and equation 1 the resistivity
of the wire can be obtained as shown;
ρ=1.59 x 10⁻³ m2 x 2.133
= 3.39147 x 10⁻³ Ω m
⊘ This is a preview!⊘
Do you want full access?
Subscribe today to unlock all pages.
Trusted by 1+ million students worldwide
Resistivity 10
0.00 0.10 0.20 0.30 0.40 0.50 0.60 0.70 0.80 0.90
0.0000
1.0000
2.0000
3.0000
4.0000
5.0000
6.0000
7.0000
f(x) = − 4.86014133679473 x + 6.65125516467462
R² = 0.948446384733998
A graph of resistance agaisnt length for 0.28 mm constant
wire
Length (m)
Resistance
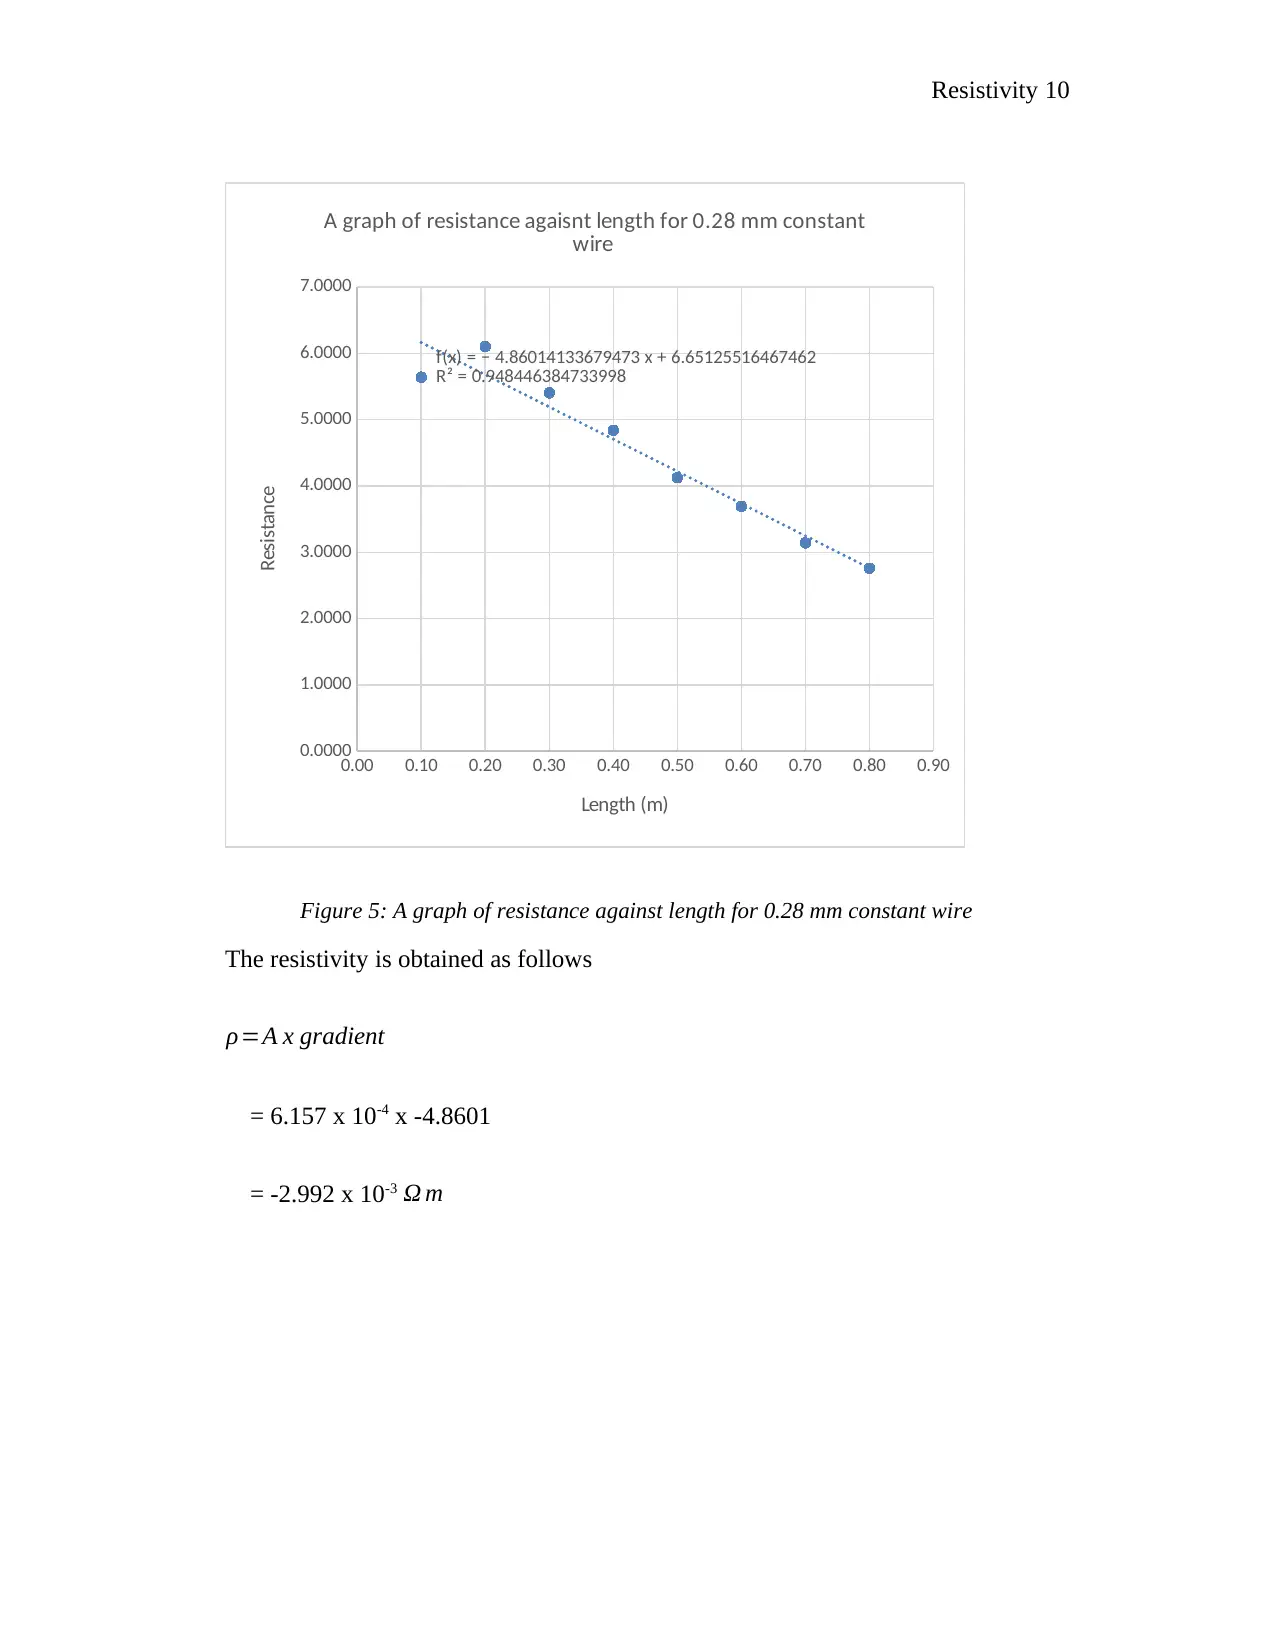
Figure 5: A graph of resistance against length for 0.28 mm constant wire
The resistivity is obtained as follows
ρ=A x gradient
= 6.157 x 10⁻⁴ x -4.8601
= -2.992 x 10⁻³ Ω m
0.00 0.10 0.20 0.30 0.40 0.50 0.60 0.70 0.80 0.90
0.0000
1.0000
2.0000
3.0000
4.0000
5.0000
6.0000
7.0000
f(x) = − 4.86014133679473 x + 6.65125516467462
R² = 0.948446384733998
A graph of resistance agaisnt length for 0.28 mm constant
wire
Length (m)
Resistance
Figure 5: A graph of resistance against length for 0.28 mm constant wire
The resistivity is obtained as follows
ρ=A x gradient
= 6.157 x 10⁻⁴ x -4.8601
= -2.992 x 10⁻³ Ω m
Paraphrase This Document
Need a fresh take? Get an instant paraphrase of this document with our AI Paraphraser

Resistivity 11
0.00 0.10 0.20 0.30 0.40 0.50 0.60 0.70 0.80 0.90
0
1
2
3
4
5
6
7
8
9
f(x) = 4.76254374023428 x + 3.78863544935829
A graph of resistance agaisnt length for 0.45 mm constant wire
Length (M)
Resistance (ohms)
Figure 6: A graph of resistance against length for 0.45 mm constant wire
The resistivity is obtained as follows
ρ=1.59 x 10⁻³ m2 x 4.76
=7.573 x 10⁻³
Discussion and conclusion
The graphs are supposed to be straight lines with a positive gradient. However, in
because of the errors, ether due faulty instrument or unfavorable environmental conditions, the
values obtained were used to make the line of the best fit from where the gradient was obtained.
In figure 5, a negative gradient was realized. This was because of the readings obtained which

Resistivity 12
were inaccurate. The most probable cause would inappropriate setting of the measuring
equipment. The rest of the graphs appeared as expected.
The resistivity values obtained for nichrome wire are 4.55 x 10⁻³ and 3.39147 x 10⁻³ Ω m.
However, the published value is 1.50 x 10⁻⁶ Ω m. For the constantan wire, the experimental
values were =7.573 x 10⁻³ and -2.992 x 10⁻³ Ω m. The published value is 4.9 x 10⁻⁶ Ω m..
Apparently, there has been disparities between the experimental values and the
theoretical values. Errors during the experiment contributed to this. Among the possible sources
of errors were using faulty multimeters. Approximation when taking the readings from
multimeter was also a possibility. The wires themselves could have contained impurities which
could have resulted to faulty results. To obtain a more accurate results, recently calibrated
multimeter could be used. Temperatures which could affect the resistivity were not accounted for
during the experiment. Any rise in temperatures, for instance from prolonged exposure on the
sunlight, could have affected the reading in a big way. Below is a table that contains resistivity
of common metals and other materials.
Material Resistivity ρ ( Ω⋅m )
Silver 2.48×20-8
Copper 2.72×20-8
Gold 2.44×20-8
Aluminum 2.64×20-8
Tungsten 4.6×20-8
Iron 8.72×20-8
Platinum 2.06×20-7
Steel 2×20-7
Lead 2.2×20-7
Manganin (Cu, Mn, Ni
alloy) 4.4×20-7
Constantan (Cu, Ni
alloy) 4.8×20-7
⊘ This is a preview!⊘
Do you want full access?
Subscribe today to unlock all pages.
Trusted by 1+ million students worldwide
1 out of 14
Your All-in-One AI-Powered Toolkit for Academic Success.
+13062052269
info@desklib.com
Available 24*7 on WhatsApp / Email
![[object Object]](/_next/static/media/star-bottom.7253800d.svg)
Unlock your academic potential
Copyright © 2020–2026 A2Z Services. All Rights Reserved. Developed and managed by ZUCOL.