University Finance: Developing and Managing a Budget Report
VerifiedAdded on  2020/05/04
|19
|1647
|42
Report
AI Summary
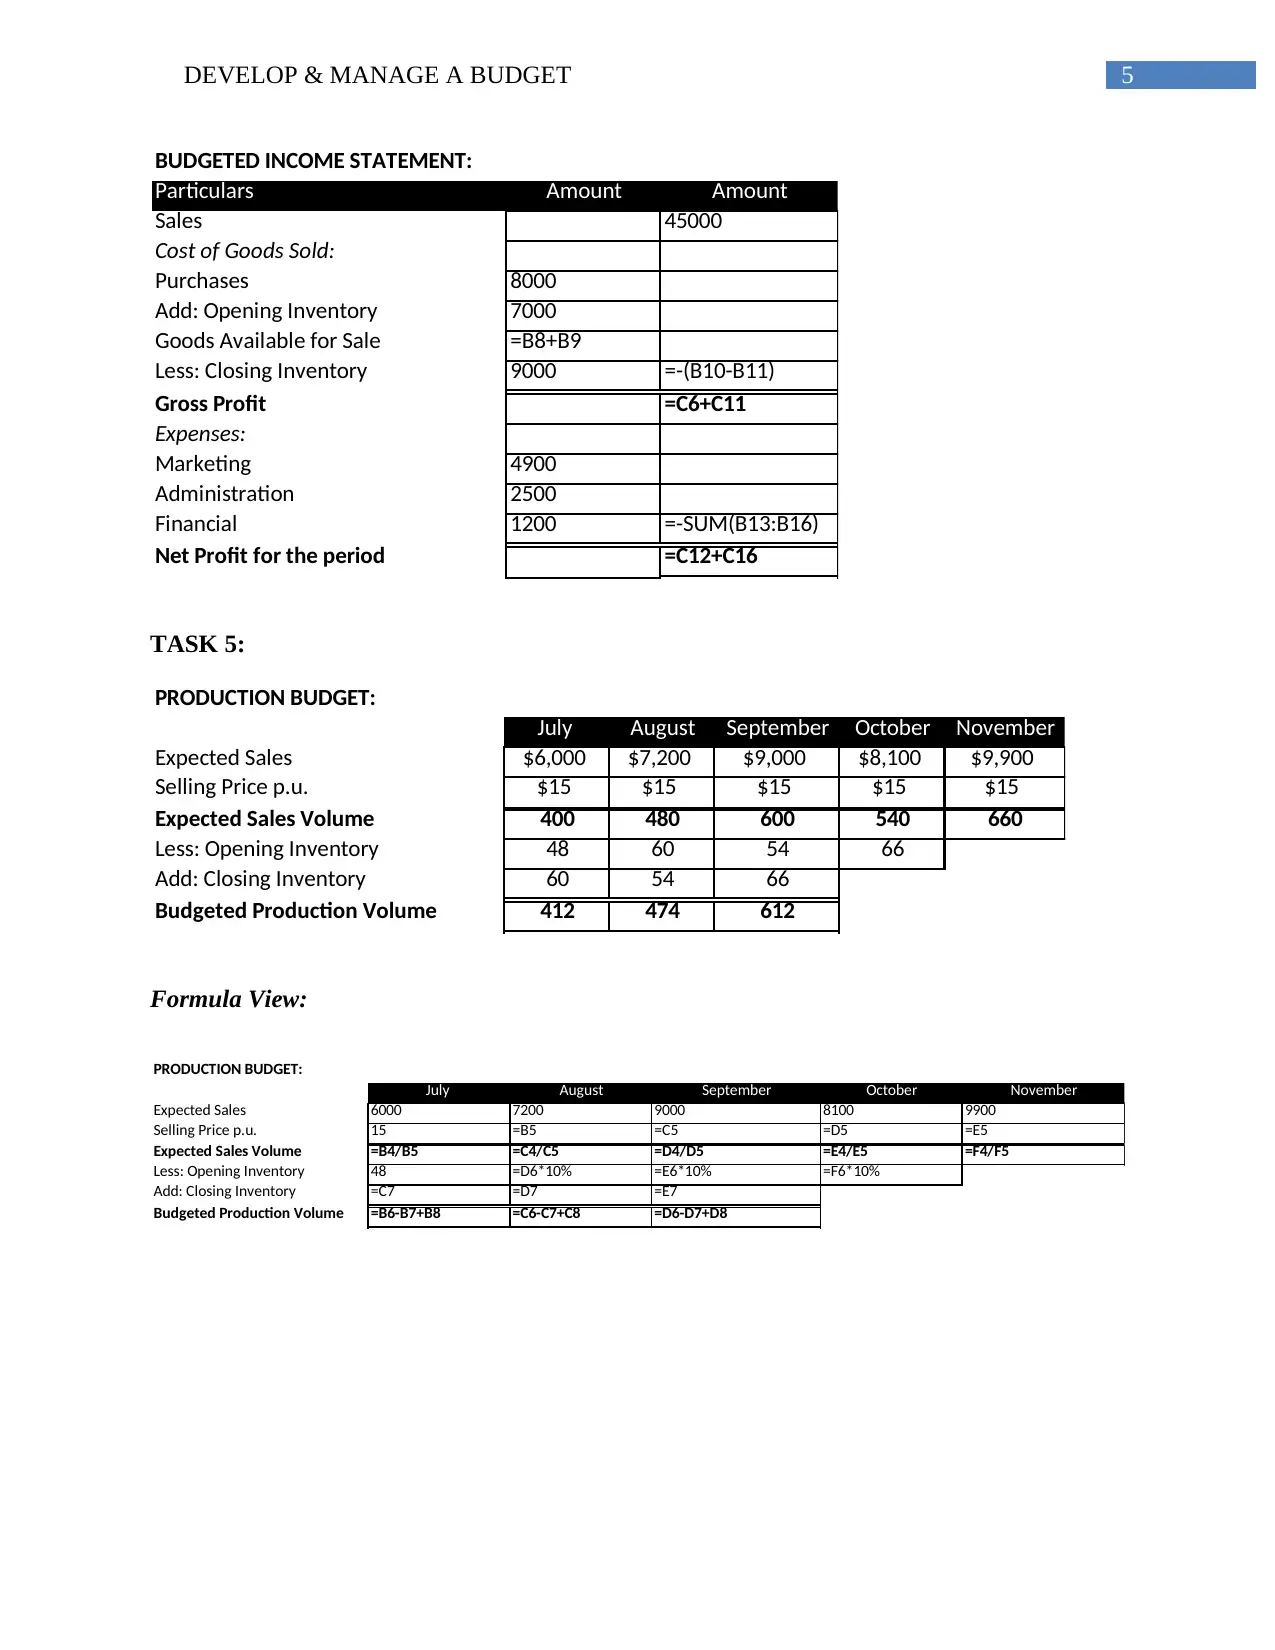
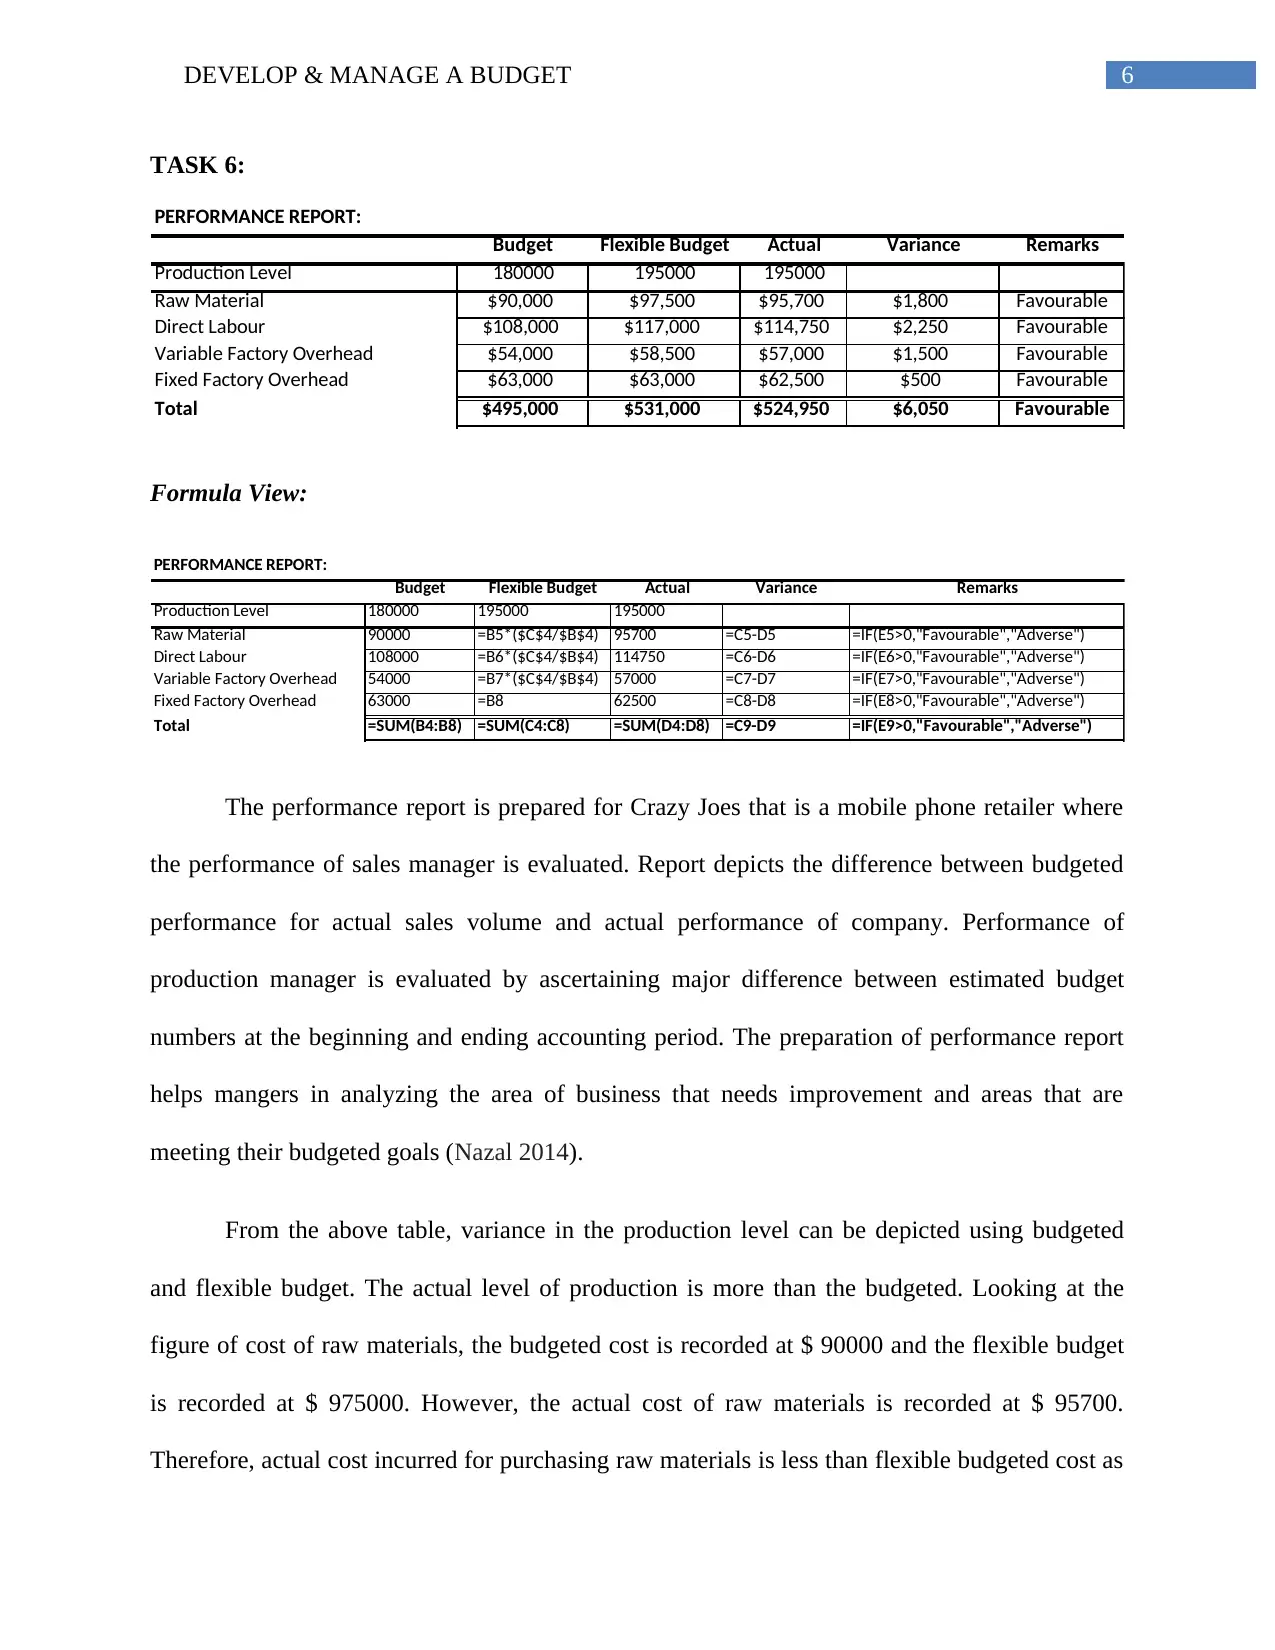
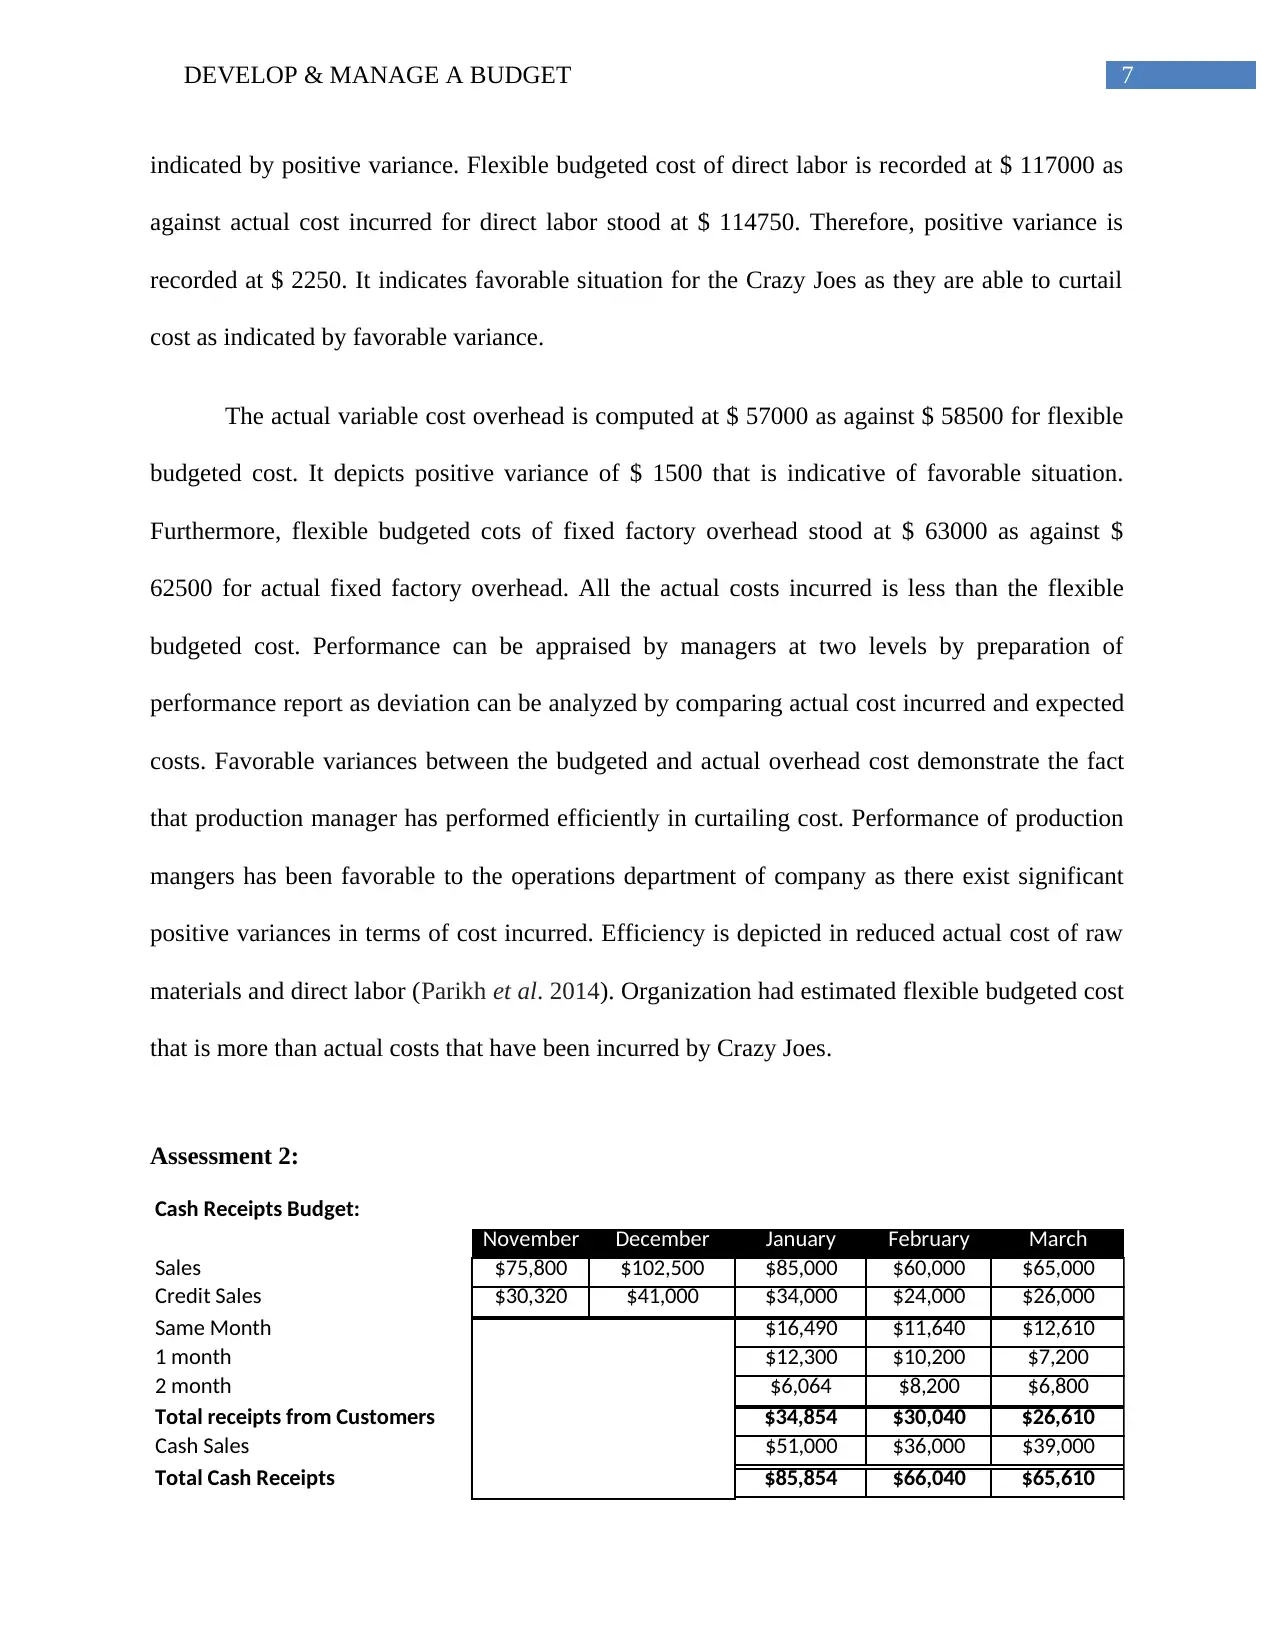
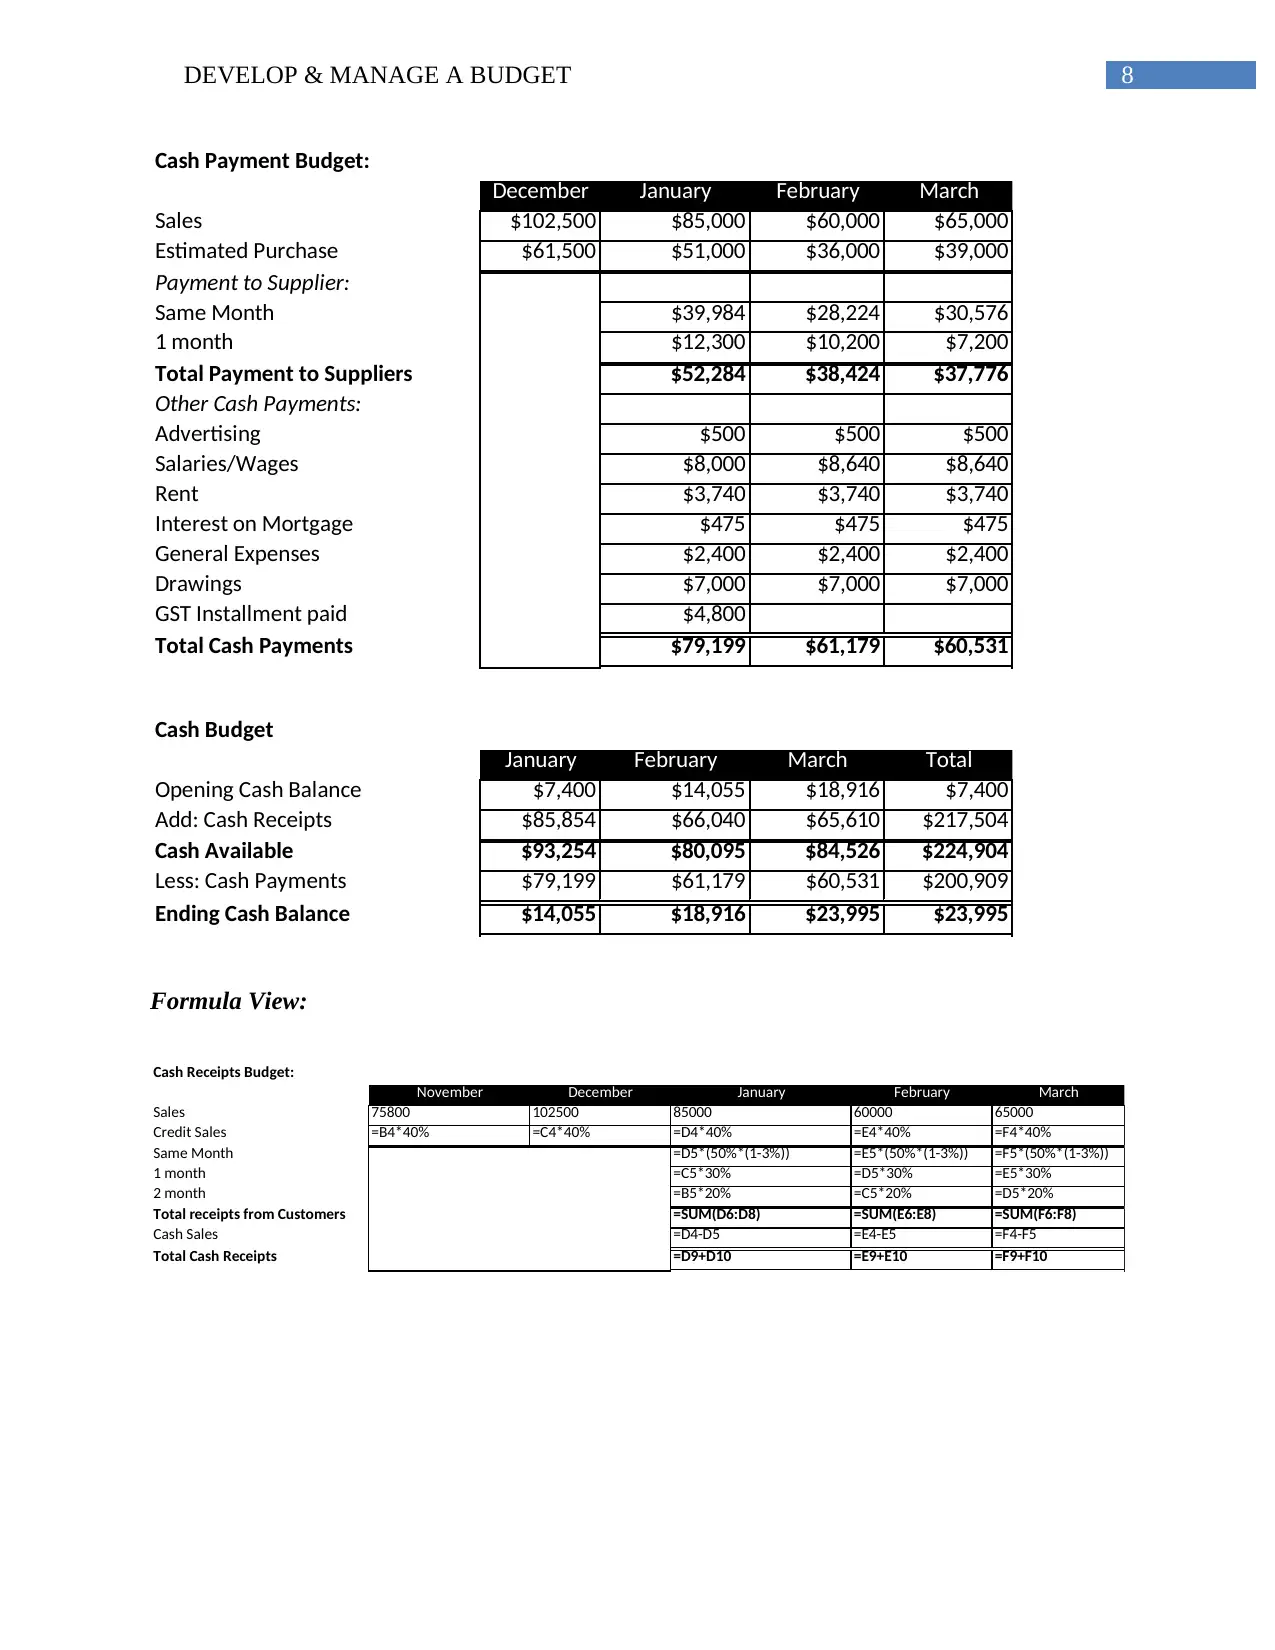
This report provides a comprehensive analysis of budget development and management, focusing on a case study of a mobile phone retailer, Crazy Joes. It details the preparation of performance reports to evaluate sales and production managers, highlighting variance analysis between budgeted and actual figures. The report examines cost control, efficiency, and the impact of flexible budgeting on raw materials, direct labor, and overhead costs. It also explores budgetary control as a management tool, emphasizing its role in coordination, financial scrutiny, resource optimization, and performance assessment. The report discusses the objectives of budgetary control, including enhanced coordination, efficient resource utilization, and the ability to monitor and control financial aspects of the business. It highlights the importance of aligning actual financial results with budgeted figures for effective management and the use of budgetary control in forecasting, planning, and communication. Furthermore, the report addresses the impact of both internal and external factors on budget modifications and the role of management accounting control systems in adapting to changing environmental circumstances, emphasizing cost control and performance evaluation.

Running head: DEVELOP & MANAGE A BUDGET
Develop &Manage a Budget
Name of the Student:
Name of the University:
Author’s Note:
Develop &Manage a Budget
Name of the Student:
Name of the University:
Author’s Note:
Paraphrase This Document
Need a fresh take? Get an instant paraphrase of this document with our AI Paraphraser

1DEVELOP & MANAGE A BUDGET
Table of Contents
Assessment 1:..................................................................................................................................2
TASK 1:.......................................................................................................................................2
TASK 2:.......................................................................................................................................2
TASK 3:.......................................................................................................................................3
TASK 4:.......................................................................................................................................4
TASK 5:.......................................................................................................................................5
TASK 6:.......................................................................................................................................6
Assessment 2:..................................................................................................................................7
Assessment 3:................................................................................................................................10
References list:...............................................................................................................................17

2DEVELOP & MANAGE A BUDGET
Assessment 1:
TASK 1:
SALES BUDGET:
Sydney Melbourne Brisbane Gold Coast Adelaide Perth
Nos. of Sales 740 680 620 710 550 420
Average Price per unit $260 $220 $200 $190 $180 $170
Projected Sales $192,400 $149,600 $124,000 $134,900 $99,000 $71,400
Formula View:
SALES BUDGET:
Sydney Melbourne Brisbane Gold Coast Adelaide Perth
Nos. of Sales 740 680 620 710 550 420
Average Price per unit 260 220 200 190 180 170
Projected Sales =B4*B5 =C4*C5 =D4*D5 =E4*E5 =F4*F5 =G4*G5
TASK 2:
PURCHASE BUDGET:
October November December January
Budgeted Sales ($) $120,000 $140,000 $250,000 $125,000
Budgeted Cost of Goods Sold $96,000 $112,000 $200,000 $100,000
Add: Closing Inventory $168,000 $300,000 $150,000
Cost of Goods Available for Sale $264,000 $412,000 $350,000
Less: Opening Inventory $144,000 $168,000 $300,000
Budgeted Purchase $120,000 $244,000 $50,000
Formula View:
PURCHASE BUDGET:
October November December January
Budgeted Sales ($) 120000 140000 250000 125000
Budgeted Cost of Goods Sold =B4*(100%/125%) =C4*(100%/125%) =D4*(100%/125%) =E4*(100%/125%)
Add: Closing Inventory =C5*150% =D5*150% =E5*150%
Cost of Goods Available for Sale =B5+B6 =C5+C6 =D5+D6
Less: Opening Inventory 144000 =B6 =C6
Budgeted Purchase =B7-B8 =C7-C8 =D7-D8
⊘ This is a preview!⊘
Do you want full access?
Subscribe today to unlock all pages.

Trusted by 1+ million students worldwide

3DEVELOP & MANAGE A BUDGET
TASK 3:
EXPENSE BUDGET:
Particulars Amount
Expected Sales $95,000
Fixed Expenses:
Managers' Salary $6,000
Depreciation on Delivery Schedule $1,000
Depreciation of Fixtures & fittings $1,500
Stationery $1,100
Rent $1,000
Interest on Loan $2,500
General Expesnse $800
Total Fixed Expenses $13,900
Variable Expenses:
Advertising $2,500
Commission $1,900
Cartage $950
Discount Allowed $2,375
Total Variable Expenses $7,725
Total Budgeted Expenses $21,625
Formual View:
Paraphrase This Document
Need a fresh take? Get an instant paraphrase of this document with our AI Paraphraser

4DEVELOP & MANAGE A BUDGET
EXPENSE BUDGET:
Particulars Amount
Expected Sales 95000
Fixed Expenses:
Managers' Salary 6000
Depreciation on Delivery Schedule 1000
Depreciation of Fixtures & fittings 1500
Stationery 1100
Rent 1000
Interest on Loan 2500
General Expesnse 800
Total Fixed Expenses =SUM(B6:B12)
Variable Expenses:
Advertising =600+(B4*2%)
Commission =B4*2%
Cartage =B4*1%
Discount Allowed =B4*2.5%
Total Variable Expenses =SUM(B15:B18)
Total Budgeted Expenses =B19+B13
TASK 4:
BUDGETED INCOME STATEMENT:
Particulars Amount Amount
Sales $45,000
Cost of Goods Sold:
Purchases $8,000
Add: Opening Inventory $7,000
Goods Available for Sale $15,000
Less: Closing Inventory $9,000 ($6,000)
Gross Profit $39,000
Expenses:
Marketing $4,900
Administration $2,500
Financial $1,200 ($8,600)
Net Profit for the period $30,400
Formula View:

5DEVELOP & MANAGE A BUDGET
BUDGETED INCOME STATEMENT:
Particulars Amount Amount
Sales 45000
Cost of Goods Sold:
Purchases 8000
Add: Opening Inventory 7000
Goods Available for Sale =B8+B9
Less: Closing Inventory 9000 =-(B10-B11)
Gross Profit =C6+C11
Expenses:
Marketing 4900
Administration 2500
Financial 1200 =-SUM(B13:B16)
Net Profit for the period =C12+C16
TASK 5:
PRODUCTION BUDGET:
July August September October November
Expected Sales $6,000 $7,200 $9,000 $8,100 $9,900
Selling Price p.u. $15 $15 $15 $15 $15
Expected Sales Volume 400 480 600 540 660
Less: Opening Inventory 48 60 54 66
Add: Closing Inventory 60 54 66
Budgeted Production Volume 412 474 612
Formula View:
PRODUCTION BUDGET:
July August September October November
Expected Sales 6000 7200 9000 8100 9900
Selling Price p.u. 15 =B5 =C5 =D5 =E5
Expected Sales Volume =B4/B5 =C4/C5 =D4/D5 =E4/E5 =F4/F5
Less: Opening Inventory 48 =D6*10% =E6*10% =F6*10%
Add: Closing Inventory =C7 =D7 =E7
Budgeted Production Volume =B6-B7+B8 =C6-C7+C8 =D6-D7+D8
⊘ This is a preview!⊘
Do you want full access?
Subscribe today to unlock all pages.

Trusted by 1+ million students worldwide

6DEVELOP & MANAGE A BUDGET
TASK 6:
PERFORMANCE REPORT:
Budget Flexible Budget Actual Variance Remarks
Production Level 180000 195000 195000
Raw Material $90,000 $97,500 $95,700 $1,800 Favourable
Direct Labour $108,000 $117,000 $114,750 $2,250 Favourable
Variable Factory Overhead $54,000 $58,500 $57,000 $1,500 Favourable
Fixed Factory Overhead $63,000 $63,000 $62,500 $500 Favourable
Total $495,000 $531,000 $524,950 $6,050 Favourable
Formula View:
PERFORMANCE REPORT:
Budget Flexible Budget Actual Variance Remarks
Production Level 180000 195000 195000
Raw Material 90000 =B5*($C$4/$B$4) 95700 =C5-D5 =IF(E5>0,"Favourable","Adverse")
Direct Labour 108000 =B6*($C$4/$B$4) 114750 =C6-D6 =IF(E6>0,"Favourable","Adverse")
Variable Factory Overhead 54000 =B7*($C$4/$B$4) 57000 =C7-D7 =IF(E7>0,"Favourable","Adverse")
Fixed Factory Overhead 63000 =B8 62500 =C8-D8 =IF(E8>0,"Favourable","Adverse")
Total =SUM(B4:B8) =SUM(C4:C8) =SUM(D4:D8) =C9-D9 =IF(E9>0,"Favourable","Adverse")
The performance report is prepared for Crazy Joes that is a mobile phone retailer where
the performance of sales manager is evaluated. Report depicts the difference between budgeted
performance for actual sales volume and actual performance of company. Performance of
production manager is evaluated by ascertaining major difference between estimated budget
numbers at the beginning and ending accounting period. The preparation of performance report
helps mangers in analyzing the area of business that needs improvement and areas that are
meeting their budgeted goals (Nazal 2014).
From the above table, variance in the production level can be depicted using budgeted
and flexible budget. The actual level of production is more than the budgeted. Looking at the
figure of cost of raw materials, the budgeted cost is recorded at $ 90000 and the flexible budget
is recorded at $ 975000. However, the actual cost of raw materials is recorded at $ 95700.
Therefore, actual cost incurred for purchasing raw materials is less than flexible budgeted cost as
Paraphrase This Document
Need a fresh take? Get an instant paraphrase of this document with our AI Paraphraser

7DEVELOP & MANAGE A BUDGET
indicated by positive variance. Flexible budgeted cost of direct labor is recorded at $ 117000 as
against actual cost incurred for direct labor stood at $ 114750. Therefore, positive variance is
recorded at $ 2250. It indicates favorable situation for the Crazy Joes as they are able to curtail
cost as indicated by favorable variance.
The actual variable cost overhead is computed at $ 57000 as against $ 58500 for flexible
budgeted cost. It depicts positive variance of $ 1500 that is indicative of favorable situation.
Furthermore, flexible budgeted cots of fixed factory overhead stood at $ 63000 as against $
62500 for actual fixed factory overhead. All the actual costs incurred is less than the flexible
budgeted cost. Performance can be appraised by managers at two levels by preparation of
performance report as deviation can be analyzed by comparing actual cost incurred and expected
costs. Favorable variances between the budgeted and actual overhead cost demonstrate the fact
that production manager has performed efficiently in curtailing cost. Performance of production
mangers has been favorable to the operations department of company as there exist significant
positive variances in terms of cost incurred. Efficiency is depicted in reduced actual cost of raw
materials and direct labor (Parikh et al. 2014). Organization had estimated flexible budgeted cost
that is more than actual costs that have been incurred by Crazy Joes.
Assessment 2:
Cash Receipts Budget:
November December January February March
Sales $75,800 $102,500 $85,000 $60,000 $65,000
Credit Sales $30,320 $41,000 $34,000 $24,000 $26,000
Same Month $16,490 $11,640 $12,610
1 month $12,300 $10,200 $7,200
2 month $6,064 $8,200 $6,800
Total receipts from Customers $34,854 $30,040 $26,610
Cash Sales $51,000 $36,000 $39,000
Total Cash Receipts $85,854 $66,040 $65,610

8DEVELOP & MANAGE A BUDGET
Cash Payment Budget:
December January February March
Sales $102,500 $85,000 $60,000 $65,000
Estimated Purchase $61,500 $51,000 $36,000 $39,000
Payment to Supplier:
Same Month $39,984 $28,224 $30,576
1 month $12,300 $10,200 $7,200
Total Payment to Suppliers $52,284 $38,424 $37,776
Other Cash Payments:
Advertising $500 $500 $500
Salaries/Wages $8,000 $8,640 $8,640
Rent $3,740 $3,740 $3,740
Interest on Mortgage $475 $475 $475
General Expenses $2,400 $2,400 $2,400
Drawings $7,000 $7,000 $7,000
GST Installment paid $4,800
Total Cash Payments $79,199 $61,179 $60,531
Cash Budget
January February March Total
Opening Cash Balance $7,400 $14,055 $18,916 $7,400
Add: Cash Receipts $85,854 $66,040 $65,610 $217,504
Cash Available $93,254 $80,095 $84,526 $224,904
Less: Cash Payments $79,199 $61,179 $60,531 $200,909
Ending Cash Balance $14,055 $18,916 $23,995 $23,995
Formula View:
Cash Receipts Budget:
November December January February March
Sales 75800 102500 85000 60000 65000
Credit Sales =B4*40% =C4*40% =D4*40% =E4*40% =F4*40%
Same Month =D5*(50%*(1-3%)) =E5*(50%*(1-3%)) =F5*(50%*(1-3%))
1 month =C5*30% =D5*30% =E5*30%
2 month =B5*20% =C5*20% =D5*20%
Total receipts from Customers =SUM(D6:D8) =SUM(E6:E8) =SUM(F6:F8)
Cash Sales =D4-D5 =E4-E5 =F4-F5
Total Cash Receipts =D9+D10 =E9+E10 =F9+F10
⊘ This is a preview!⊘
Do you want full access?
Subscribe today to unlock all pages.

Trusted by 1+ million students worldwide

9DEVELOP & MANAGE A BUDGET
Cash Payment Budget:
December January February March
Sales =C4 =D4 =E4 =F4
Estimated Purchase =B16*60% =C16*60% =D16*60% =E16*60%
Payment to Supplier:
Same Month =C17*(80%*(1-2%)) =D17*(80%*(1-2%)) =E17*(80%*(1-2%))
1 month =B17*20% =C17*20% =D17*20%
Total Payment to Suppliers =C19+C20 =D19+D20 =E19+E20
Other Cash Payments:
Advertising 500 =C23 =D23
Salaries/Wages 8000 =C24*(1+8%) =D24
Rent 3740 =C25 =D25
Interest on Mortgage 475 =C26 =D26
General Expenses 2400 =C27 =D27
Drawings 7000 =C28 =D28
GST Installment paid 4800
Total Cash Payments =SUM(C21:C29) =SUM(D21:D29) =SUM(E21:E29)
Cash Budget
January February March Total
Opening Cash Balance 7400 =B39 =C39 =B35
Add: Cash Receipts =D11 =E11 =F11 =SUM(B36:D36)
Cash Available =B35+B36 =C35+C36 =D35+D36 =E35+E36
Less: Cash Payments =C30 =D30 =E30 =SUM(B38:D38)
Ending Cash Balance =B37-B38 =C37-C38 =D37-D38 =E37-E38
Paraphrase This Document
Need a fresh take? Get an instant paraphrase of this document with our AI Paraphraser

10DEVELOP & MANAGE A BUDGET
Assessment 3:
Sales $420,000
Less: Cost of Goods Sold
Opening Inventory $2,400
Add: Purchase $299,600
Goods Available $302,000
Less: Ending Inventory $2,000
Gross Profit $120,000
Less: Expenses
Advertising 17200
Salaries & Wages 34600
Office Expenses 7600
Rates & Taxes 3800
Sales Commission 4900
Motor Vehicle Expense 9600
Depreciation 4000
Interest 1200
Bank Charges 300
Net Profit $36,800
for the year to end 30 June 2016
Budgeted Income Statement
Opening Cash Balance ($4,400)
Add: Receipts $417,600
Cash Available $413,200
Less: Payments
Accounts Payable $297,600
Cash Expenses 78000
Mortgage Repayments 6000
Drawings 31200 $412,800
Ending Cash Balance $400
Cash Budget
for the year to end 30 June 2016

11DEVELOP & MANAGE A BUDGET
Current Assets
Bank $400
Accounts Receivable $6,400
Inventories $2,000
Non-Current Assets
Motor Vehicle $20,000
Less: Accum Dep'n- Motor Vehicles ($16,000)
Land & Buildings $60,000
Total Assets $72,800
Current Liabilities
Accounts Payable $8,000
Non-Current Liabilities
Mortgage $35,200
Total Liabilities $43,200
Net Assets $29,600
Capital (Owner's Equity)
Capital 1 July $24,000
Add: Net Profit $36,800
Less: Drawings $31,200
Owner's Equity at end of period $29,600
Budgeted Balance Sheet
as at June 30 2016
Workings:
Op. Bal $4,000 Receipts $417,600
Sales $420,000 Cl. Bal $6,400
$424,000 $424,000
Op. Bal $2,400 COGS $300,000
Purchases $299,600 Cl. Bal $2,000
$302,000 $302,000
Payments $297,600 Op Bal $6,000
Cl. Bal $8,000 Purchase $299,600
$305,600 $305,600
Accounts Receivable
Inventories
Accounts Payable
Formula View:
⊘ This is a preview!⊘
Do you want full access?
Subscribe today to unlock all pages.

Trusted by 1+ million students worldwide
1 out of 19
Related Documents
Your All-in-One AI-Powered Toolkit for Academic Success.
 +13062052269
info@desklib.com
Available 24*7 on WhatsApp / Email
Unlock your academic potential
Copyright © 2020–2025 A2Z Services. All Rights Reserved. Developed and managed by ZUCOL.


