MGMT20005 Business Decision Analysis: DHL Supply Chain Optimization
VerifiedAdded on 2023/06/03
|14
|3376
|96
Case Study
AI Summary
This case study examines DHL's supply chain optimization efforts, focusing on reducing carbon dioxide emissions within a set budget. The analysis employs linear programming to determine the optimal number of LCD TV sets (LCD 32 and LCD 42) to be produced by subcontractors, considering various transportation modes (regular air, air express, road, road LTL, and road network). The study explores how the original supply chain was optimized on a budget of CNY 3 billion and the potential impact of a 10% budget increase to CNY 3.3 billion on CO2 emission reduction. Results from the solver analysis reveal the required quantities of LCD TV sets and the optimal amounts for each transportation constraint variable to minimize production costs and reduce carbon emissions by 30%. Desklib provides this and many other solved assignments for students.
Running head: OPTIMIZATION 1
MGMT20005 Business Decision Analysis
Assignment 2
DHL Supply Chain
Name:
Institution:
Business Decision Analysis Assignment 2
MGMT20005 Business Decision Analysis
Assignment 2
DHL Supply Chain
Name:
Institution:
Business Decision Analysis Assignment 2
Paraphrase This Document
Need a fresh take? Get an instant paraphrase of this document with our AI Paraphraser
Contents
Introduction.........................................................................................................................................3
Literature review.................................................................................................................................4
Methodology........................................................................................................................................6
Implementation....................................................................................................................................7
How the original supply chain was optimised on a budget of CNY 3 billion..............................7
The extent of the reduction in CO2 emission if the budget were increased by 10 per cent to
CNY 3.3 billion.................................................................................................................................8
Discussions and Conclusions...............................................................................................................9
References..........................................................................................................................................11
Appendix............................................................................................................................................12
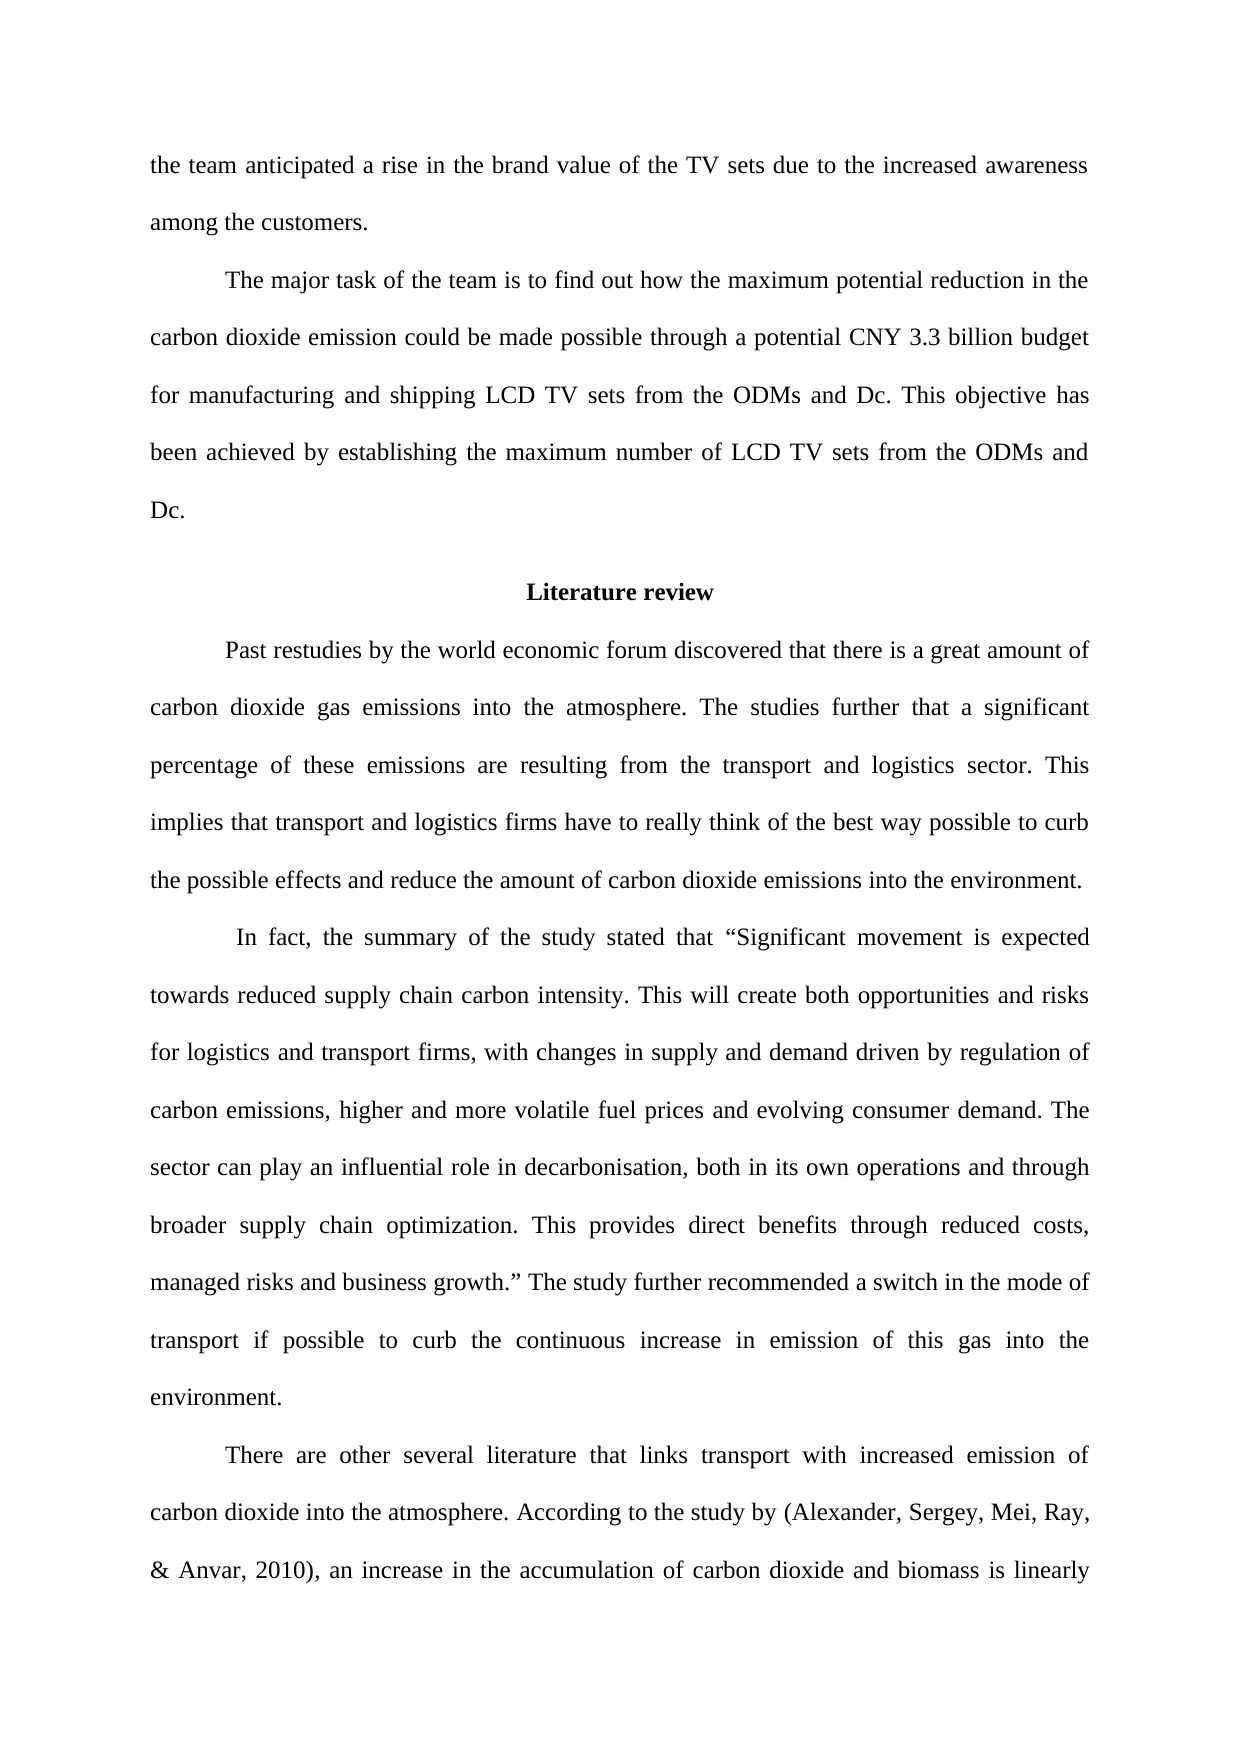
Introduction
This study is based on a case study of DHL, a transport and logistics firm. The supply
chain team has undertaken a mission to embrace the go green environmental protection
program. In order to achieve this mission, the company has undertaken to improve the
efficiency of carbon dioxide across the global operations by 30% compared to the 2013
baseline. The aim is to ensure that there is no excess or limited emission of carbon dioxide
into the environment.
The supply chain team has undertaken to achieve the objective of go green initiative
by re- evaluating the supply of their electronic products, specifically LCD TV sets (LCD23
and LCD 42 TV SETS). The major objective of this report is to help the supply team in
determining the optimal number of LCD TV sets produced by different sub-contractors. The
company had a total of seven sub-contractors each of which were expected to produce
different number of LCD TV sets.
The company is further interested in determining the optimal means of transport that
would support the go green initiative that they hand undertaken. The company had different
transport means which they could use depending on the availability and efficiency. The
transport modes available include regular air, air express, road, road LTL (less than
truckload), road network, rail and water. Shipping times vary from 2 to 10 days depending on
the distance and the mode of transport used.
Other cost that are anticipated in the transport of the TV sets are the government
incentives and legislations to reduce emission of carbon dioxide into the atmosphere. Further,
⊘ This is a preview!⊘
Do you want full access?
Subscribe today to unlock all pages.
Trusted by 1+ million students worldwide
the team anticipated a rise in the brand value of the TV sets due to the increased awareness
among the customers.
The major task of the team is to find out how the maximum potential reduction in the
carbon dioxide emission could be made possible through a potential CNY 3.3 billion budget
for manufacturing and shipping LCD TV sets from the ODMs and Dc. This objective has
been achieved by establishing the maximum number of LCD TV sets from the ODMs and
Dc.
Literature review
Past restudies by the world economic forum discovered that there is a great amount of
carbon dioxide gas emissions into the atmosphere. The studies further that a significant
percentage of these emissions are resulting from the transport and logistics sector. This
implies that transport and logistics firms have to really think of the best way possible to curb
the possible effects and reduce the amount of carbon dioxide emissions into the environment.
In fact, the summary of the study stated that “Significant movement is expected
towards reduced supply chain carbon intensity. This will create both opportunities and risks
for logistics and transport firms, with changes in supply and demand driven by regulation of
carbon emissions, higher and more volatile fuel prices and evolving consumer demand. The
sector can play an influential role in decarbonisation, both in its own operations and through
broader supply chain optimization. This provides direct benefits through reduced costs,
managed risks and business growth.” The study further recommended a switch in the mode of
transport if possible to curb the continuous increase in emission of this gas into the
environment.
There are other several literature that links transport with increased emission of
carbon dioxide into the atmosphere. According to the study by (Alexander, Sergey, Mei, Ray,
& Anvar, 2010), an increase in the accumulation of carbon dioxide and biomass is linearly
Paraphrase This Document
Need a fresh take? Get an instant paraphrase of this document with our AI Paraphraser
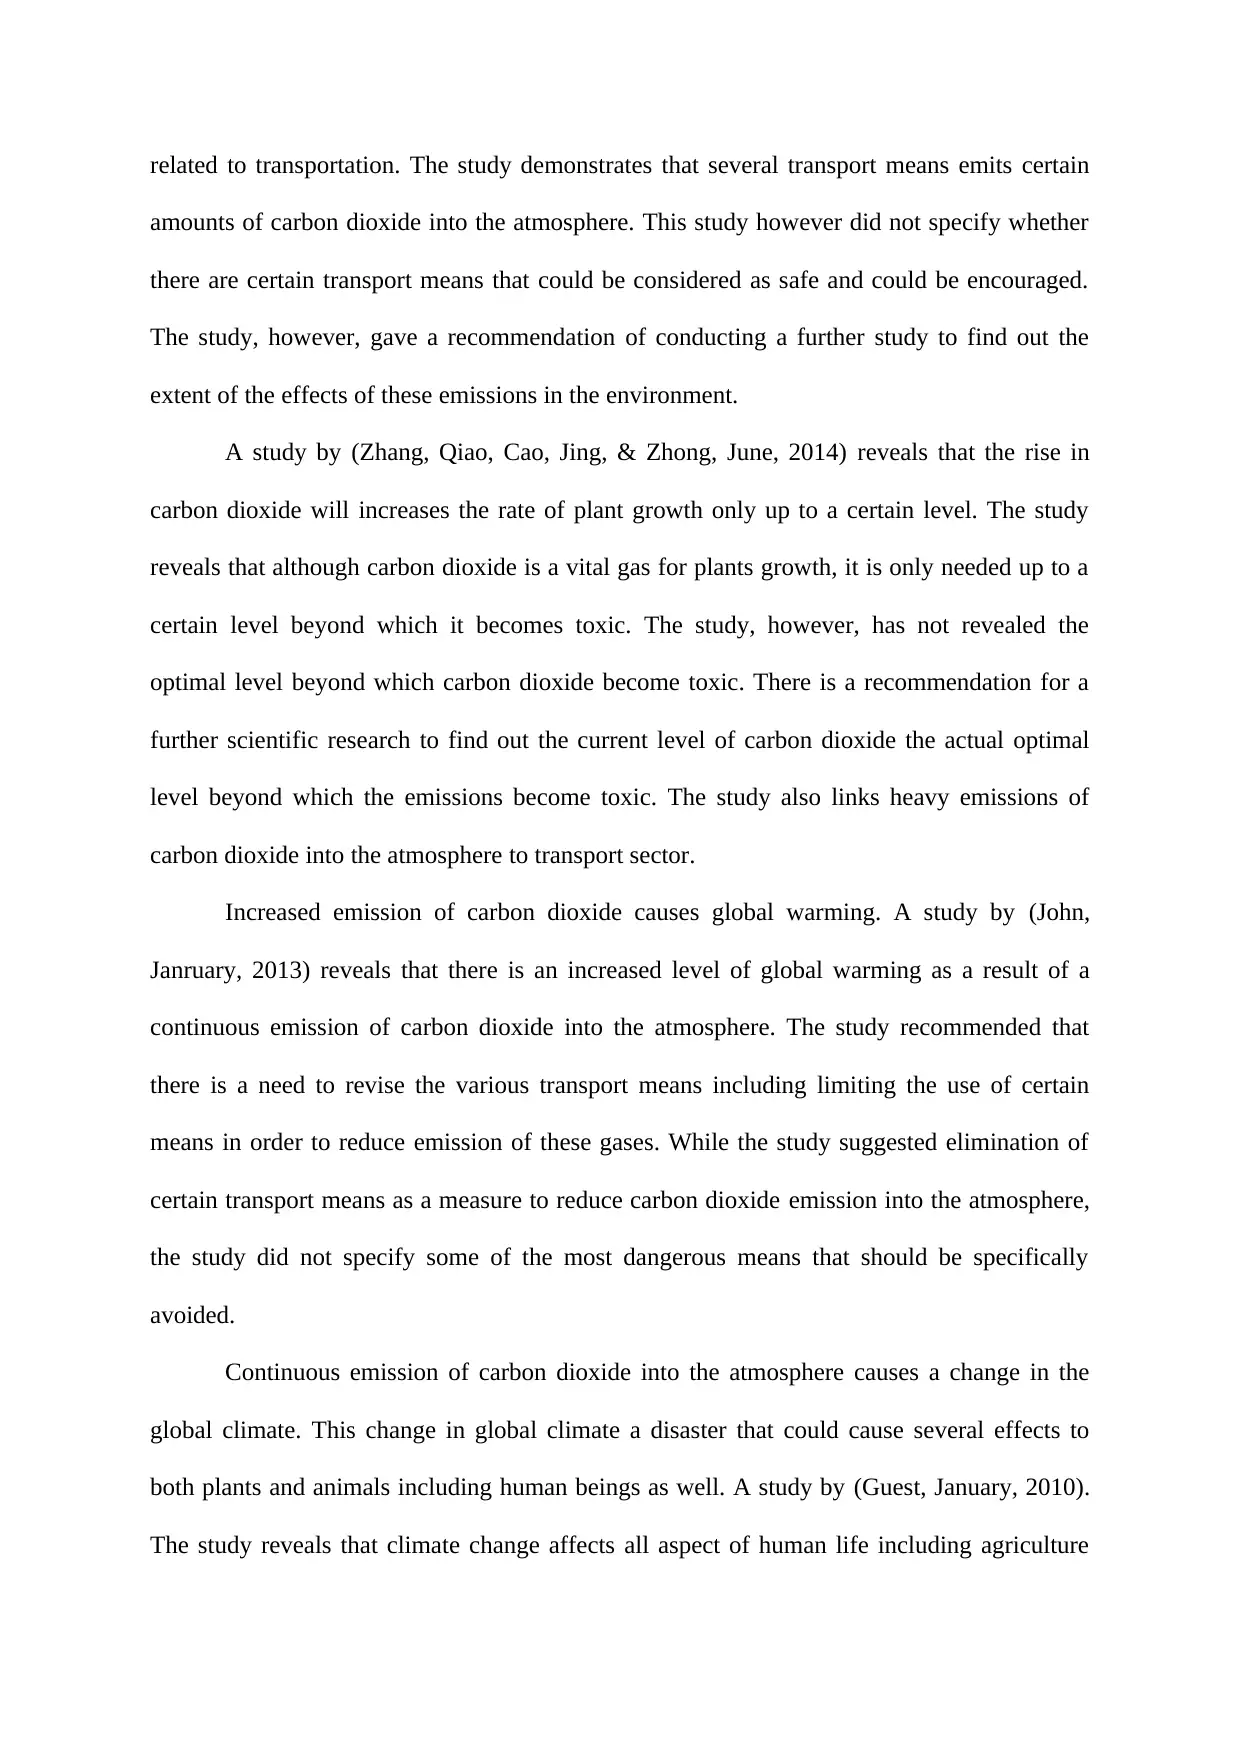
related to transportation. The study demonstrates that several transport means emits certain
amounts of carbon dioxide into the atmosphere. This study however did not specify whether
there are certain transport means that could be considered as safe and could be encouraged.
The study, however, gave a recommendation of conducting a further study to find out the
extent of the effects of these emissions in the environment.
A study by (Zhang, Qiao, Cao, Jing, & Zhong, June, 2014) reveals that the rise in
carbon dioxide will increases the rate of plant growth only up to a certain level. The study
reveals that although carbon dioxide is a vital gas for plants growth, it is only needed up to a
certain level beyond which it becomes toxic. The study, however, has not revealed the
optimal level beyond which carbon dioxide become toxic. There is a recommendation for a
further scientific research to find out the current level of carbon dioxide the actual optimal
level beyond which the emissions become toxic. The study also links heavy emissions of
carbon dioxide into the atmosphere to transport sector.
Increased emission of carbon dioxide causes global warming. A study by (John,
Janruary, 2013) reveals that there is an increased level of global warming as a result of a
continuous emission of carbon dioxide into the atmosphere. The study recommended that
there is a need to revise the various transport means including limiting the use of certain
means in order to reduce emission of these gases. While the study suggested elimination of
certain transport means as a measure to reduce carbon dioxide emission into the atmosphere,
the study did not specify some of the most dangerous means that should be specifically
avoided.
Continuous emission of carbon dioxide into the atmosphere causes a change in the
global climate. This change in global climate a disaster that could cause several effects to
both plants and animals including human beings as well. A study by (Guest, January, 2010).
The study reveals that climate change affects all aspect of human life including agriculture
which is the most important sector of the economy. The study, however, did not identify the
dangerous sources of carbon dioxide that could be easily avoided.
Carbon dioxide causes a great threat to the fishing industry. A study by (Sun, et al.,
December, 2014) reveals that carbon dioxide emissions is the most dangerous threat to
aquatic life. This implies that fish will deficiency in their food if the emissions continue in a
great extent. The study by (Wang, et al., March, 2016) further reveals that excess emission of
carbon dioxide into the water may cause death of certain important water animals. The study
by (Sun, et al., December, 2014) specifically identifies water transport as the major cause of
excess carbon dioxide released into the water bodies. The study recommends a further
research on how to reduce emissions of carbon dioxide gas into the water by closely
monitoring the vessels used as a means of transport.
Excess release of carbon dioxide into the atmosphere may lead to unpredictability of
rainfall and rainfall distributions. A study by (Yun, 2011) specifically identifies that excess
release of carbon dioxide into the atmosphere may eventually lead to changes in amounts of
precipitations and the distributions of precipitations that so occur. The study reveals that this
is as a result of climate change. The study further reveals that one of the major causes climate
change as a result of excess emission of carbon dioxide into the atmosphere is the
uncontrolled means of transport. The study recommends a there need to be more insightful
study done on the major transport means and a clear evaluation of the amounts of carbon that
they emit into the environment. This is an argument that has been backed up by the study by
(John, Janruary, 2013).
Methodology
This section outlines the description of the mathematical approach used to solve the
problem in this report. Since the problem at hand is an optimization problem, the method
adopted for solving the problem is the optimization method by linear programming. Linear
⊘ This is a preview!⊘
Do you want full access?
Subscribe today to unlock all pages.
Trusted by 1+ million students worldwide
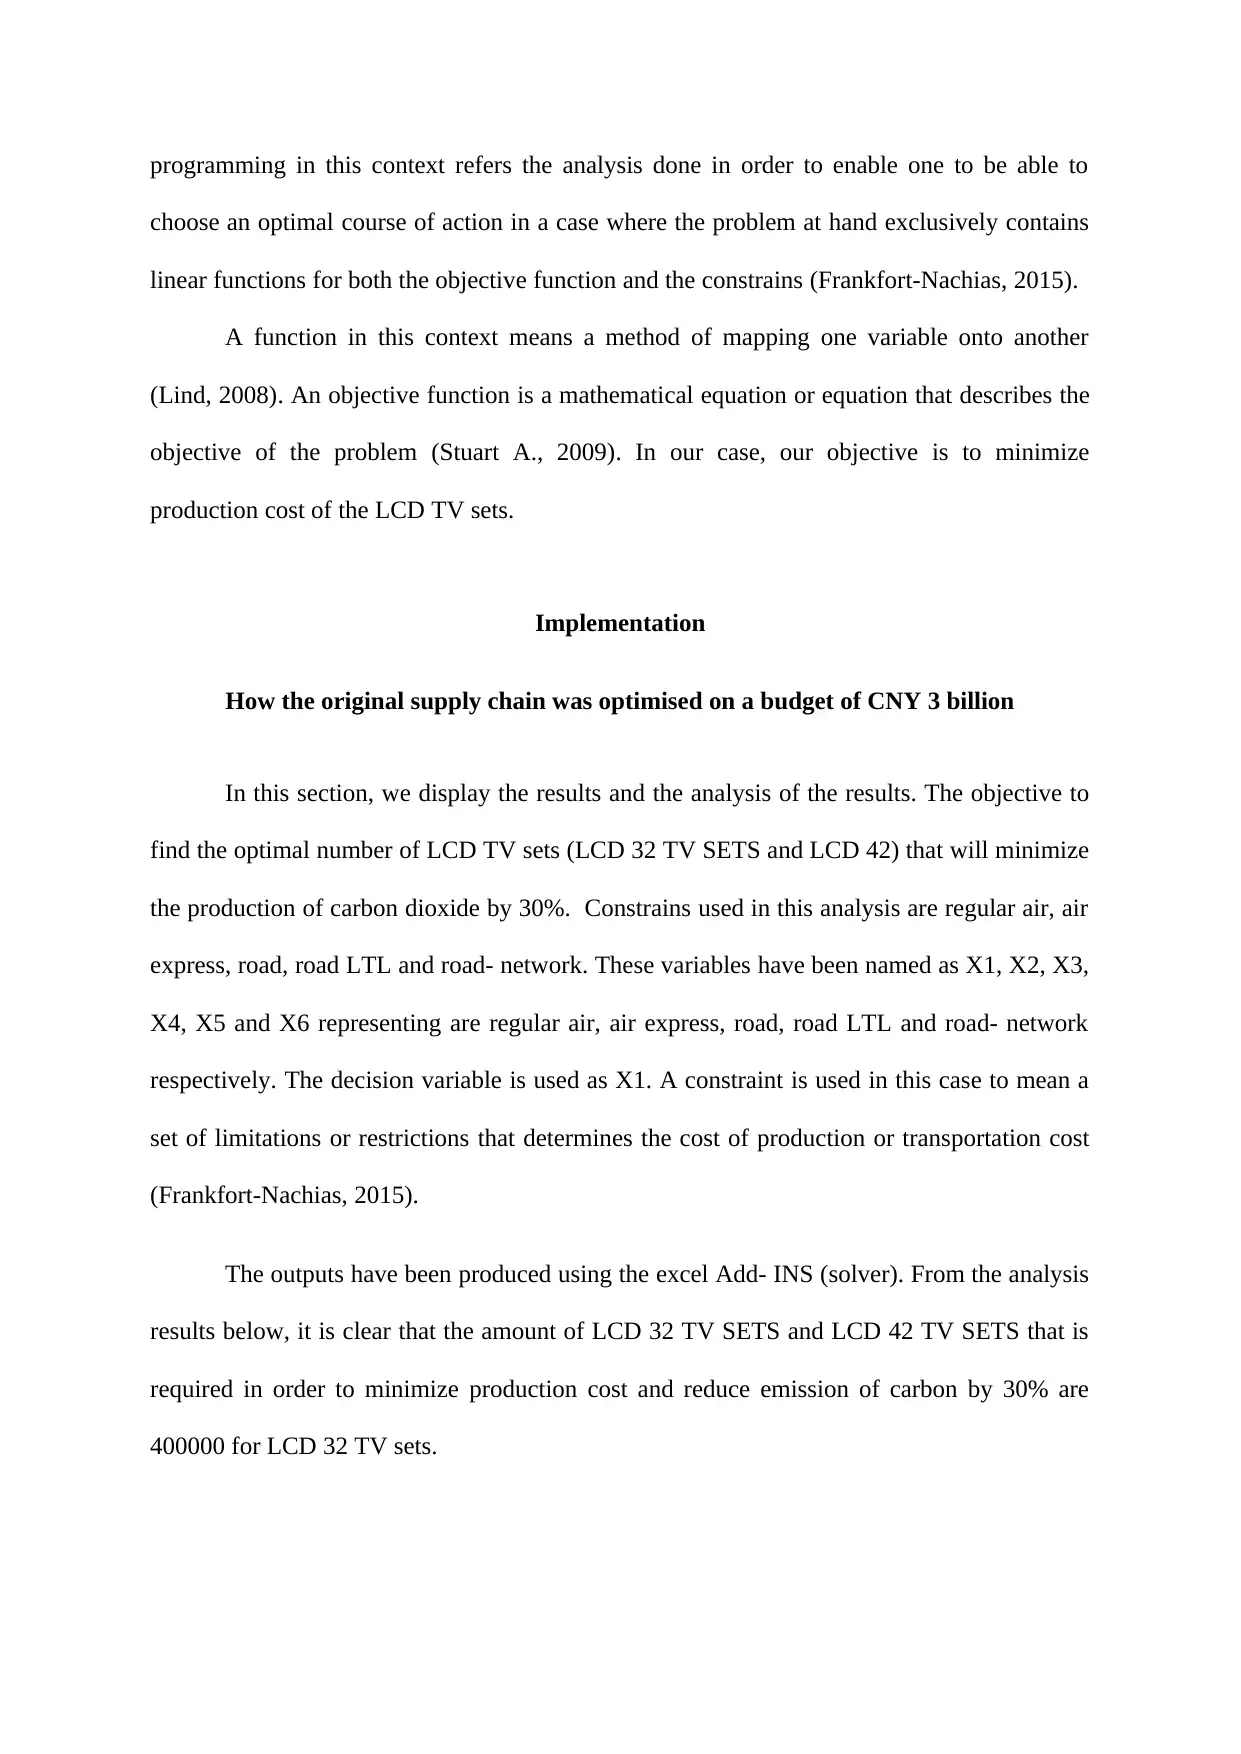
programming in this context refers the analysis done in order to enable one to be able to
choose an optimal course of action in a case where the problem at hand exclusively contains
linear functions for both the objective function and the constrains (Frankfort-Nachias, 2015).
A function in this context means a method of mapping one variable onto another
(Lind, 2008). An objective function is a mathematical equation or equation that describes the
objective of the problem (Stuart A., 2009). In our case, our objective is to minimize
production cost of the LCD TV sets.
Implementation
How the original supply chain was optimised on a budget of CNY 3 billion
In this section, we display the results and the analysis of the results. The objective to
find the optimal number of LCD TV sets (LCD 32 TV SETS and LCD 42) that will minimize
the production of carbon dioxide by 30%. Constrains used in this analysis are regular air, air
express, road, road LTL and road- network. These variables have been named as X1, X2, X3,
X4, X5 and X6 representing are regular air, air express, road, road LTL and road- network
respectively. The decision variable is used as X1. A constraint is used in this case to mean a
set of limitations or restrictions that determines the cost of production or transportation cost
(Frankfort-Nachias, 2015).
The outputs have been produced using the excel Add- INS (solver). From the analysis
results below, it is clear that the amount of LCD 32 TV SETS and LCD 42 TV SETS that is
required in order to minimize production cost and reduce emission of carbon by 30% are
400000 for LCD 32 TV sets.
Paraphrase This Document
Need a fresh take? Get an instant paraphrase of this document with our AI Paraphraser
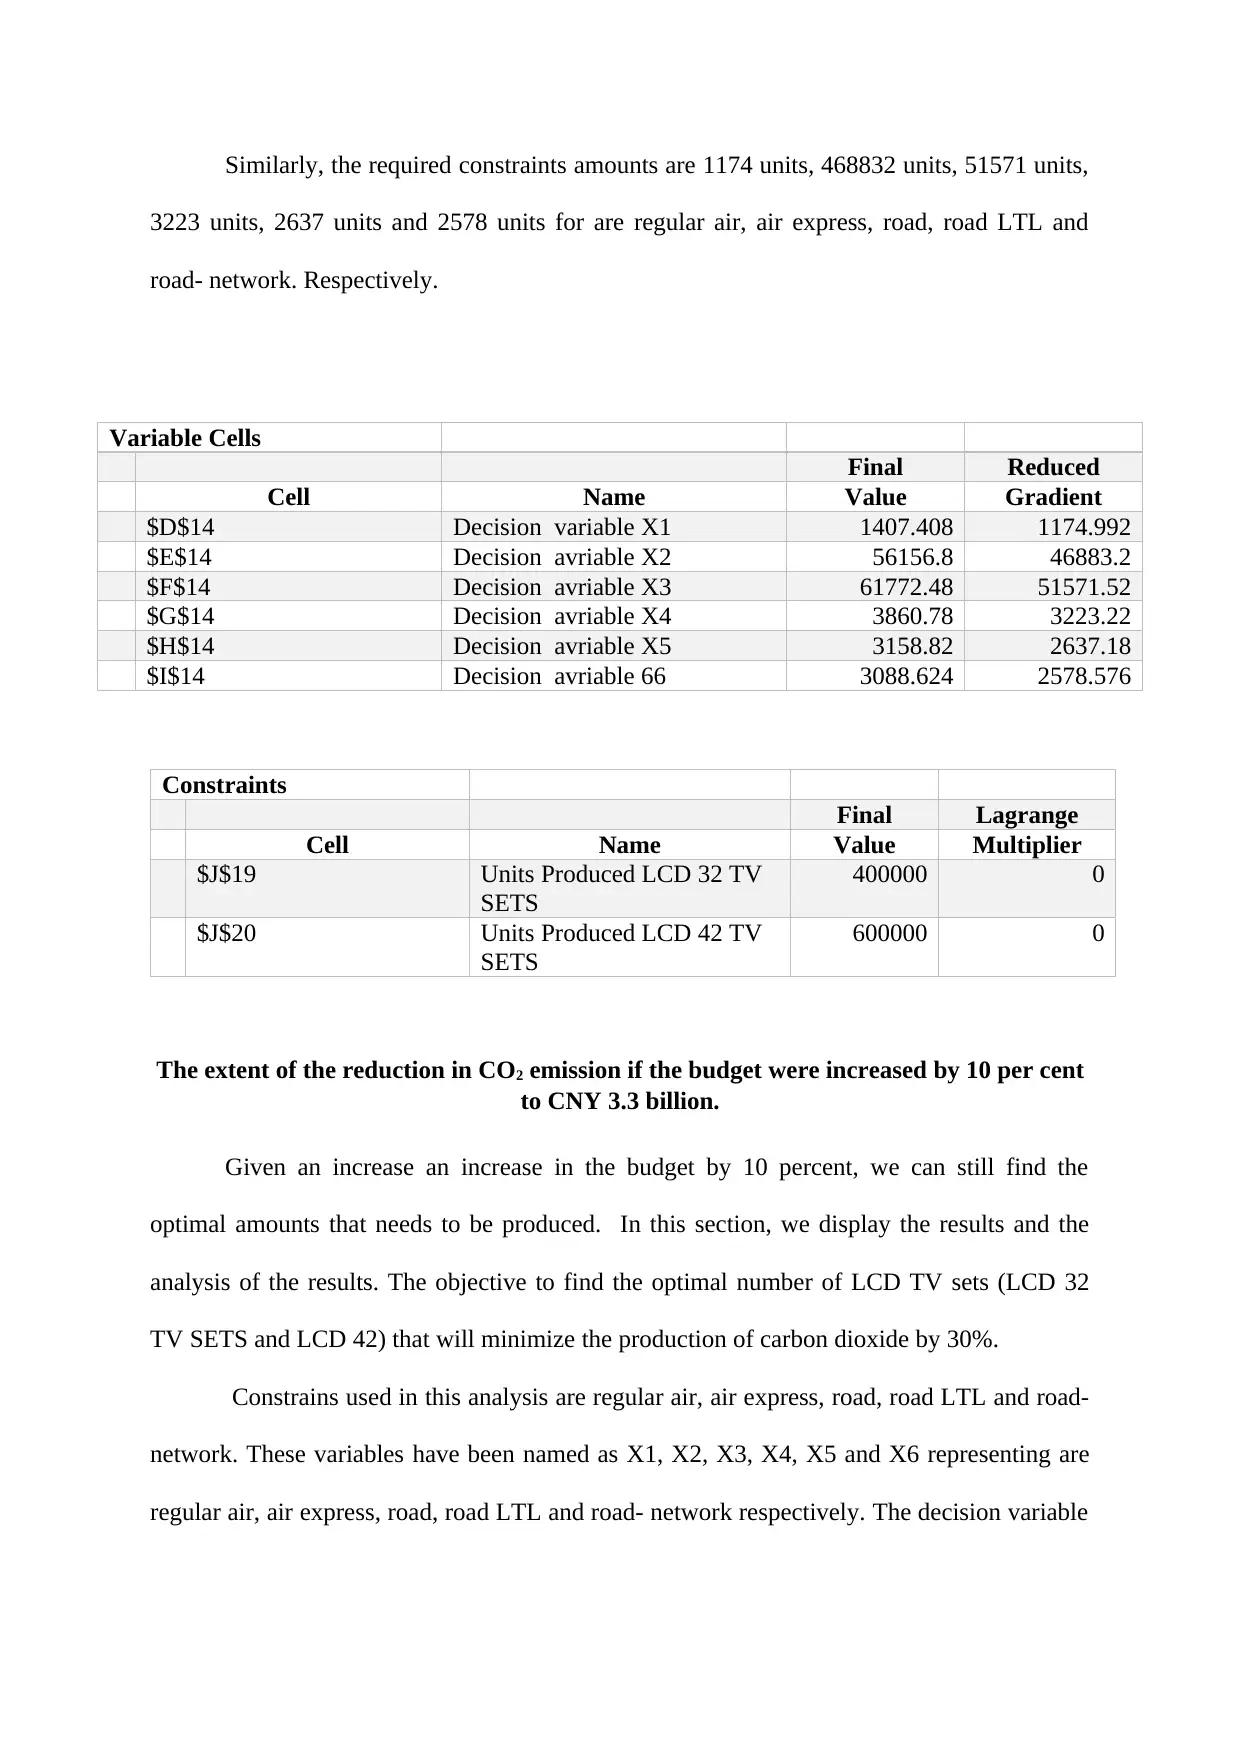
Similarly, the required constraints amounts are 1174 units, 468832 units, 51571 units,
3223 units, 2637 units and 2578 units for are regular air, air express, road, road LTL and
road- network. Respectively.
Variable Cells
Final Reduced
Cell Name Value Gradient
$D$14 Decision variable X1 1407.408 1174.992
$E$14 Decision avriable X2 56156.8 46883.2
$F$14 Decision avriable X3 61772.48 51571.52
$G$14 Decision avriable X4 3860.78 3223.22
$H$14 Decision avriable X5 3158.82 2637.18
$I$14 Decision avriable 66 3088.624 2578.576
Constraints
Final Lagrange
Cell Name Value Multiplier
$J$19 Units Produced LCD 32 TV
SETS
400000 0
$J$20 Units Produced LCD 42 TV
SETS
600000 0
The extent of the reduction in CO2 emission if the budget were increased by 10 per cent
to CNY 3.3 billion.
Given an increase an increase in the budget by 10 percent, we can still find the
optimal amounts that needs to be produced. In this section, we display the results and the
analysis of the results. The objective to find the optimal number of LCD TV sets (LCD 32
TV SETS and LCD 42) that will minimize the production of carbon dioxide by 30%.
Constrains used in this analysis are regular air, air express, road, road LTL and road-
network. These variables have been named as X1, X2, X3, X4, X5 and X6 representing are
regular air, air express, road, road LTL and road- network respectively. The decision variable
is used as X1. A constraint is used in this case to mean a set of limitations or restrictions that
determines the cost of production or transportation cost (Frankfort-Nachias, 2015).
The outputs have been produced using the excel Add- INS (solver).
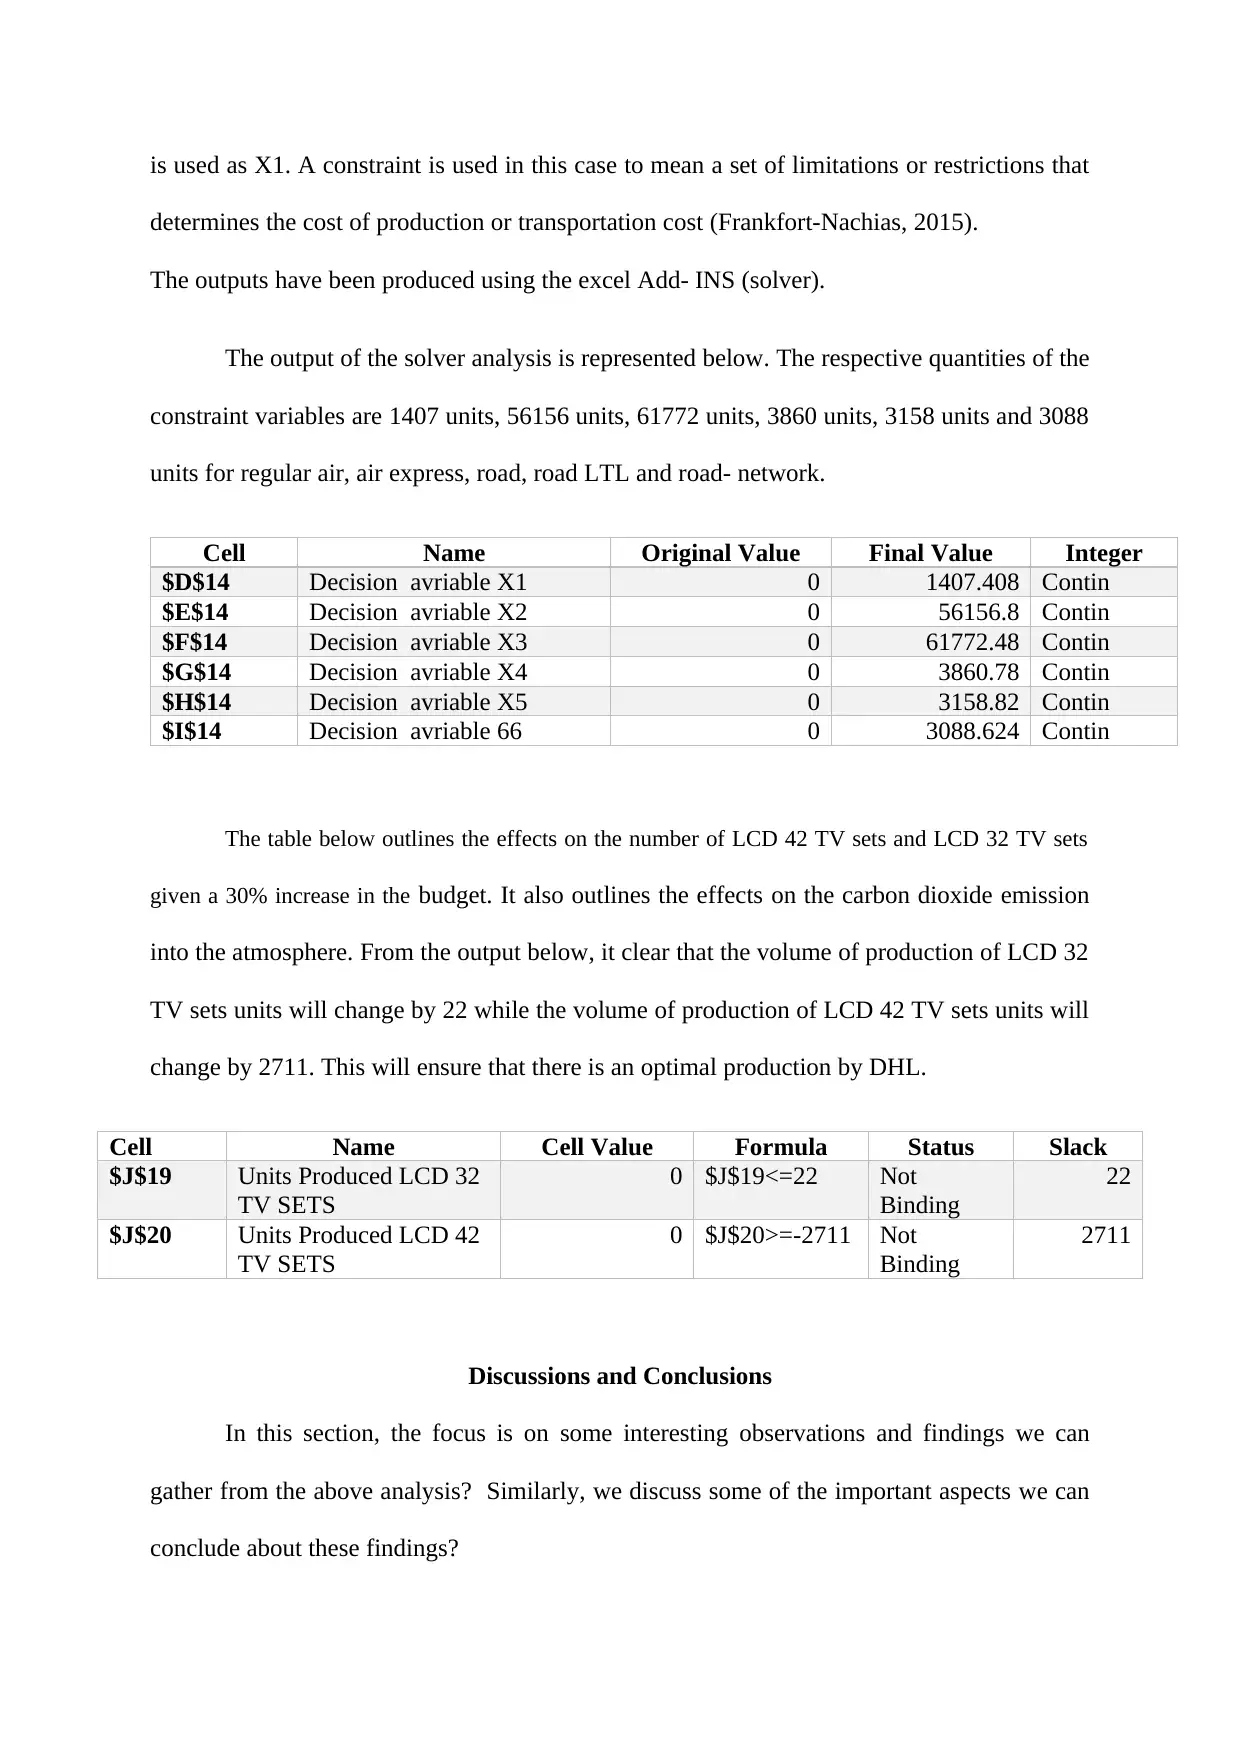
The output of the solver analysis is represented below. The respective quantities of the
constraint variables are 1407 units, 56156 units, 61772 units, 3860 units, 3158 units and 3088
units for regular air, air express, road, road LTL and road- network.
Cell Name Original Value Final Value Integer
$D$14 Decision avriable X1 0 1407.408 Contin
$E$14 Decision avriable X2 0 56156.8 Contin
$F$14 Decision avriable X3 0 61772.48 Contin
$G$14 Decision avriable X4 0 3860.78 Contin
$H$14 Decision avriable X5 0 3158.82 Contin
$I$14 Decision avriable 66 0 3088.624 Contin
The table below outlines the effects on the number of LCD 42 TV sets and LCD 32 TV sets
given a 30% increase in the budget. It also outlines the effects on the carbon dioxide emission
into the atmosphere. From the output below, it clear that the volume of production of LCD 32
TV sets units will change by 22 while the volume of production of LCD 42 TV sets units will
change by 2711. This will ensure that there is an optimal production by DHL.
Cell Name Cell Value Formula Status Slack
$J$19 Units Produced LCD 32
TV SETS
0 $J$19<=22 Not
Binding
22
$J$20 Units Produced LCD 42
TV SETS
0 $J$20>=-2711 Not
Binding
2711
Discussions and Conclusions
In this section, the focus is on some interesting observations and findings we can
gather from the above analysis? Similarly, we discuss some of the important aspects we can
conclude about these findings?
determines the cost of production or transportation cost (Frankfort-Nachias, 2015).
The outputs have been produced using the excel Add- INS (solver).
The output of the solver analysis is represented below. The respective quantities of the
constraint variables are 1407 units, 56156 units, 61772 units, 3860 units, 3158 units and 3088
units for regular air, air express, road, road LTL and road- network.
Cell Name Original Value Final Value Integer
$D$14 Decision avriable X1 0 1407.408 Contin
$E$14 Decision avriable X2 0 56156.8 Contin
$F$14 Decision avriable X3 0 61772.48 Contin
$G$14 Decision avriable X4 0 3860.78 Contin
$H$14 Decision avriable X5 0 3158.82 Contin
$I$14 Decision avriable 66 0 3088.624 Contin
The table below outlines the effects on the number of LCD 42 TV sets and LCD 32 TV sets
given a 30% increase in the budget. It also outlines the effects on the carbon dioxide emission
into the atmosphere. From the output below, it clear that the volume of production of LCD 32
TV sets units will change by 22 while the volume of production of LCD 42 TV sets units will
change by 2711. This will ensure that there is an optimal production by DHL.
Cell Name Cell Value Formula Status Slack
$J$19 Units Produced LCD 32
TV SETS
0 $J$19<=22 Not
Binding
22
$J$20 Units Produced LCD 42
TV SETS
0 $J$20>=-2711 Not
Binding
2711
Discussions and Conclusions
In this section, the focus is on some interesting observations and findings we can
gather from the above analysis? Similarly, we discuss some of the important aspects we can
conclude about these findings?
⊘ This is a preview!⊘
Do you want full access?
Subscribe today to unlock all pages.
Trusted by 1+ million students worldwide
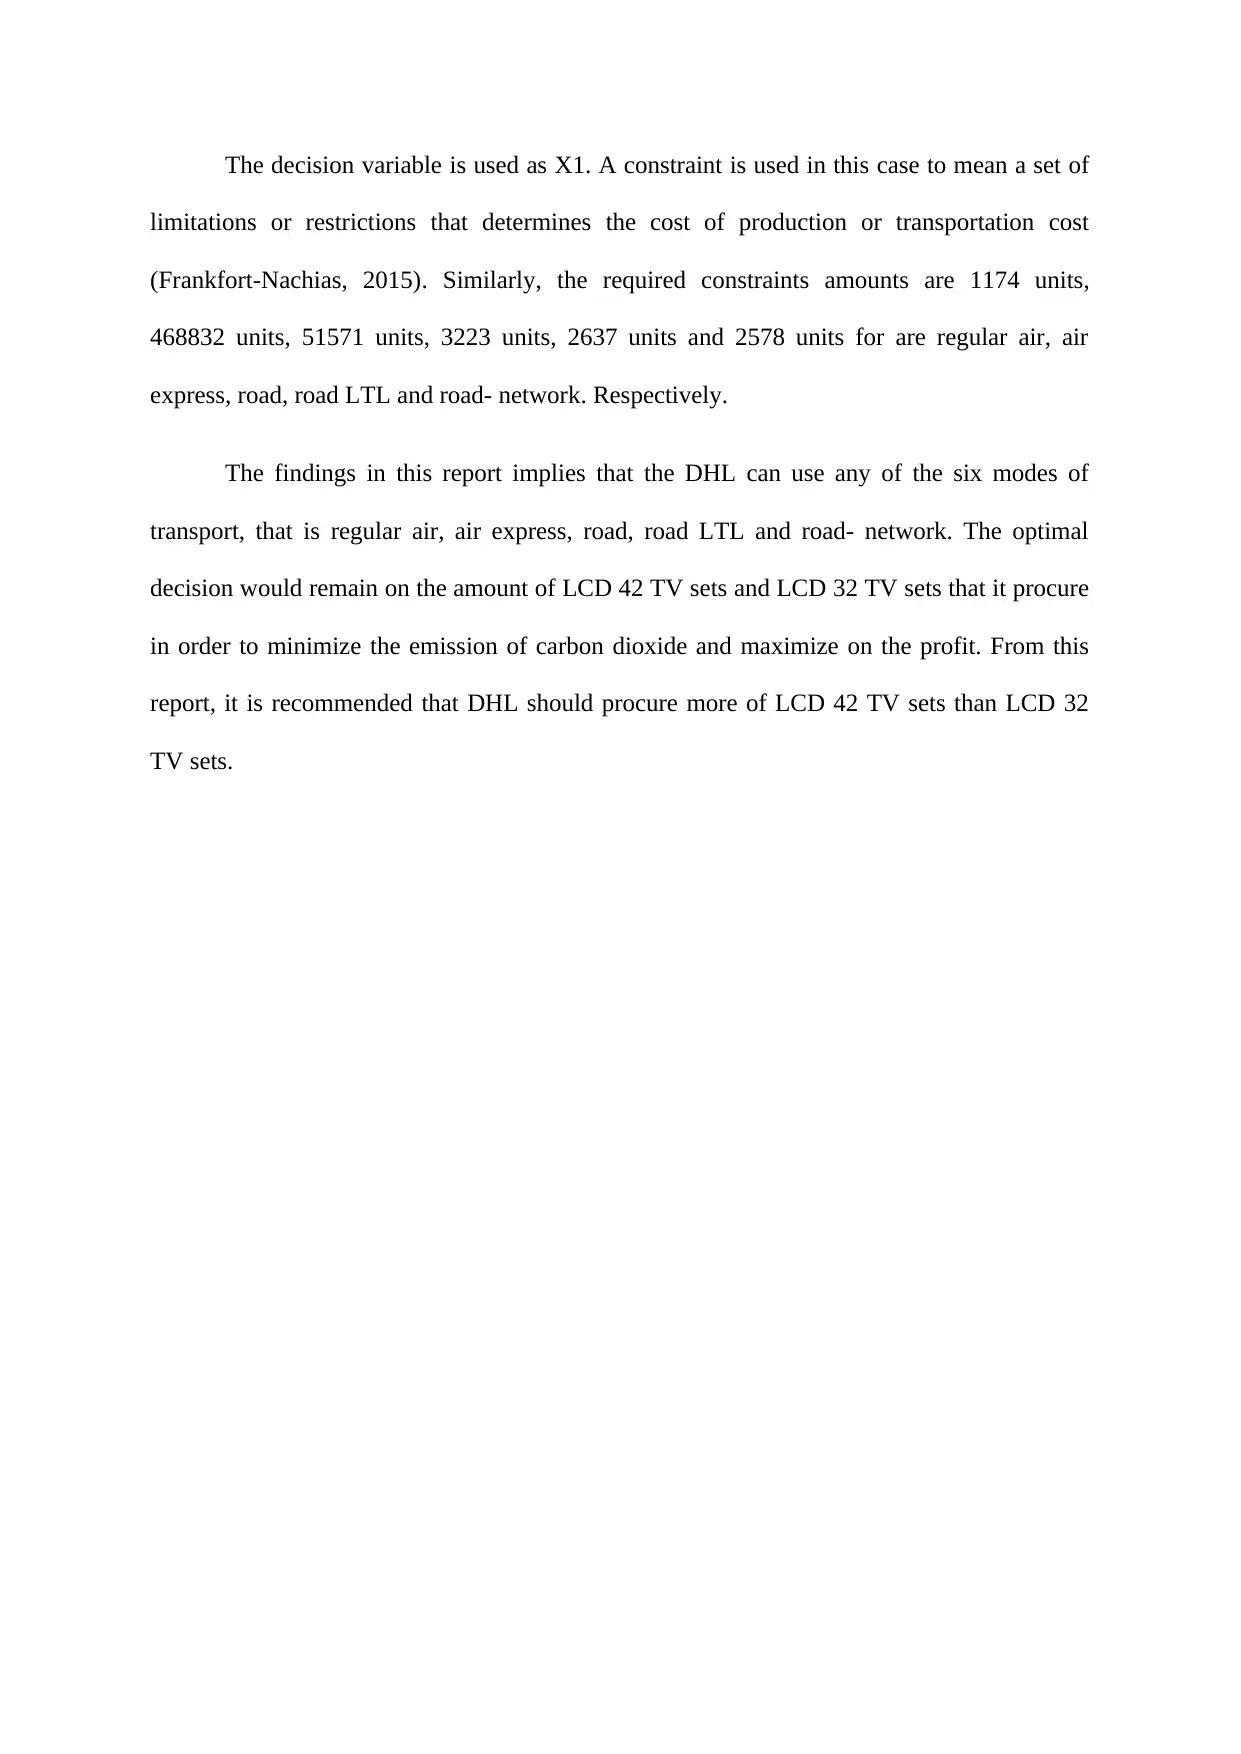
The decision variable is used as X1. A constraint is used in this case to mean a set of
limitations or restrictions that determines the cost of production or transportation cost
(Frankfort-Nachias, 2015). Similarly, the required constraints amounts are 1174 units,
468832 units, 51571 units, 3223 units, 2637 units and 2578 units for are regular air, air
express, road, road LTL and road- network. Respectively.
The findings in this report implies that the DHL can use any of the six modes of
transport, that is regular air, air express, road, road LTL and road- network. The optimal
decision would remain on the amount of LCD 42 TV sets and LCD 32 TV sets that it procure
in order to minimize the emission of carbon dioxide and maximize on the profit. From this
report, it is recommended that DHL should procure more of LCD 42 TV sets than LCD 32
TV sets.
Paraphrase This Document
Need a fresh take? Get an instant paraphrase of this document with our AI Paraphraser
References
Alexander, A. K., Sergey, B. L., Mei, Z., Ray, H. B., & Anvar, A. Z. (2010). Electron field
emission from transparent multiwalled carbon nanotube sheets for inverted field
emission displays. 6.
Frankfort-Nachias, C. &.-G. (2015). Social Statistics for a diverse society. Thousand Oaks,
CA: Sage Publications.
Guest, R. (January, 2010). Global Demographic Change, Carbon Emissions, the Optimal
Carbon Price and Carbon Abatement. Global Economy Journal, 19.
Lind, D. A. (2008). Statistical Techniques in Business & . Boston.: McGraw-Hill Irwin.
Settlement Structures and Carbon Emissions in Germany: The Effects of Social and Physical
Concentration on Carbon Emissions in Rural and Urban Residential Areas. (Janruary,
2013). Environmental Policy , 17.
Stuart A., O. K. (2009). Kendall’s Advanced Theory of Statistics: Volume 2A- Classical
Inference & the linear Model.
Sun, Licheng, Wang, Qunwei, Zhou, Peng, . . . Faxin. (December, 2014). Effects of carbon
emission transfer on economic spillover and carbon emission reduction in China.
Journal of Cleaner Production, 11.
Wang, Yang, Xing, Xing, Zhenyu, Zhao, . . . Ke. (March, 2016). Are emissions of black
carbon from gasoline vehicles overestimated? Real-time, in situ measurement of black
carbon emission factors. Science of The Total Environment, 7.
Yun, Z. (2011). Research on International Carbon Emissions Trading and Optimal Exports
Scale of China Carbon Emissions. 7.
Zhang, Qiao, L., Cao, Jing, W., & Zhong, S. (June, 2014). Economic Consequences of
Carbon Tax and Carbon Emission Trading Scheme in Intensive Carbon Emission
Enterprises. Environmental Science Journal, 5.
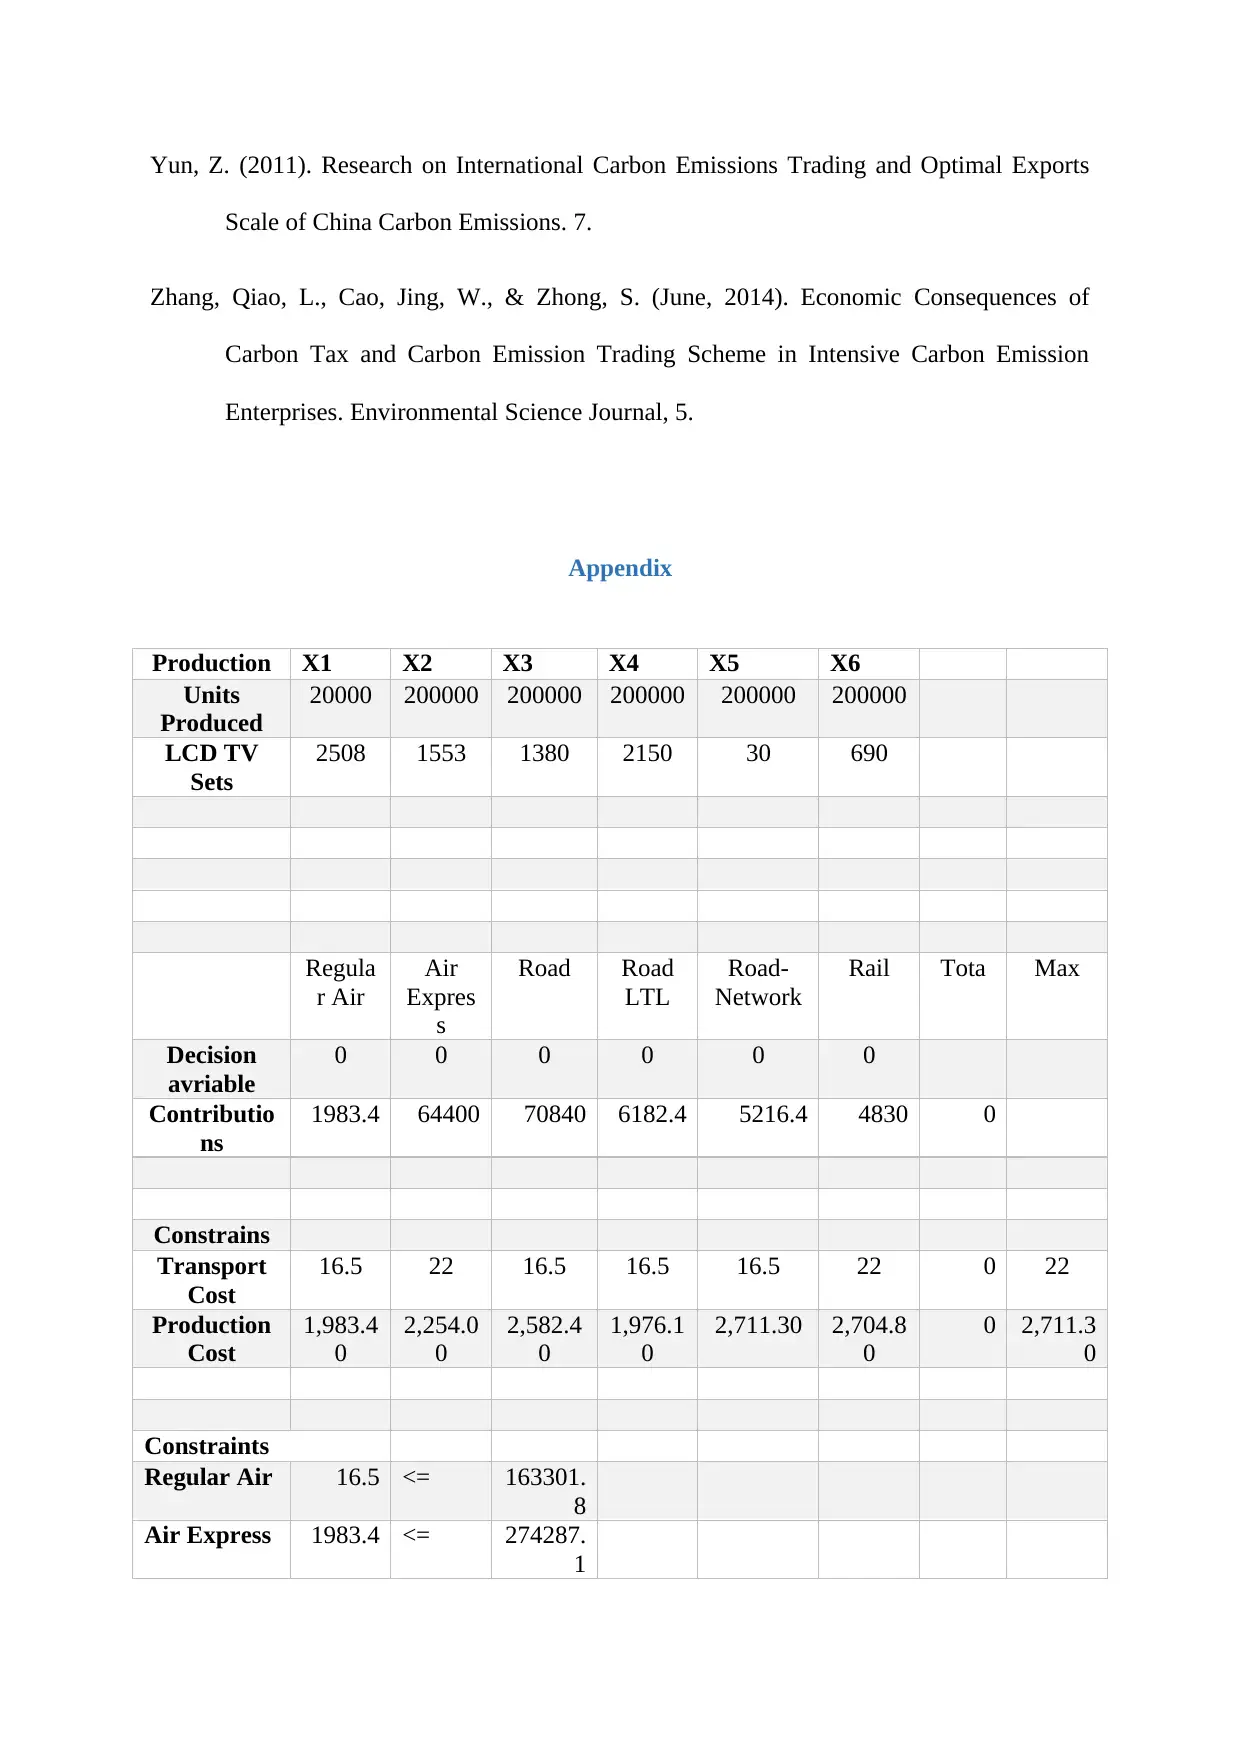
Appendix
Production X1 X2 X3 X4 X5 X6
Units
Produced
20000 200000 200000 200000 200000 200000
LCD TV
Sets
2508 1553 1380 2150 30 690
Regula
r Air
Air
Expres
s
Road Road
LTL
Road-
Network
Rail Tota Max
Decision
avriable
0 0 0 0 0 0
Contributio
ns
1983.4 64400 70840 6182.4 5216.4 4830 0
Constrains
Transport
Cost
16.5 22 16.5 16.5 16.5 22 0 22
Production
Cost
1,983.4
0
2,254.0
0
2,582.4
0
1,976.1
0
2,711.30 2,704.8
0
0 2,711.3
0
Constraints
Regular Air 16.5 <= 163301.
8
Air Express 1983.4 <= 274287.
1
Scale of China Carbon Emissions. 7.
Zhang, Qiao, L., Cao, Jing, W., & Zhong, S. (June, 2014). Economic Consequences of
Carbon Tax and Carbon Emission Trading Scheme in Intensive Carbon Emission
Enterprises. Environmental Science Journal, 5.
Appendix
Production X1 X2 X3 X4 X5 X6
Units
Produced
20000 200000 200000 200000 200000 200000
LCD TV
Sets
2508 1553 1380 2150 30 690
Regula
r Air
Air
Expres
s
Road Road
LTL
Road-
Network
Rail Tota Max
Decision
avriable
0 0 0 0 0 0
Contributio
ns
1983.4 64400 70840 6182.4 5216.4 4830 0
Constrains
Transport
Cost
16.5 22 16.5 16.5 16.5 22 0 22
Production
Cost
1,983.4
0
2,254.0
0
2,582.4
0
1,976.1
0
2,711.30 2,704.8
0
0 2,711.3
0
Constraints
Regular Air 16.5 <= 163301.
8
Air Express 1983.4 <= 274287.
1
⊘ This is a preview!⊘
Do you want full access?
Subscribe today to unlock all pages.
Trusted by 1+ million students worldwide
1 out of 14
Your All-in-One AI-Powered Toolkit for Academic Success.
+13062052269
info@desklib.com
Available 24*7 on WhatsApp / Email
![[object Object]](/_next/static/media/star-bottom.7253800d.svg)
Unlock your academic potential
Copyright © 2020–2026 A2Z Services. All Rights Reserved. Developed and managed by ZUCOL.