Diagnostic Radiography: CT, Mammography, and Disease Screening Report
VerifiedAdded on 2020/05/28
|20
|4569
|318
Report
AI Summary
This report delves into the realm of diagnostic radiography, primarily focusing on Computed Tomography (CT) scans and mammography. Section A explores the principles and components of CT scanning, including its historical development, the function of key components like the gantry and detectors, and the underlying principles of image reconstruction based on X-ray attenuation. It also details the process of data acquisition, image reconstruction, and display. Section B then discusses the applications of CT scans in screening for various medical conditions, such as coronary heart disease, lung cancer, and colorectal cancer, highlighting the role of CT in detecting calcifications and tumors. The report also includes a discussion of mammography, detailing its use in breast cancer detection, the different types of mammography techniques (digital and 3D), and the BI-RADS system used for interpreting mammograms. The assignment is a comprehensive overview of the diagnostic capabilities of these imaging techniques.

Running head: DIAGNOSTIC RADIOGRAPHY
DIAGNOSTIC RADIOGRAPHY
Name of the Student
Name of the University
Author Notes
DIAGNOSTIC RADIOGRAPHY
Name of the Student
Name of the University
Author Notes
Paraphrase This Document
Need a fresh take? Get an instant paraphrase of this document with our AI Paraphraser
1DIAGNOSTIC RADIOGRAPHY
Table of Contents
Section A.........................................................................................................................................2
Answer 1 a...................................................................................................................................2
Answer 1 b...................................................................................................................................5
Section B..........................................................................................................................................7
Answer 5......................................................................................................................................7
Answer 6 a.................................................................................................................................10
Answer 6 b.................................................................................................................................10
Answer 6 c.................................................................................................................................11
Answer 6 d.................................................................................................................................11
Reference List................................................................................................................................14
2DIAGNOSTIC RADIOGRAPHY
Section A
Answer 1 a
Computed Tomography (CT) scanning is also designated computerized axial tomography
(CAT) scanning. Tomography is a culmination of 2 Greek words, ‘tomos’, which means slice
and ‘graphia’, which means image (Faraj 2013). It was invented by Godfrey Hounsfield of EMI
laboratories in 1972 and also by Allan Cormack of Tufts university in Massachusetts. Initially
the system was used for head imaging but in 1976, whole body imaging was available.
Computed Tomography generates cross-sectional images with the help of X- rays and computers
(Smith 2016). This diagnostic imaging technique uses X-rays to produce cross-sectional images
of the human body. The resulting attenuation co-efficient of the X-rays are used to reconstruct
the cross-sections. The first manufactured CT scanner was not that much effective in terms of
speed and resolution. The first CT scanner developed by Hounsfield took days to acquire raw
data and reconstruct image from it. However, the scanning time became faster with time,
research and development. Improvement in speed and resolution can be understood from the fact
that current CT scanner can collect data in 350 m (Seeram 2015).
The important component of the CT includes Gantry, X-ray tube, control console and the
gas filled detector. The gantry is the largest unit of the scanner that contains x-ray tube, gas filled
detectors, patient support couch and mechanical support components. Hence, the gantry contains
all the components that are necessary to produce a CT image. The x-ray tube and detectors are
placed opposite to each other and gantry is the main centripetal forces that help in the rotation of
the x-ray tube and the detectors. Both the x-ray tube and detectors helps in generation and
detection of x-rays The factor that has increased the temporal resolution and imaging speed of
⊘ This is a preview!⊘
Do you want full access?
Subscribe today to unlock all pages.
Trusted by 1+ million students worldwide
3DIAGNOSTIC RADIOGRAPHY
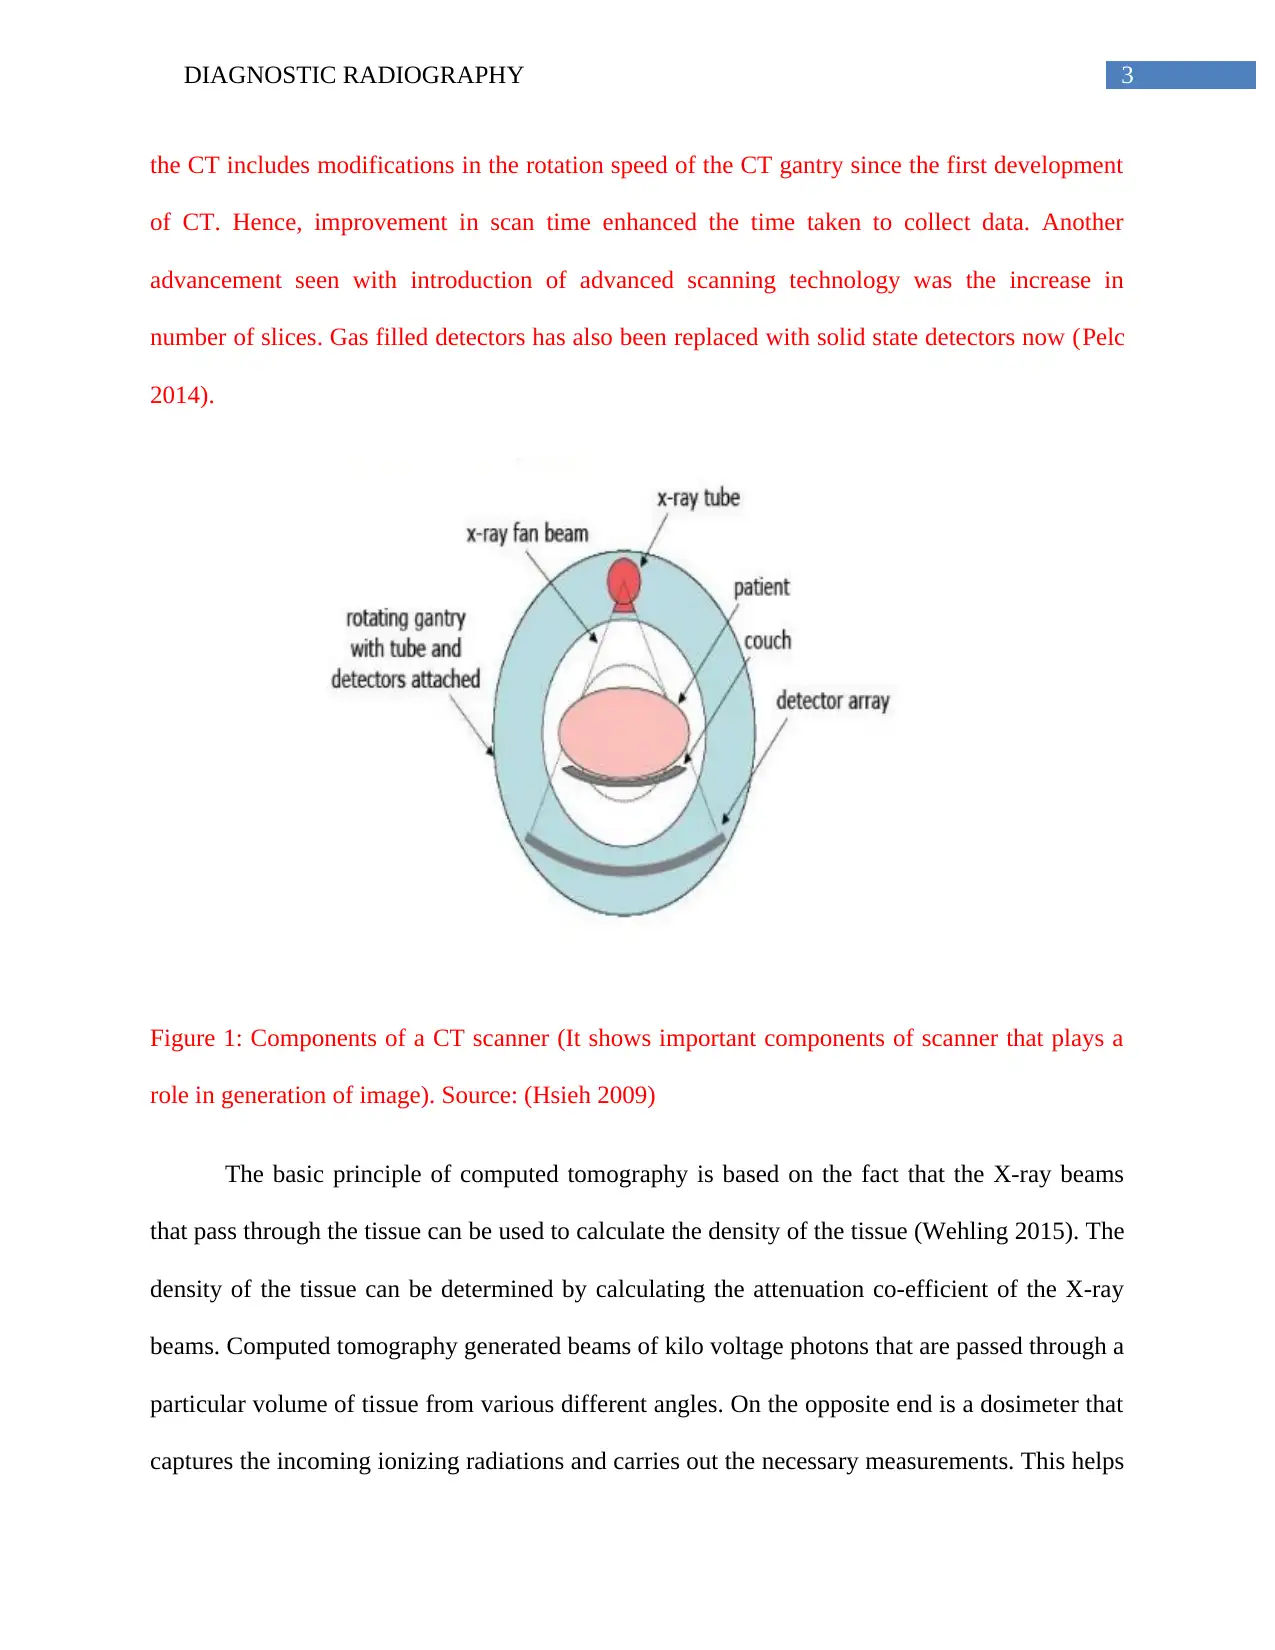
the CT includes modifications in the rotation speed of the CT gantry since the first development
of CT. Hence, improvement in scan time enhanced the time taken to collect data. Another
advancement seen with introduction of advanced scanning technology was the increase in
number of slices. Gas filled detectors has also been replaced with solid state detectors now (Pelc
2014).
Figure 1: Components of a CT scanner (It shows important components of scanner that plays a
role in generation of image). Source: (Hsieh 2009)
The basic principle of computed tomography is based on the fact that the X-ray beams
that pass through the tissue can be used to calculate the density of the tissue (Wehling 2015). The
density of the tissue can be determined by calculating the attenuation co-efficient of the X-ray
beams. Computed tomography generated beams of kilo voltage photons that are passed through a
particular volume of tissue from various different angles. On the opposite end is a dosimeter that
captures the incoming ionizing radiations and carries out the necessary measurements. This helps
Paraphrase This Document
Need a fresh take? Get an instant paraphrase of this document with our AI Paraphraser
4DIAGNOSTIC RADIOGRAPHY
in the determination of the attenuations of the respective beams that passes through the
concerned volume of tissue (Seeram 2015). The tissue slice is divided into a matrix of
rectangular boxes in a 3 dimensional arrangement and are referred to as voxels. This 3
dimensional pixel has height, width and depth. As the beams traverses the entire volume of
tissue, it will pass through a number of those voxels. The attenuation of the resulting beam that
traverses the tissue volume is defined as the sum of the attenuations of the beams in each voxel.
Modern day scanners can generate up to 512 voxels.
The process of computed tomography requires data collection involving gantry and table,
data processing with the help of a computer, image display in the console and data storage with
the help of a camera. The objective of computed tomography is to carry out image reconstruction
using the attenuations of the narrow X- ray beams for each voxel. The attenuation values that are
obtained are represented in the form of grey levels on the 2 dimensional image of the tissue slice
(Comer and Kendall 2013). Image presentation in computed tomography is based on the
principle of replacing each attenuation values of the voxels on the reconstruction matrix with an
integer also called the computed tomography number or CT number. The CT number is depicted
in Hounsfield units or HU and is represented by the formula: [K x (uvoxel – uwater)]/ uwater, where
uvoxel is the attenuation coefficient of the voxel and uwater is the attenuation co-efficient of water
(Brown and Brown 2014). K is the integer constant. The CT number ranges are represented by
the grey scales is called the window width. The window width represents the CT numbers that
are present above or below the window level. Tissues having CT numbers greater than the
window level appear white, while the tissues having CT numbers below the window level appear
black. The resulting image obtained is displayed on the computer monitor and the data can be
5DIAGNOSTIC RADIOGRAPHY
recorded on X- ray films with the help of laser camera that can depict the image in multiple
configurations (Waterstram-Rich and Gilmore 2016).
Date acquisition, image reconstruction, image display, processing, storage, recording and
communication are some of the important imaging processes of CT scanner. The acquisition of
CT data is dependent on sample preparation and proper calibration technique. The object needs
to be in field of view during scanning. Secondly, calibration is necessary to establish the
characteristics of x-ray signal and minimize geometrical uncertainties. The CT data are collected
at distinct angular position and the number of views and the signal-acquisition time per view
influences the process (McCollough et al. 2015). In this way, continuous sinograms are
generated. The next process of image reconstruction is a process that generates tomographic
image from X-ray projection data acquired from different angles. Image reconstruction has a
major impact on image quality and radiation dose. Image processing is done with the use of
various software to achieve best quality image. Several techniques also enhance the intensities of
the image. The date recorded is stored in computer memory for later image review and
reconstruction (Geyer et al. 2015).
⊘ This is a preview!⊘
Do you want full access?
Subscribe today to unlock all pages.
Trusted by 1+ million students worldwide
6DIAGNOSTIC RADIOGRAPHY
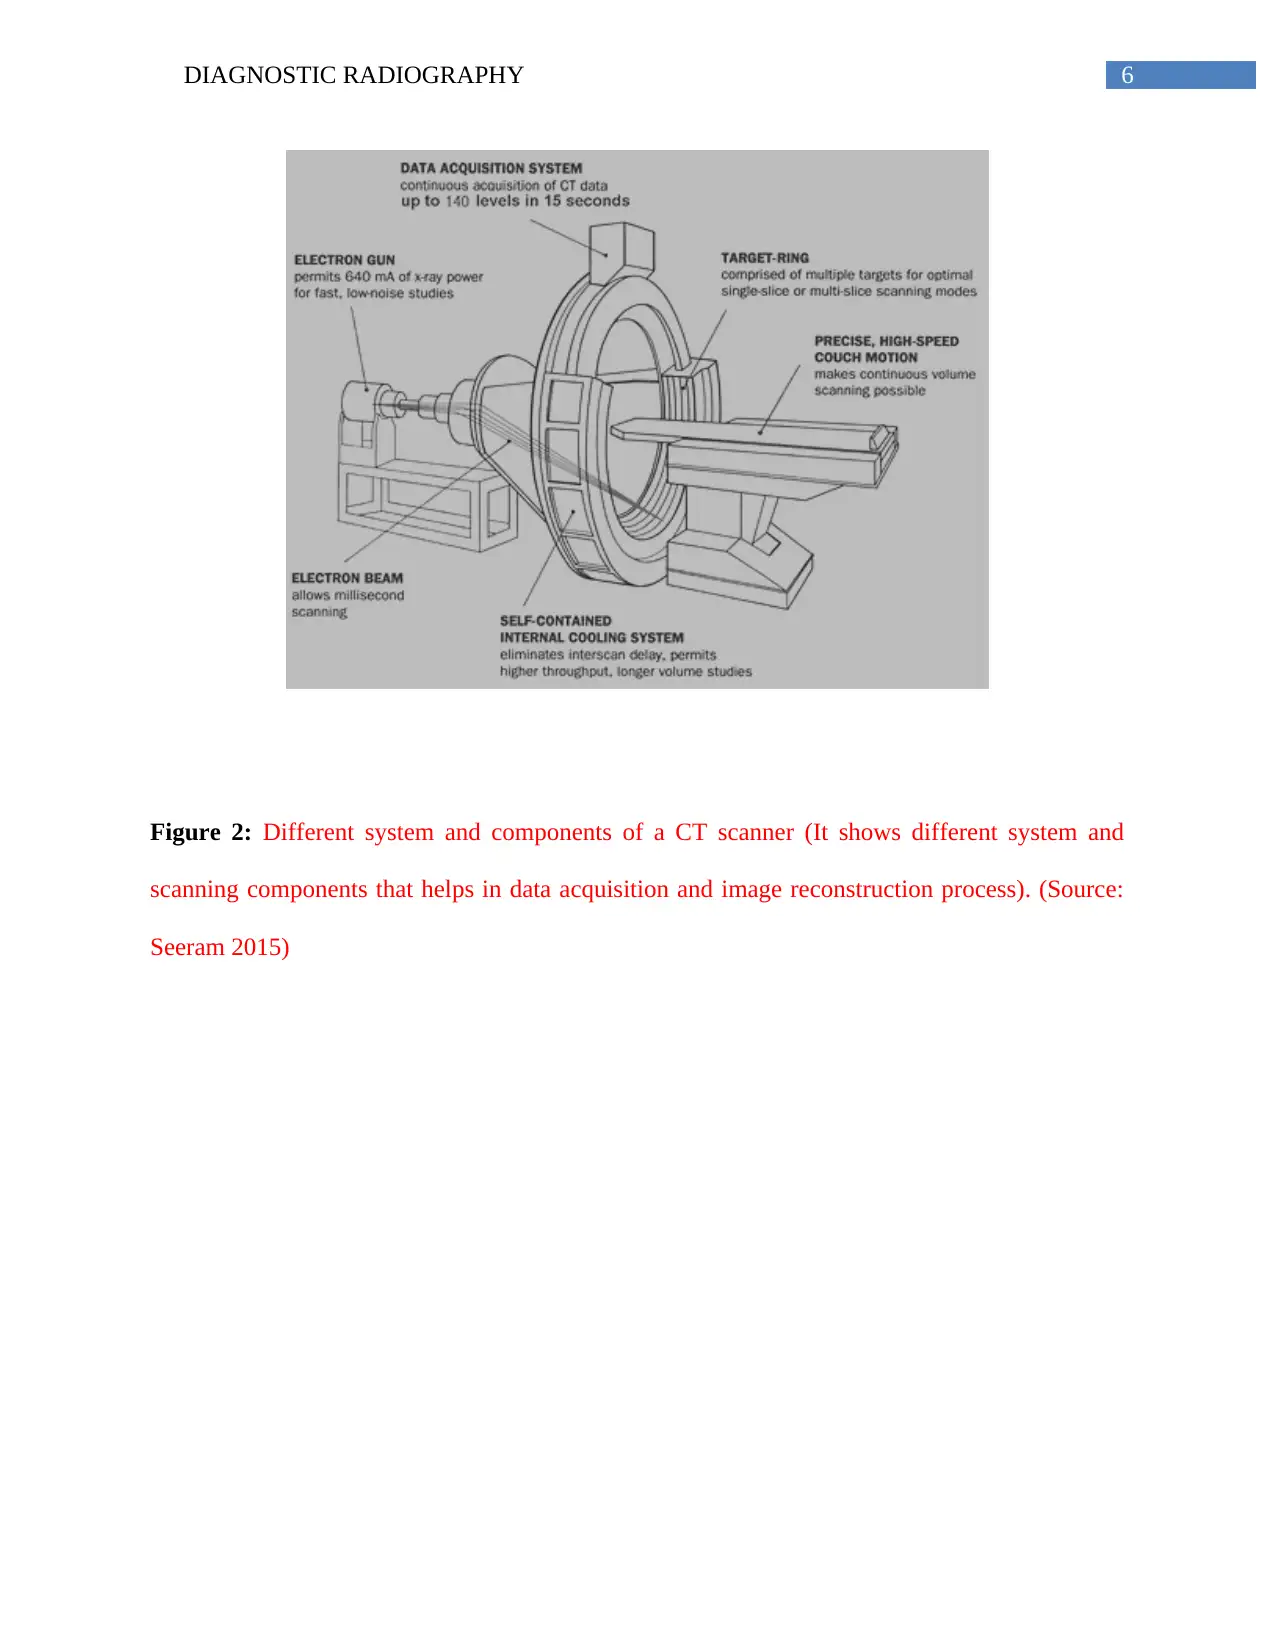
Figure 2: Different system and components of a CT scanner (It shows different system and
scanning components that helps in data acquisition and image reconstruction process). (Source:
Seeram 2015)
Figure 2: Different system and components of a CT scanner (It shows different system and
scanning components that helps in data acquisition and image reconstruction process). (Source:
Seeram 2015)
Paraphrase This Document
Need a fresh take? Get an instant paraphrase of this document with our AI Paraphraser
7DIAGNOSTIC RADIOGRAPHY
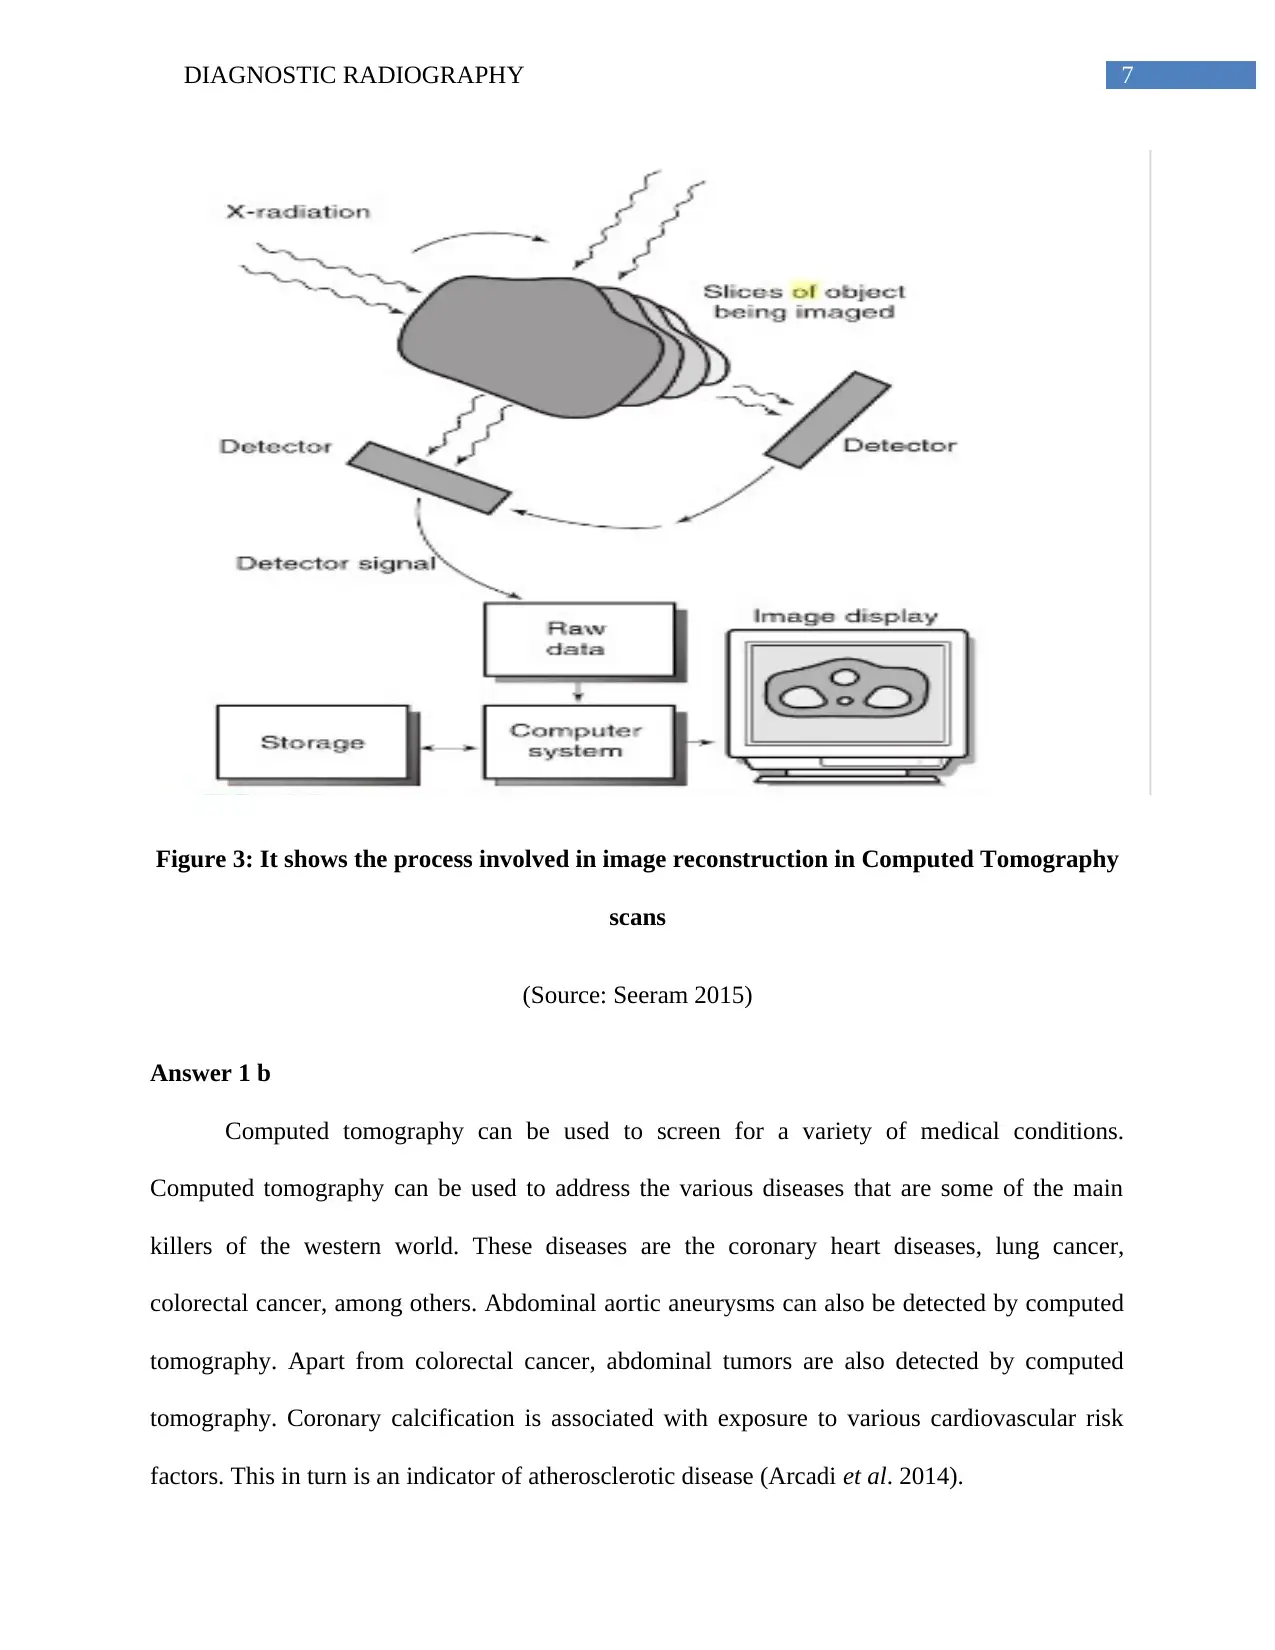
Figure 3: It shows the process involved in image reconstruction in Computed Tomography
scans
(Source: Seeram 2015)
Answer 1 b
Computed tomography can be used to screen for a variety of medical conditions.
Computed tomography can be used to address the various diseases that are some of the main
killers of the western world. These diseases are the coronary heart diseases, lung cancer,
colorectal cancer, among others. Abdominal aortic aneurysms can also be detected by computed
tomography. Apart from colorectal cancer, abdominal tumors are also detected by computed
tomography. Coronary calcification is associated with exposure to various cardiovascular risk
factors. This in turn is an indicator of atherosclerotic disease (Arcadi et al. 2014).
8DIAGNOSTIC RADIOGRAPHY
Electron beam computed tomography or EBCT can be used to detect coronary calcium,
which is an indication of coronary heart disease in asymptomatic individuals. However, multi-
detector row CT or MDCT has been recently developed that can be used to detect the presence of
coronary calcium and are known to carry out faster scanning as compared to the electron beam
computed tomography scan (Shah and Coulter 2012). Reproducibility, specificity and sensitivity
of the multi-detector row CT is much higher with respect to detection of coronary calcium, when
compared with those of electron beam computed tomography scan. Identification of individuals
with the risk of developing atherosclerotic diseases by computed tomography scanning can result
in the provision of early therapies and changes in lifestyle in order to prevent future adverse
events. Calcifications as detected by computed tomography can be associated with arteriographic
luminal narrowing, which in turn predicts future coronary events (Ibrahimi et al. 2013).
However, coronary events can also be caused by non-calcified plaques, which are not detected
by computed tomography (He et al. 2013).
Helical computed tomography can also be used to diagnose lung cancer in the early
stages. This helps to detect the disease at an initial level, thereby helping in further advancing of
the diagnosis and treatment leading to a potential cure. However, computed tomography itself
cannot distinguish between benign and malignant nodules in lung cancer and additional tests are
therefore required. Early detection of lung cancer with computed tomography helps to shift the
stages of the disease from advanced to localized, which is highly curable. Colorectal cancer is
another life threatening disease and is characterized by the presence of precancerous lesions
called polyps (Fausel and Dominitz 2013).
Computed tomography colonography is a technique that has been reported to have a
sensitivity of 90-94% and specificity of 72% and is not associated with any risks of bowel
⊘ This is a preview!⊘
Do you want full access?
Subscribe today to unlock all pages.
Trusted by 1+ million students worldwide
9DIAGNOSTIC RADIOGRAPHY
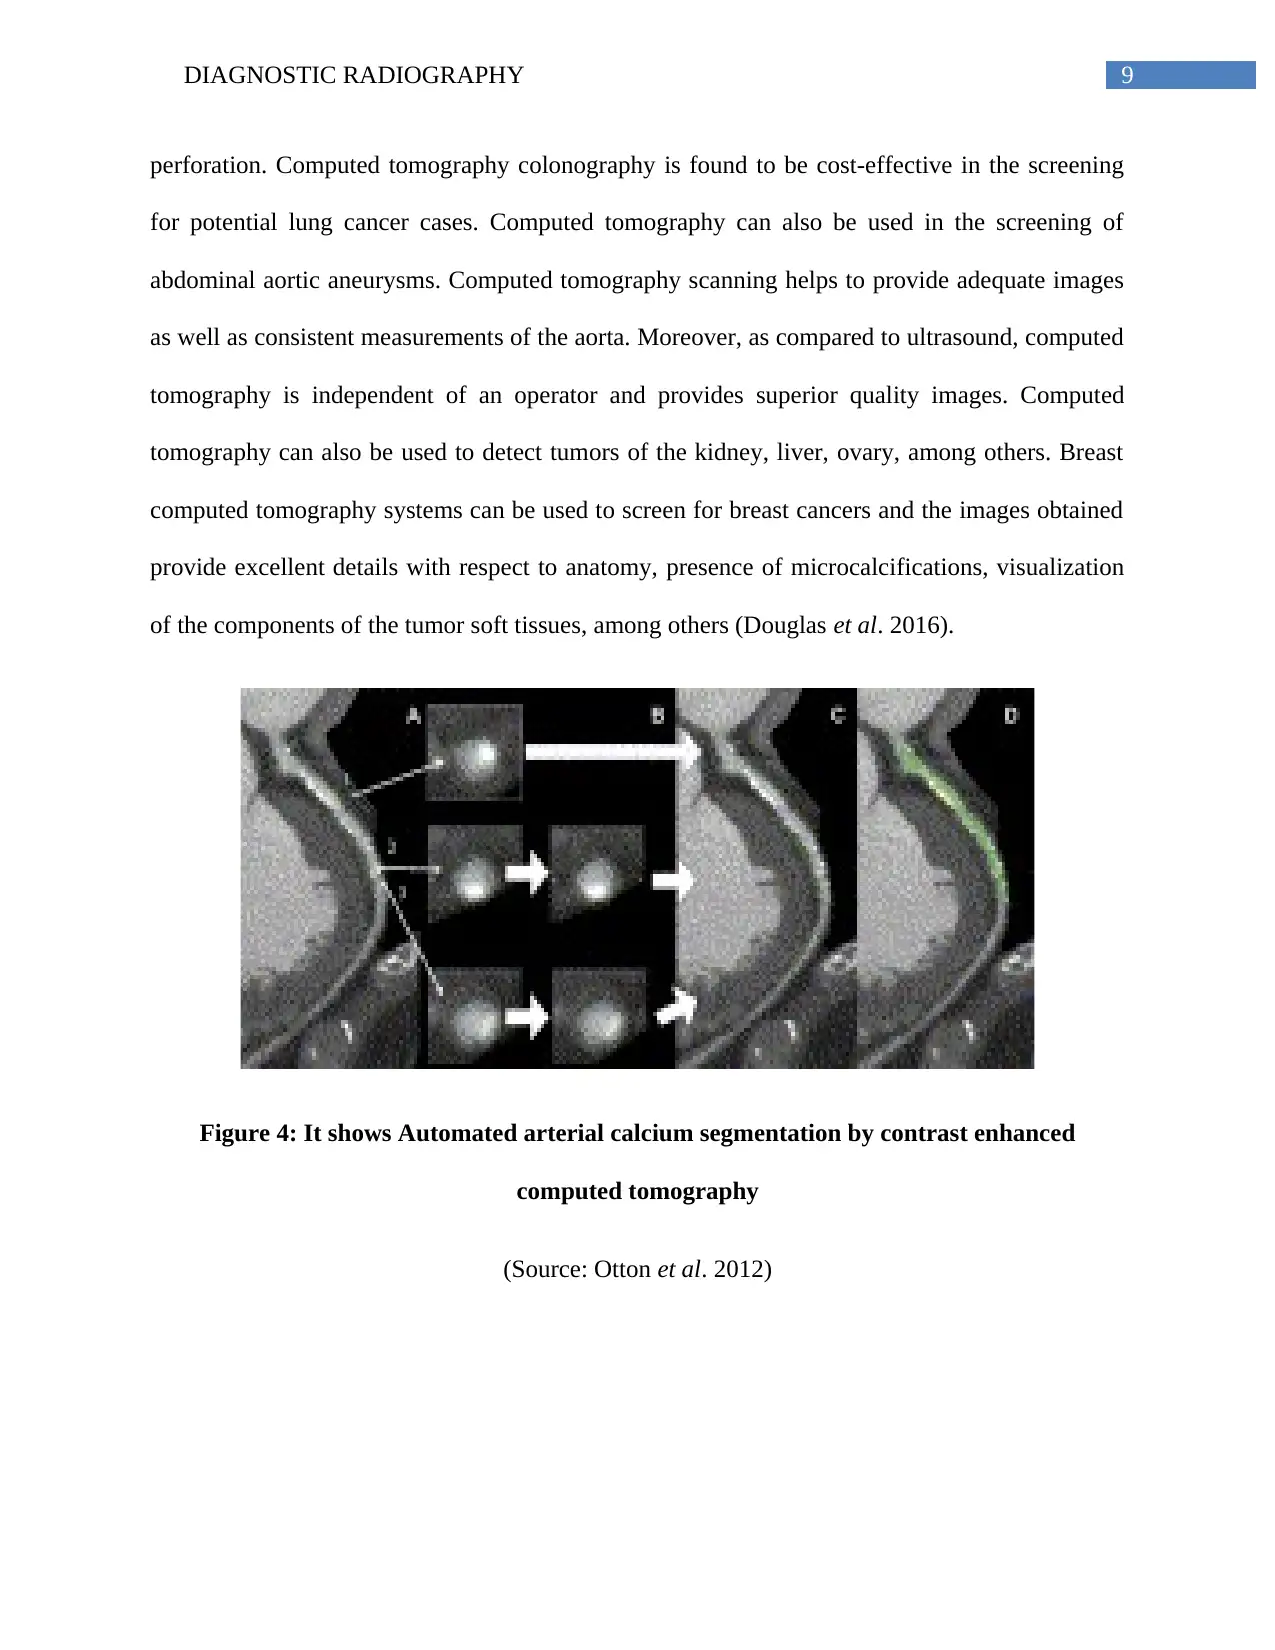
perforation. Computed tomography colonography is found to be cost-effective in the screening
for potential lung cancer cases. Computed tomography can also be used in the screening of
abdominal aortic aneurysms. Computed tomography scanning helps to provide adequate images
as well as consistent measurements of the aorta. Moreover, as compared to ultrasound, computed
tomography is independent of an operator and provides superior quality images. Computed
tomography can also be used to detect tumors of the kidney, liver, ovary, among others. Breast
computed tomography systems can be used to screen for breast cancers and the images obtained
provide excellent details with respect to anatomy, presence of microcalcifications, visualization
of the components of the tumor soft tissues, among others (Douglas et al. 2016).
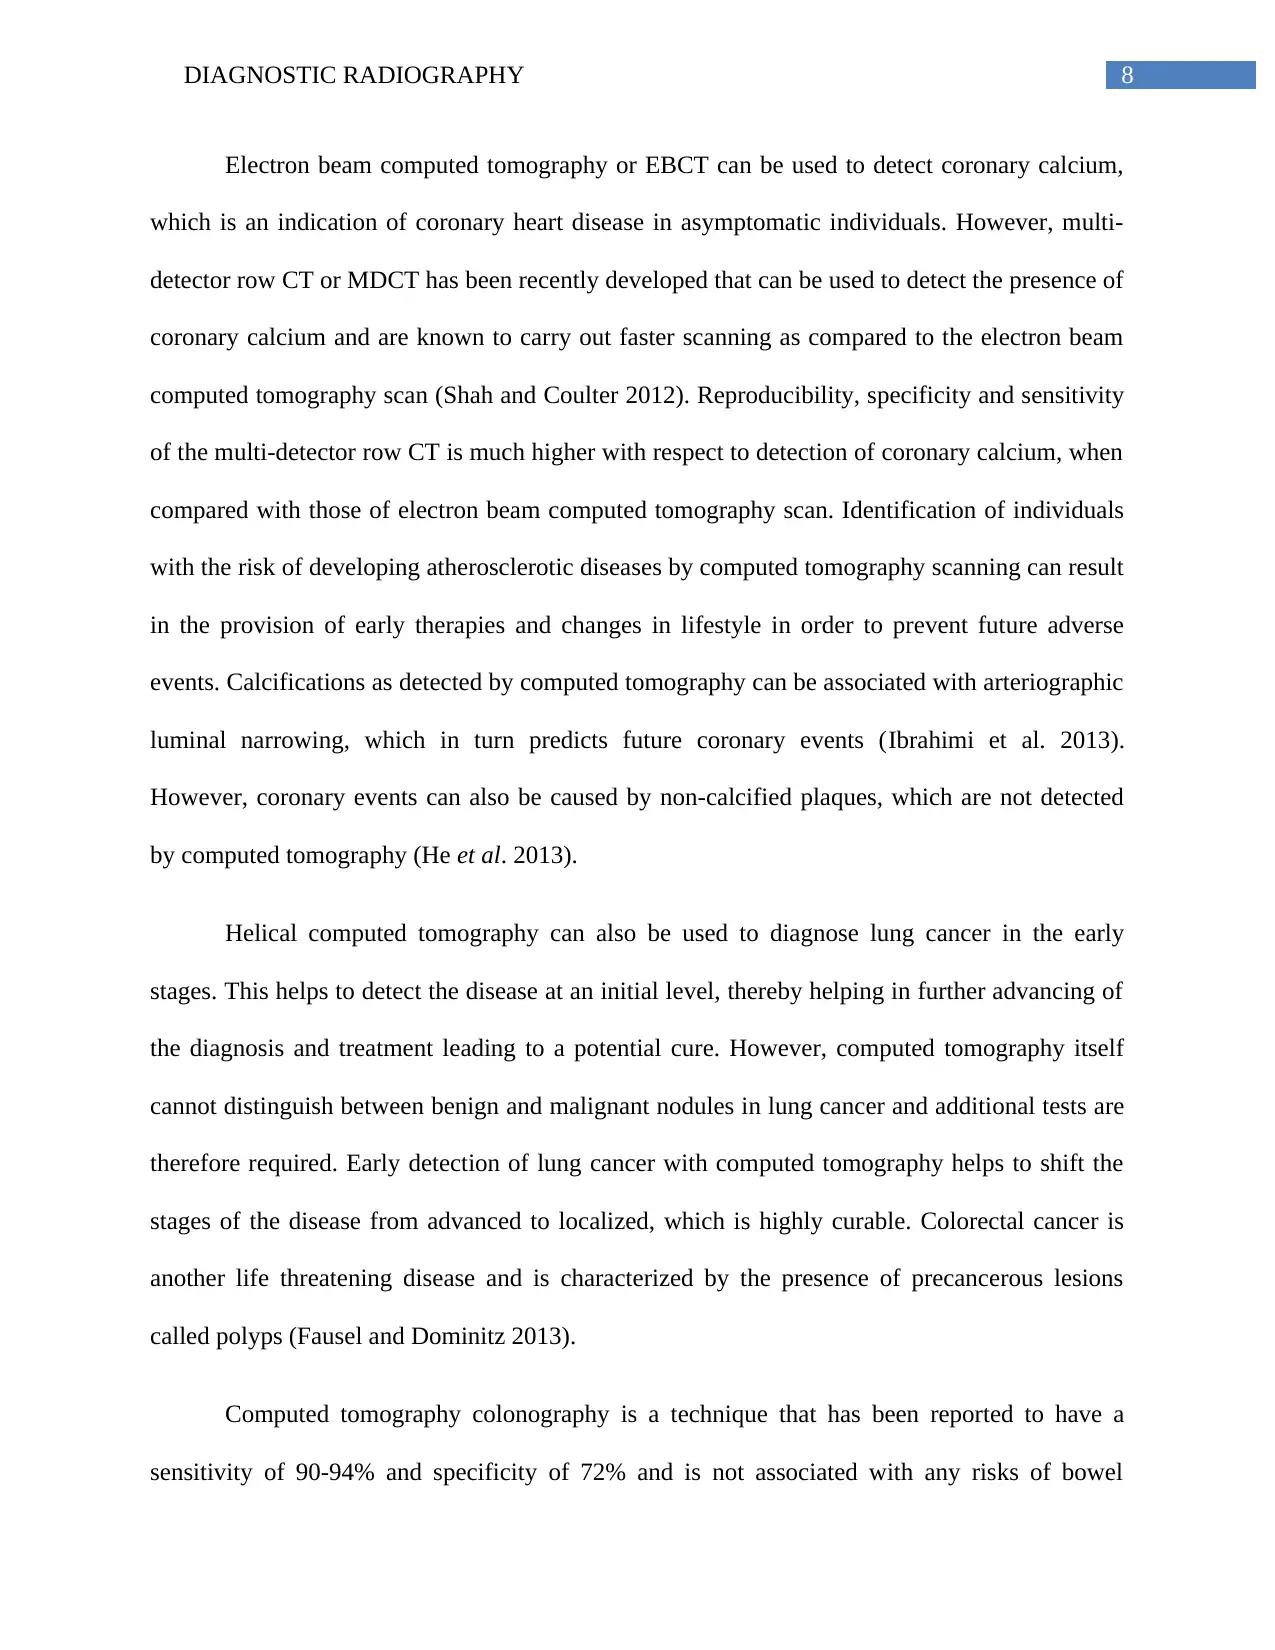
Figure 4: It shows Automated arterial calcium segmentation by contrast enhanced
computed tomography
(Source: Otton et al. 2012)
perforation. Computed tomography colonography is found to be cost-effective in the screening
for potential lung cancer cases. Computed tomography can also be used in the screening of
abdominal aortic aneurysms. Computed tomography scanning helps to provide adequate images
as well as consistent measurements of the aorta. Moreover, as compared to ultrasound, computed
tomography is independent of an operator and provides superior quality images. Computed
tomography can also be used to detect tumors of the kidney, liver, ovary, among others. Breast
computed tomography systems can be used to screen for breast cancers and the images obtained
provide excellent details with respect to anatomy, presence of microcalcifications, visualization
of the components of the tumor soft tissues, among others (Douglas et al. 2016).
Figure 4: It shows Automated arterial calcium segmentation by contrast enhanced
computed tomography
(Source: Otton et al. 2012)
Paraphrase This Document
Need a fresh take? Get an instant paraphrase of this document with our AI Paraphraser
10DIAGNOSTIC RADIOGRAPHY
Section B
Answer 5
A mammography or a mammogram is an X- ray image of the chest. It is used for the
diagnosis of breast cancer at the early stages. During mammography, each breast are placed on
flat X- ray plates and a compressor helps to flatten the breast tissue. Mammography is a type of
imaging technique that can be used to detect breast cancers (Ossati 2015). It uses a low dose of
X- rays in order to carry out an extensive imaging of the breasts. In a digital mammogram X-rays
are transformed into an electronic picture, which in turn is stored in a computer (Hogg, Kelly and
Mercer 2015). Digital mammography also designated full field digital mammography employs
electronic systems that transforms the X- rays into mammographic images of the breast. The
advantages associated with digital mammography are its ability to produce superior quality
images utilizing low doses of radiation (Patterson and Roubidoux 2014). The computer aided
detection system or CAD search for areas of abnormal mass, density, calcifications in the digital
mammographic images. The presence of these abnormal features indicate the presence of breast
cancer. Three dimensional mammography also called breast tomosynthesis is used to produce 3-
D images of the breasts obtained from various different angles. These images obtained from
various angles can be reconstructed to produce a single three-dimensional image. Mammography
helps in the identification of calcifications in the breasts. The test also helps in the identification
of cysts and the presence of lumps, which can be cancerous or non-cancerous. The breast
imaging reporting and database system or BI-RADS is a national diagnostic system that helps to
read mammograms. The system is divided into seven categories, which ranges from 0 to 6 and
each category describes the severity of the cancer from benign to cancerous lump.
Mammography helps in the early detection of breast cancers, accurate determination of shape,
11DIAGNOSTIC RADIOGRAPHY
size and location of the abnormalities of the breast, reduces the need of other biopsies, increases
the chances associated with the detection of multiple breast tumors and provides comprehensible
images of the abnormalities present within the breast tissues (Philpotts and Hooley 2016).
Mammograms are used in screening programs to detect breast cancers in women who do
not show any symptoms and also in women who show symptoms like pain, presence of lump,
nipple discharge or skin dimpling (Zhang et al. 2012). Use of mammograms in screening
programs helps to detect breast cancers at an early stage, when they can be cured or when
administration of breast conservation therapies are applicable (Saadatmand et al. 2015). The
National Cancer Institute has advised women, with previous experiences of breast cancer or
those with family histories to participate in breast cancer screening programs (Fuller, Lee and
Elmore 2015). The rationale for the use of mammography in screening programs is its ability to
detect cancers when they are small and impalpable. Identification of such small impalpable
breast cancers during screening programs helps to cure the cancers with the use of only local
therapies (Yip, Bhoo and Teo 2014). Various research and screening programs have
acknowledged the role of mammography in reducing the risks of breast cancer mortality.
Mammography is a cost effective technique and helps to distinguish between malignant and
benign breast abnormalities (Whitman and Haygood 2012).
⊘ This is a preview!⊘
Do you want full access?
Subscribe today to unlock all pages.
Trusted by 1+ million students worldwide
1 out of 20
Related Documents


Your All-in-One AI-Powered Toolkit for Academic Success.
+13062052269
info@desklib.com
Available 24*7 on WhatsApp / Email
![[object Object]](/_next/static/media/star-bottom.7253800d.svg)
Unlock your academic potential
Copyright © 2020–2026 A2Z Services. All Rights Reserved. Developed and managed by ZUCOL.