Financial Statement Analysis and Interpretation for Diamond plc
VerifiedAdded on 2020/11/23
|12
|2828
|96
Report
AI Summary
This report provides a detailed analysis of Diamond plc's financial statements, including the statement of profit or loss, statement of financial position, and statement of cash flow. The analysis covers trend analysis of revenue, gross profit margin, and cost of sales, examining the performance of different segments (UK, US, and rest of world). It delves into the impact of investments, particularly a large investment in the US market, on the company's financial condition, assessing solvency through debt-equity and interest coverage ratios. The report explores the classification of provisions versus trade payables and discusses the implications of a legal case. Furthermore, it examines cash flow from operating activities, the reasons behind adjustments like depreciation, and the changes in cash and cash equivalents, offering insights into Diamond plc's financial health and operational efficiency. The report concludes with an executive summary that highlights key findings and potential areas of concern, particularly regarding the company's debt levels.
UNDERSTANDING
FINANCIAL
STATEMENTS
FINANCIAL
STATEMENTS
Paraphrase This Document
Need a fresh take? Get an instant paraphrase of this document with our AI Paraphraser
TABLE OF CONTENTS
EXECUTIVE SUMMARY.............................................................................................................4
INTRODUCTION...........................................................................................................................4
QUESTION 1...................................................................................................................................4
1.1 Considering above three descriptions...................................................................................4
1.1 (a) Description related to Statement of profit or loss or financial position...........................4
1.1 (b) Brief classification of stated three descriptions in profit and loss statement or balance
sheet............................................................................................................................................4
1.2 Considering Exhibit 1 and Exhibit 2.....................................................................................4
1.2 (a) Determining similar figure in SPL and SOFP.................................................................4
1.2 (b) Determining similar figure in SOCF and SOFP..............................................................5
1.2 (c) Determining similar figure in SPL and SOCF.................................................................5
QUESTION 2...................................................................................................................................5
2.1 Considering segment analysis of Exhibit 2...........................................................................5
2.1 (a) Trend analysis for percentage movement in total revenue of 2016 and 2017.................5
2.1 (b) Trend analysis for determining percentage movement in revenue of UK, US and rest of
world...........................................................................................................................................5
2.1 (c) Interpretation of decrement of revenue of Diamond plc in year 2017............................6
2.2 Constituents of cost of sales..................................................................................................6
2.3 Considering segment analysis provided in Exhibit 2............................................................6
2.3 (a) Gross profit margin of US, UK and rest of world...........................................................6
2.3 (b) Reason for decrement of gross margin in UK.................................................................7
2.3 (c) Reason for lower gross profit margin in US market from UK market............................7
2.4(a) considering breakdown of cost of sales in Exhibit 2........................................................7
2.4 (b) Reason for analysing above extracted movements..........................................................7
2.5 Reason for fall of gross profit margin from 8.44% to 7.09%...............................................8
2.6 Considering Statement of Profit and loss for administration and finance cost.....................8
2.6 (a) Ratio analysis...................................................................................................................8
2.6 (b) Justifying reason for above movement............................................................................8
QUESTION 3...................................................................................................................................8
3.1 Impact of large investment in US market of joint venture....................................................8
3.2 Impact of investment on financial condition ........................................................................8
3.2 (a) Assessing its financial solvency on basis of debt equity and interest coverage ratio......8
3.2 (b) Measurement of risk insolvency in future.......................................................................9
3.3 Key difference for classification of provision instead of trade payable................................9
3.4 Legal case described by Felix Redmond...............................................................................9
QUESTION 4...................................................................................................................................9
4.1 Interpretation of Statement of cash flows.............................................................................9
4.1 (a) Significance of cash inflow from operating activities.....................................................9
4.1 (b) Reason for adjustment like depreciation.........................................................................9
4.2 Analysing cash and cash equivalents along with capability for generating cash resources10
4.2 (a) Reason for decrement for 2016 to 2017 in cash and cash equivalents..........................10
4.2 (b) Practical implications for increment of cash and cash equivalents...............................10
Appendix........................................................................................................................................11
REFERENCES..............................................................................................................................12
⊘ This is a preview!⊘
Do you want full access?
Subscribe today to unlock all pages.
Trusted by 1+ million students worldwide
EXECUTIVE SUMMARY
The present report could be concluded that Diamond plc is operating in efficient manner
as it is creating capability for expanding in various places. But on its contrary it should keep
appropriate watch on its long term borrowings or debt because it is decreasing profit margin of
organization.
INTRODUCTION
Financial statements are key aspect of every organization whether it is small or big, as it
helps in reflecting financial position along with stability. The present report is giving brief
discussion about financial statements of Diamond plc along with its proper interpretation.
QUESTION 1
1.1 Considering above three descriptions
1.1 (a) Description related to Statement of profit or loss or financial position
Description 1 is about bank loan which is repaid is related to Statement of profit and loss.
Description 2 is accounted in Statement of cash flow
Description 3 will be included in Statement of profit and loss.
1.1 (b) Brief classification of stated three descriptions in profit and loss statement or balance
sheet.
Description 1 would be represented as bank loan in statement of profit and loss. (Minnis
and Sutherland, 2017).
Description 2 would be indicated as dividend payable to directors in financing activity.
Description 3 would be considered as income which would be constituted in operating
income.
1.2 Considering Exhibit 1 and Exhibit 2
1.2 (a) Determining similar figure in SPL and SOFP
Retained earnings constitute of sum of opening balance and profit of specific year and
from this dividend paid is excluded which gives closing balance in statement of financial
position. On its contrary, Statement of profit and loss extracts the profit for specific period which
is 1386 in 2017 and 3164 in 2016.
Paraphrase This Document
Need a fresh take? Get an instant paraphrase of this document with our AI Paraphraser
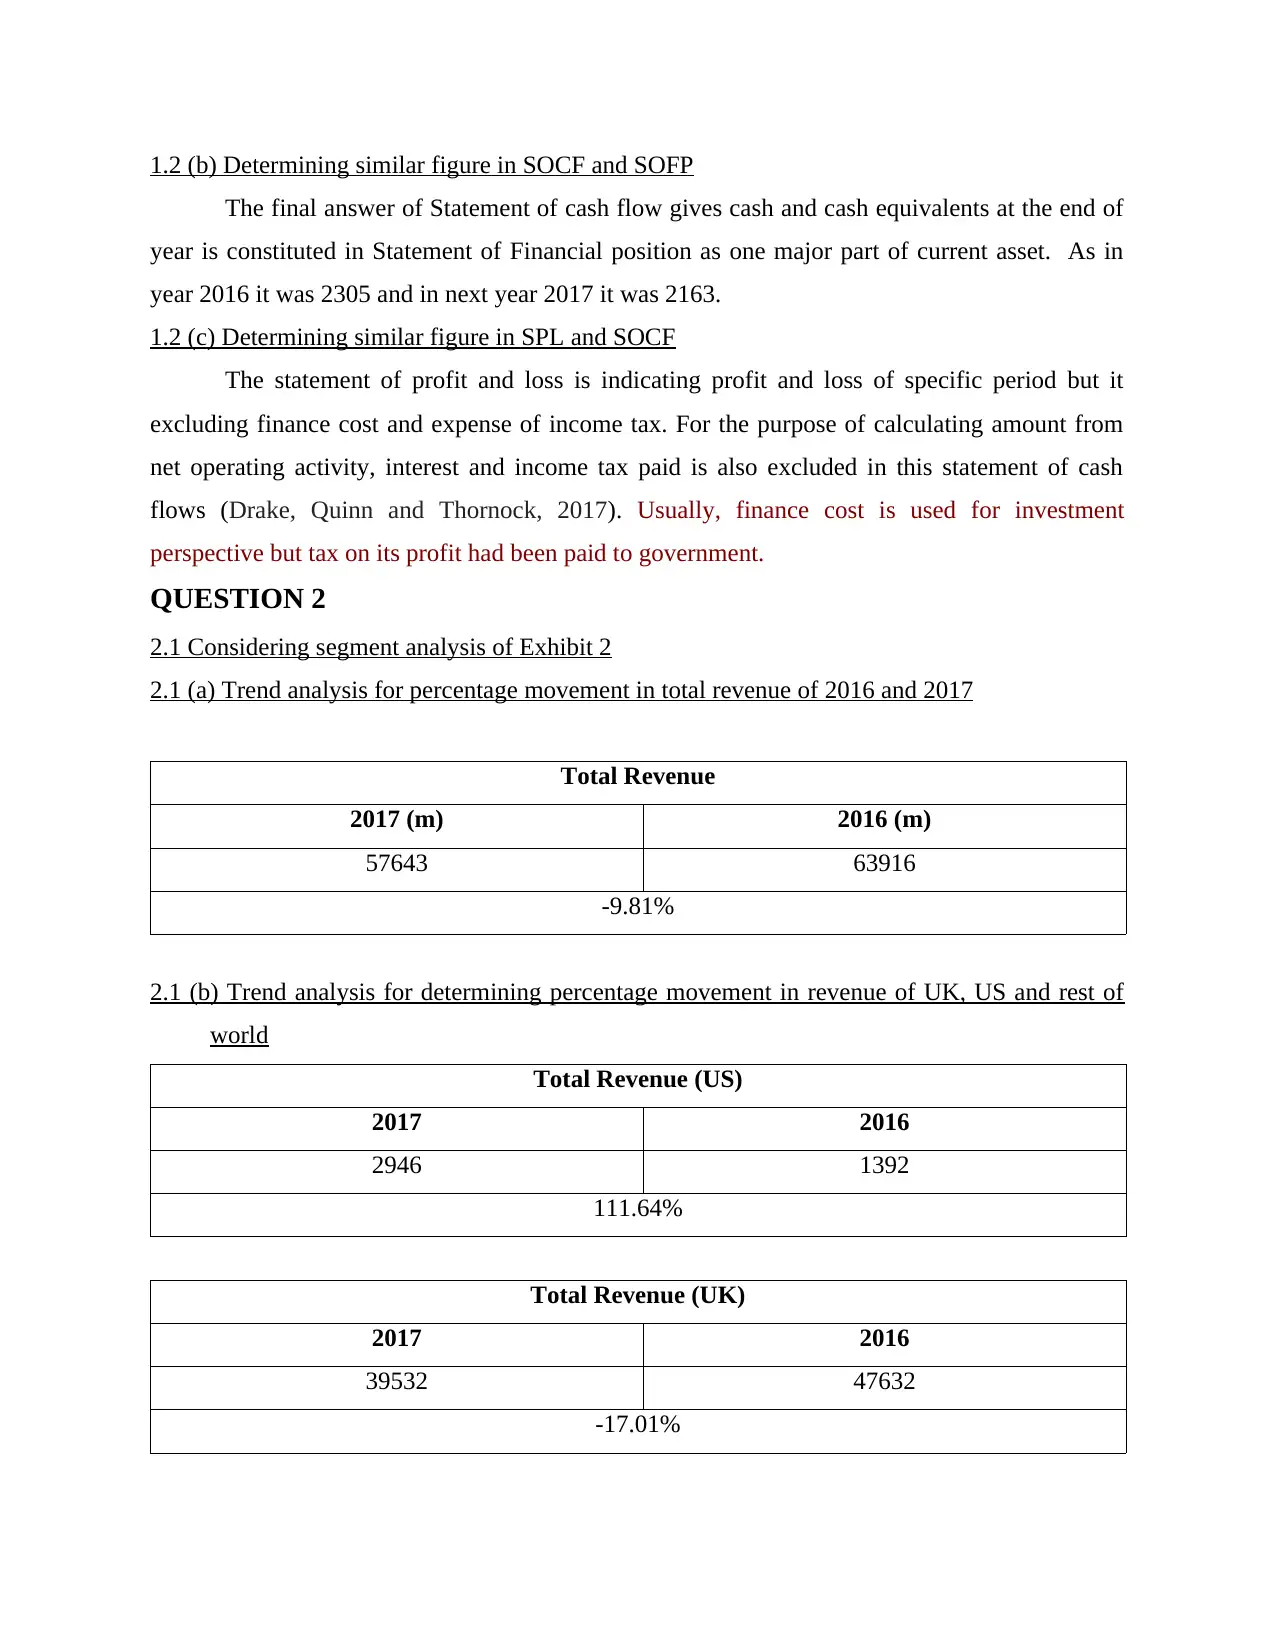
1.2 (b) Determining similar figure in SOCF and SOFP
The final answer of Statement of cash flow gives cash and cash equivalents at the end of
year is constituted in Statement of Financial position as one major part of current asset. As in
year 2016 it was 2305 and in next year 2017 it was 2163.
1.2 (c) Determining similar figure in SPL and SOCF
The statement of profit and loss is indicating profit and loss of specific period but it
excluding finance cost and expense of income tax. For the purpose of calculating amount from
net operating activity, interest and income tax paid is also excluded in this statement of cash
flows (Drake, Quinn and Thornock, 2017). Usually, finance cost is used for investment
perspective but tax on its profit had been paid to government.
QUESTION 2
2.1 Considering segment analysis of Exhibit 2
2.1 (a) Trend analysis for percentage movement in total revenue of 2016 and 2017
Total Revenue
2017 (m) 2016 (m)
57643 63916
-9.81%
2.1 (b) Trend analysis for determining percentage movement in revenue of UK, US and rest of
world
Total Revenue (US)
2017 2016
2946 1392
111.64%
Total Revenue (UK)
2017 2016
39532 47632
-17.01%
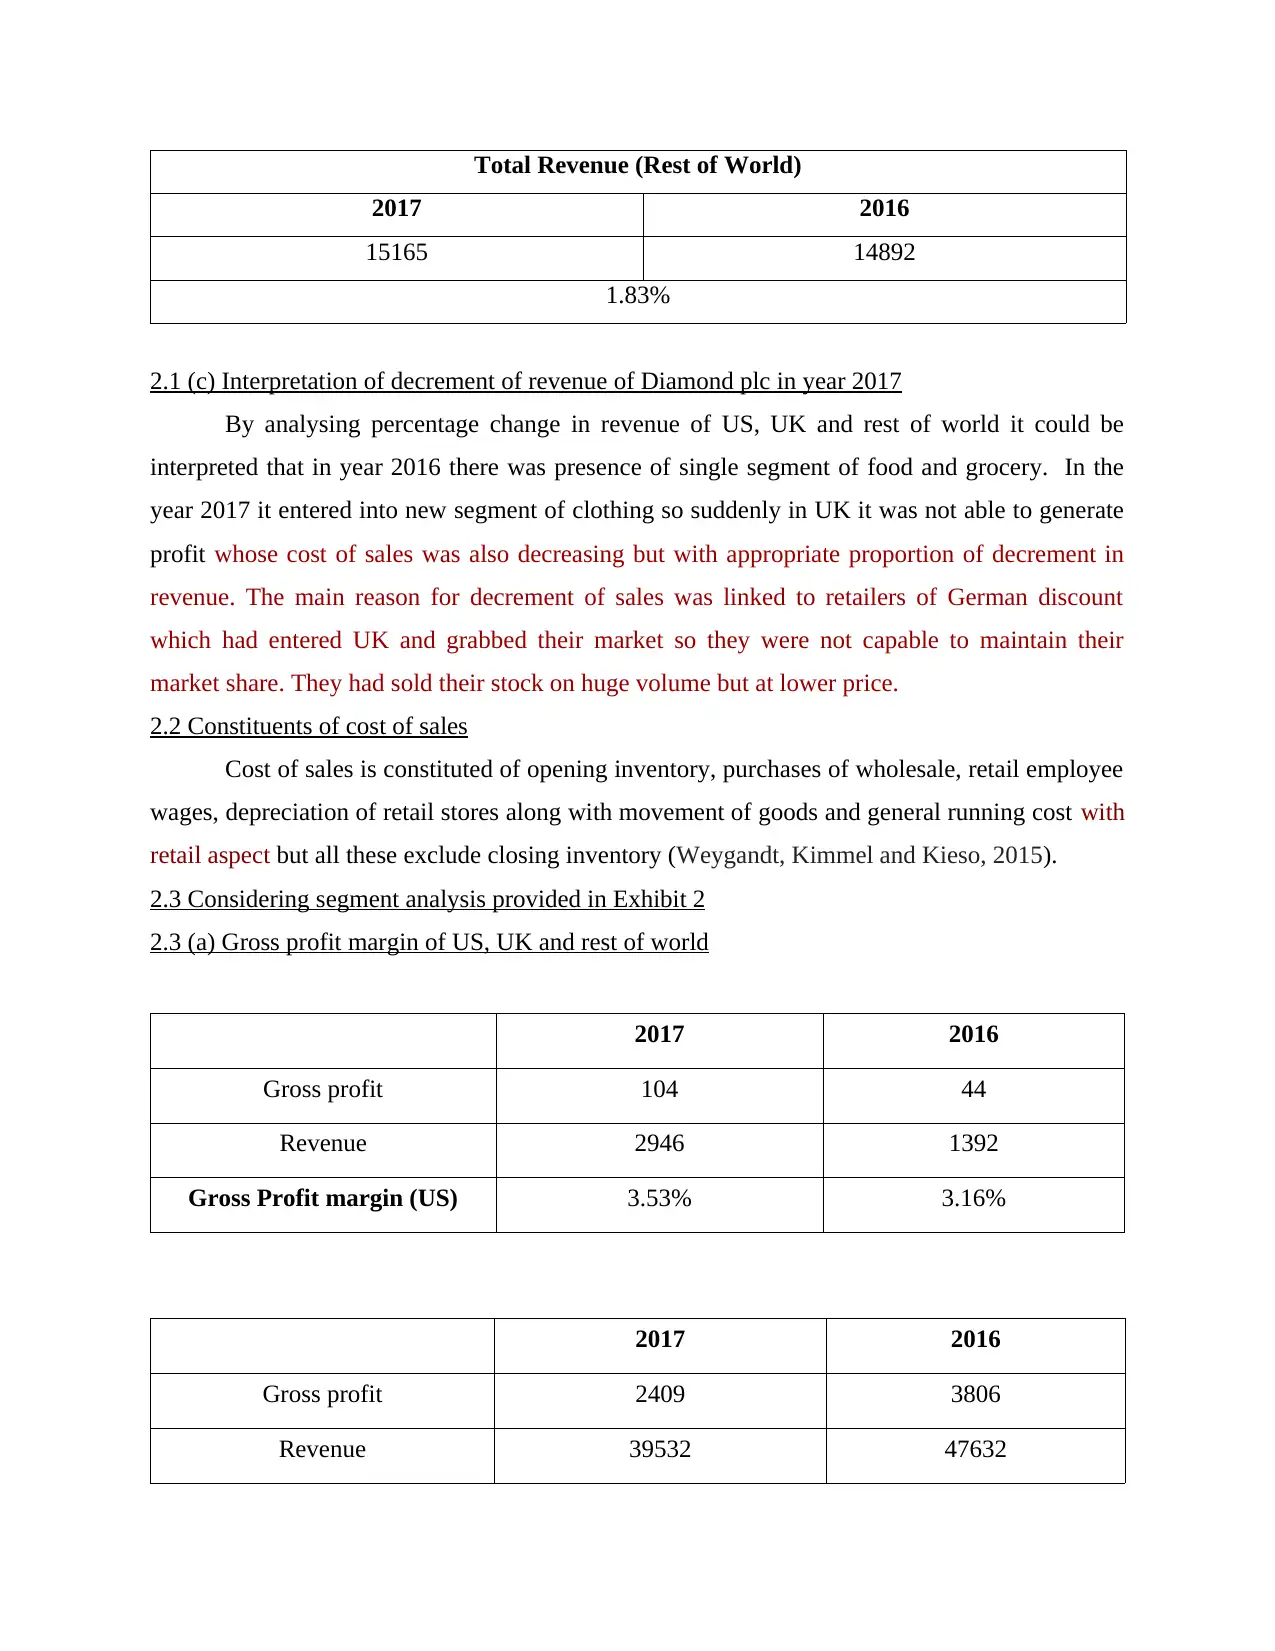
Total Revenue (Rest of World)
2017 2016
15165 14892
1.83%
2.1 (c) Interpretation of decrement of revenue of Diamond plc in year 2017
By analysing percentage change in revenue of US, UK and rest of world it could be
interpreted that in year 2016 there was presence of single segment of food and grocery. In the
year 2017 it entered into new segment of clothing so suddenly in UK it was not able to generate
profit whose cost of sales was also decreasing but with appropriate proportion of decrement in
revenue. The main reason for decrement of sales was linked to retailers of German discount
which had entered UK and grabbed their market so they were not capable to maintain their
market share. They had sold their stock on huge volume but at lower price.
2.2 Constituents of cost of sales
Cost of sales is constituted of opening inventory, purchases of wholesale, retail employee
wages, depreciation of retail stores along with movement of goods and general running cost with
retail aspect but all these exclude closing inventory (Weygandt, Kimmel and Kieso, 2015).
2.3 Considering segment analysis provided in Exhibit 2
2.3 (a) Gross profit margin of US, UK and rest of world
2017 2016
Gross profit 104 44
Revenue 2946 1392
Gross Profit margin (US) 3.53% 3.16%
2017 2016
Gross profit 2409 3806
Revenue 39532 47632
2017 2016
15165 14892
1.83%
2.1 (c) Interpretation of decrement of revenue of Diamond plc in year 2017
By analysing percentage change in revenue of US, UK and rest of world it could be
interpreted that in year 2016 there was presence of single segment of food and grocery. In the
year 2017 it entered into new segment of clothing so suddenly in UK it was not able to generate
profit whose cost of sales was also decreasing but with appropriate proportion of decrement in
revenue. The main reason for decrement of sales was linked to retailers of German discount
which had entered UK and grabbed their market so they were not capable to maintain their
market share. They had sold their stock on huge volume but at lower price.
2.2 Constituents of cost of sales
Cost of sales is constituted of opening inventory, purchases of wholesale, retail employee
wages, depreciation of retail stores along with movement of goods and general running cost with
retail aspect but all these exclude closing inventory (Weygandt, Kimmel and Kieso, 2015).
2.3 Considering segment analysis provided in Exhibit 2
2.3 (a) Gross profit margin of US, UK and rest of world
2017 2016
Gross profit 104 44
Revenue 2946 1392
Gross Profit margin (US) 3.53% 3.16%
2017 2016
Gross profit 2409 3806
Revenue 39532 47632
⊘ This is a preview!⊘
Do you want full access?
Subscribe today to unlock all pages.
Trusted by 1+ million students worldwide
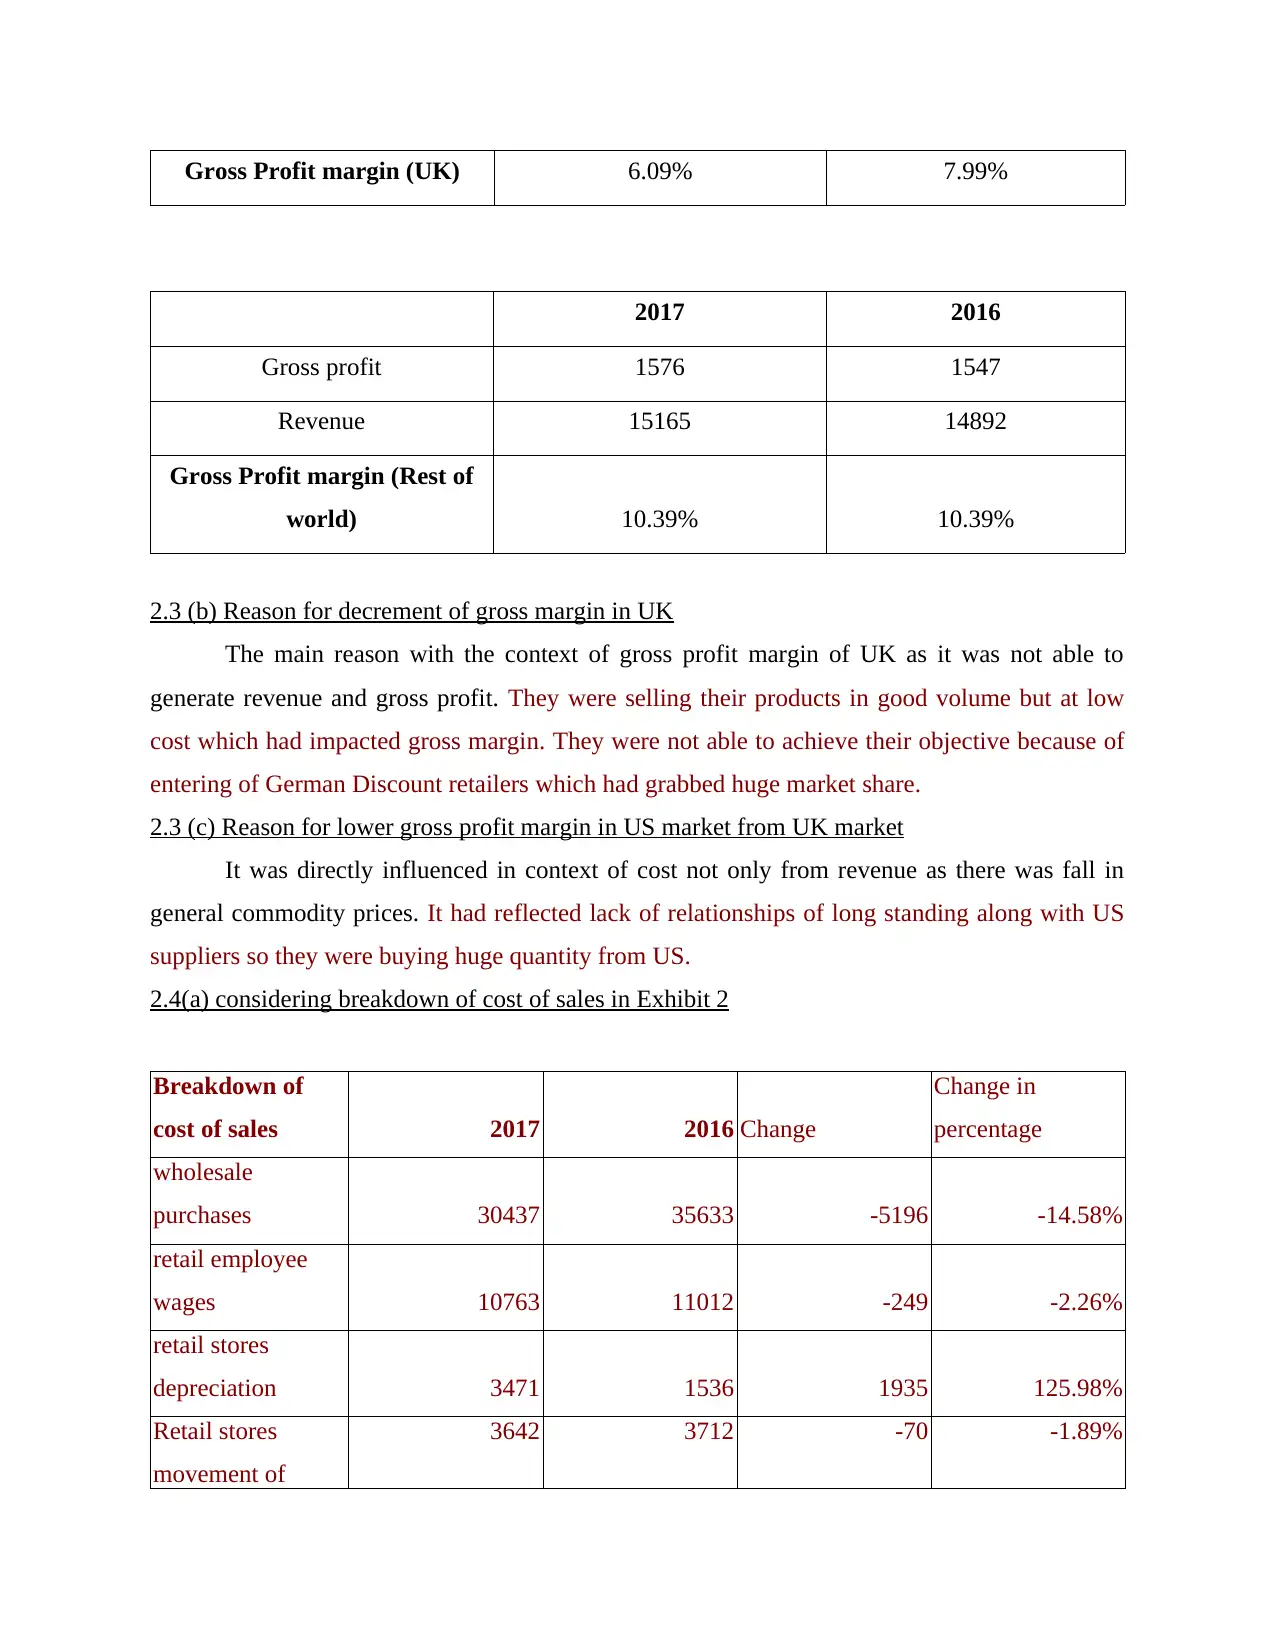
Gross Profit margin (UK) 6.09% 7.99%
2017 2016
Gross profit 1576 1547
Revenue 15165 14892
Gross Profit margin (Rest of
world) 10.39% 10.39%
2.3 (b) Reason for decrement of gross margin in UK
The main reason with the context of gross profit margin of UK as it was not able to
generate revenue and gross profit. They were selling their products in good volume but at low
cost which had impacted gross margin. They were not able to achieve their objective because of
entering of German Discount retailers which had grabbed huge market share.
2.3 (c) Reason for lower gross profit margin in US market from UK market
It was directly influenced in context of cost not only from revenue as there was fall in
general commodity prices. It had reflected lack of relationships of long standing along with US
suppliers so they were buying huge quantity from US.
2.4(a) considering breakdown of cost of sales in Exhibit 2
Breakdown of
cost of sales 2017 2016 Change
Change in
percentage
wholesale
purchases 30437 35633 -5196 -14.58%
retail employee
wages 10763 11012 -249 -2.26%
retail stores
depreciation 3471 1536 1935 125.98%
Retail stores
movement of
3642 3712 -70 -1.89%
Paraphrase This Document
Need a fresh take? Get an instant paraphrase of this document with our AI Paraphraser
goods
retail stores
general running
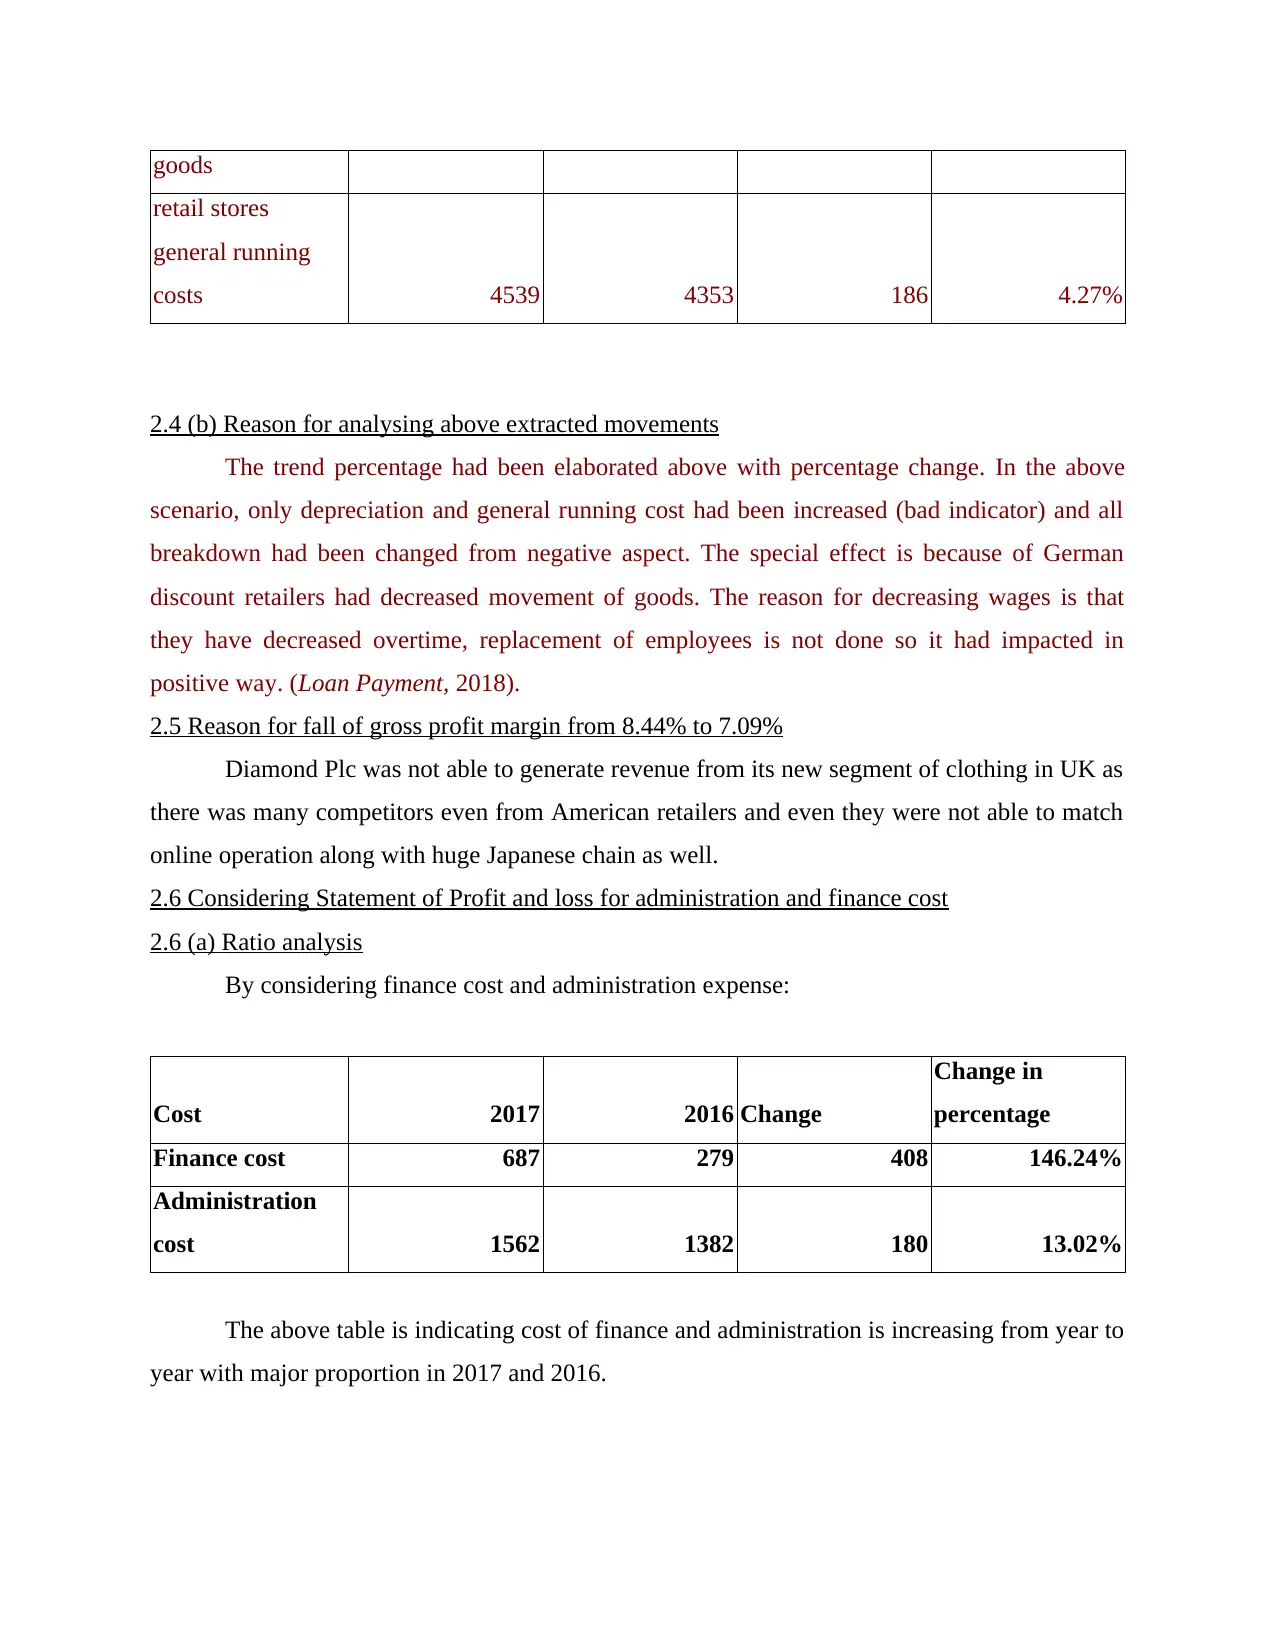
costs 4539 4353 186 4.27%
2.4 (b) Reason for analysing above extracted movements
The trend percentage had been elaborated above with percentage change. In the above
scenario, only depreciation and general running cost had been increased (bad indicator) and all
breakdown had been changed from negative aspect. The special effect is because of German
discount retailers had decreased movement of goods. The reason for decreasing wages is that
they have decreased overtime, replacement of employees is not done so it had impacted in
positive way. (Loan Payment, 2018).
2.5 Reason for fall of gross profit margin from 8.44% to 7.09%
Diamond Plc was not able to generate revenue from its new segment of clothing in UK as
there was many competitors even from American retailers and even they were not able to match
online operation along with huge Japanese chain as well.
2.6 Considering Statement of Profit and loss for administration and finance cost
2.6 (a) Ratio analysis
By considering finance cost and administration expense:
Cost 2017 2016 Change
Change in
percentage
Finance cost 687 279 408 146.24%
Administration
cost 1562 1382 180 13.02%
The above table is indicating cost of finance and administration is increasing from year to
year with major proportion in 2017 and 2016.
retail stores
general running
costs 4539 4353 186 4.27%
2.4 (b) Reason for analysing above extracted movements
The trend percentage had been elaborated above with percentage change. In the above
scenario, only depreciation and general running cost had been increased (bad indicator) and all
breakdown had been changed from negative aspect. The special effect is because of German
discount retailers had decreased movement of goods. The reason for decreasing wages is that
they have decreased overtime, replacement of employees is not done so it had impacted in
positive way. (Loan Payment, 2018).
2.5 Reason for fall of gross profit margin from 8.44% to 7.09%
Diamond Plc was not able to generate revenue from its new segment of clothing in UK as
there was many competitors even from American retailers and even they were not able to match
online operation along with huge Japanese chain as well.
2.6 Considering Statement of Profit and loss for administration and finance cost
2.6 (a) Ratio analysis
By considering finance cost and administration expense:
Cost 2017 2016 Change
Change in
percentage
Finance cost 687 279 408 146.24%
Administration
cost 1562 1382 180 13.02%
The above table is indicating cost of finance and administration is increasing from year to
year with major proportion in 2017 and 2016.
2.6 (b) Justifying reason for above movement
It could be directly interpreted that there is presence of high finance and administration
cost which is for the purpose of introducing new segment. If Diamond Plc would control these
cost then organization would be able to achieve good margin (Damodaran, 2016).
QUESTION 3
3.1 Impact of large investment in US market of joint venture
There is presence of large investment from year 2016 to 2017 as of 10599 to 17728
against provision of 586 and 420 respectively. It had been kept as provision as for setting assets
with context of company for future losses which had been anticipated.
3.2 Impact of investment on financial condition
3.2 (a) Assessing its financial solvency on basis of debt equity and interest coverage ratio
Gearing ratio helps in measuring proportion of funds which are borrowed by organization
to its equity. Interest coverage rate helps to identify capability to pay its expense of interest in
context of debt which is outstanding.
3.2 (b) Measurement of risk insolvency in future
The organization is increasing its debt along with interest expense as it is also increasing
finance cost which is not good for purpose of decreasing risk but as 1.5 is standard for so it is
optimising its resources in efficient aspects. With the context of gearing ratio through long term
investment of 10599 then it was implicating 42.17% which had more than 10% rise because of
huge investment as 53.42%. As per interest coverage ratio, there is far difference because of
increasing debt so it was decreasing ability to recover its interest from 15.47% to 3.85%
3.3 Key difference for classification of provision instead of trade payable
The statement of balance sheet includes provision instead of trade payable due to specific
time limit. With the context of liability its time period is not known so it is replicating provision
where estimation of amount is specified. With the perspective of trade payable time limit must
be mentioned in mandatory aspect.
3.4 Legal case described by Felix Redmond
Due to various additional checks the damages are paid because of success of legal action
along with reduction to 420 million. Liability could be defined with context of any legal financial
debts or organizations which might arise because of specific course of operations of business. In
⊘ This is a preview!⊘
Do you want full access?
Subscribe today to unlock all pages.
Trusted by 1+ million students worldwide
this context, provision could be able to achieve criteria because of presence of estimation which
had been specified with context of amount
QUESTION 4
4.1 Interpretation of Statement of cash flows
4.1 (a) Significance of cash inflow from operating activities
The necessity of cash inflow through different operations as any organization had gained
huge income and expenses from operation so it should be capable for control its cost of
operations. The cash flow should be managed as if in any situation, company fails to meet its
obligations because of insolvency then they would be facing difficulty for different problems.
4.1 (b) Reason for adjustment like depreciation
The statement of cash flow includes various adjustments which are excluded from profit
and loss statements, but cash flow helps in constituting actual value of organization's finance and
for knowing actual value which had been gained or reduced by company.
4.2 Analysing cash and cash equivalents along with capability for generating cash resources
4.2 (a) Reason for decrement for 2016 to 2017 in cash and cash equivalents
There was huge difference of cash and cash equivalents as it was in negative aspect due
to huge cash flow of financing cost. There was presence of proceeds with context of issuing
share capital along with huge long term borrowings for raising finance (Bartram and Grinblatt,
2018).
4.2 (b) Practical implications for increment of cash and cash equivalents
The main objective for improving cash and cash equivalent could be reduce its finance
cost along with administration cost in context of decreasing long term borrowing. If admin
expenses are reduced, profits would go up which would lead to increased income tax. Increasing
profits, it would lead to increased cash inflow.
Paraphrase This Document
Need a fresh take? Get an instant paraphrase of this document with our AI Paraphraser
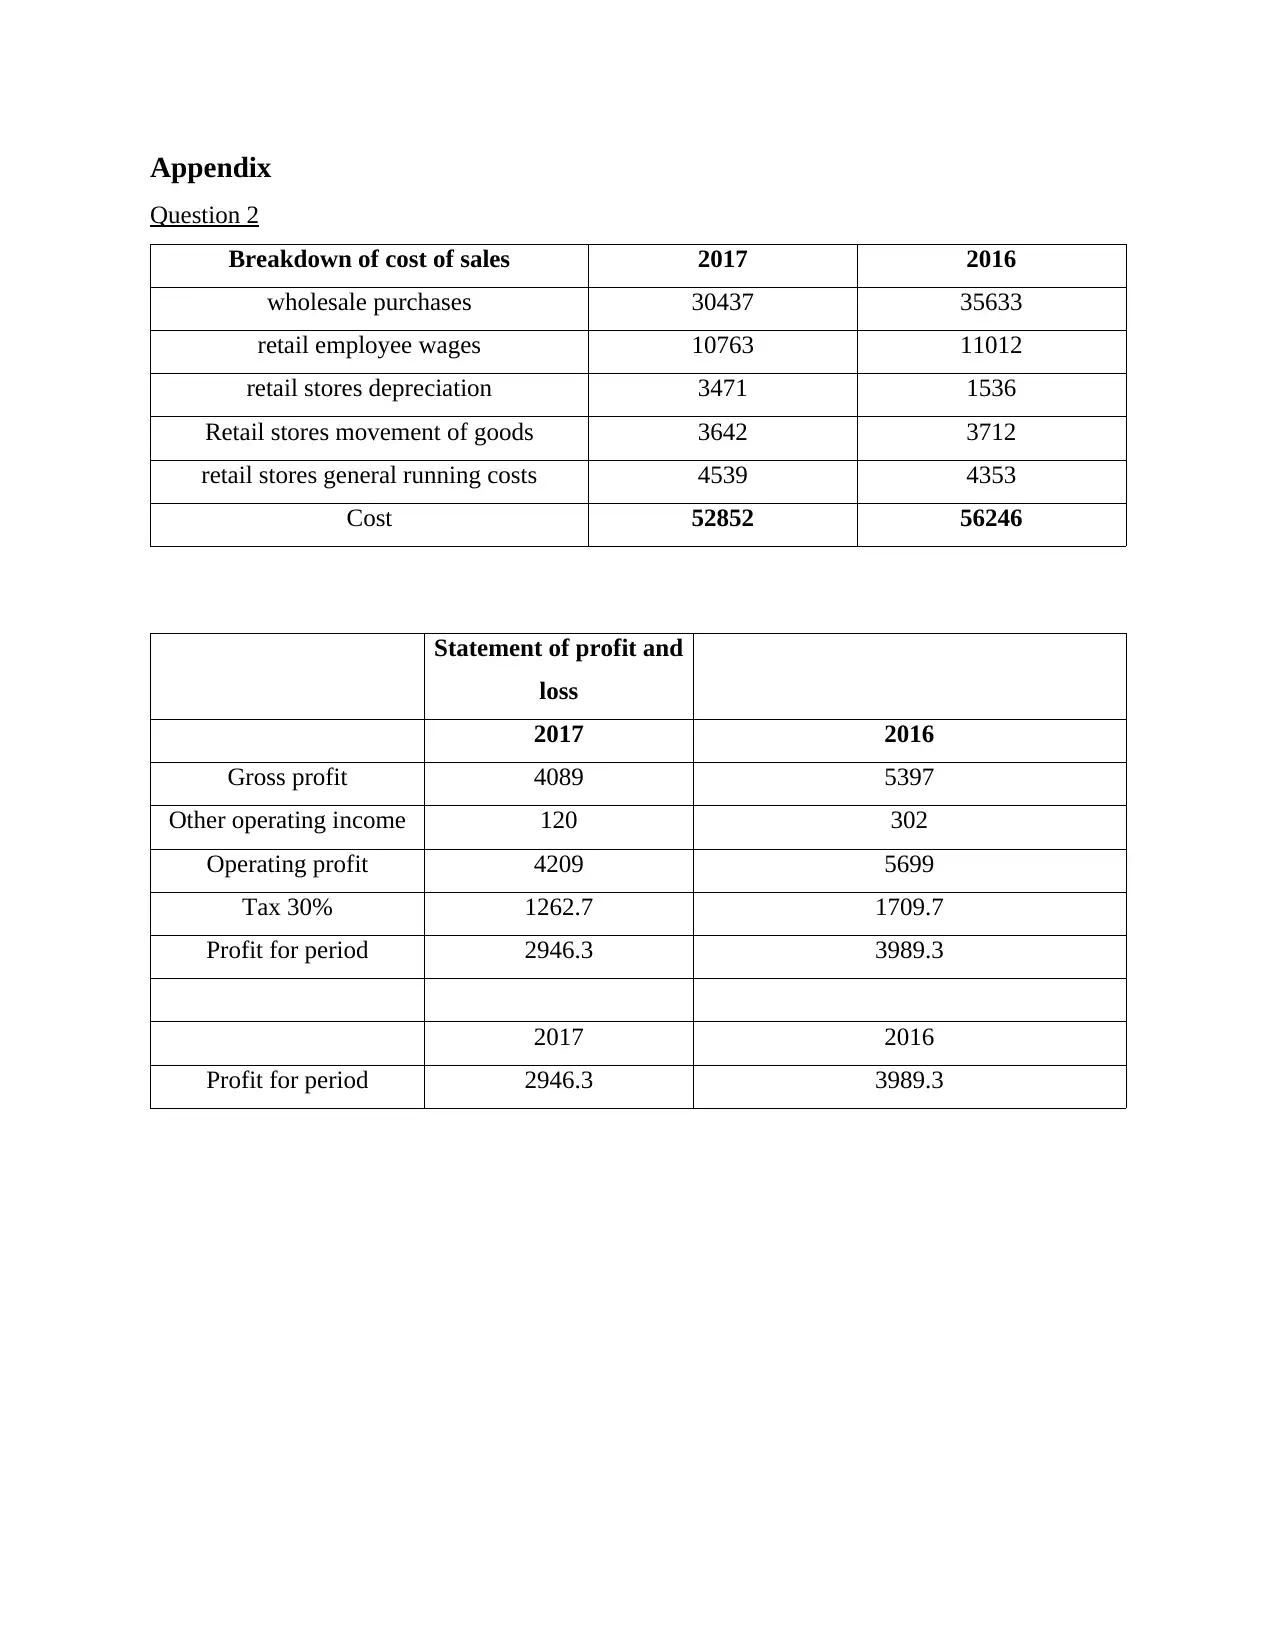
Appendix
Question 2
Breakdown of cost of sales 2017 2016
wholesale purchases 30437 35633
retail employee wages 10763 11012
retail stores depreciation 3471 1536
Retail stores movement of goods 3642 3712
retail stores general running costs 4539 4353
Cost 52852 56246
Statement of profit and
loss
2017 2016
Gross profit 4089 5397
Other operating income 120 302
Operating profit 4209 5699
Tax 30% 1262.7 1709.7
Profit for period 2946.3 3989.3
2017 2016
Profit for period 2946.3 3989.3
REFERENCES
Books and Journals
Bartram, S. M. and Grinblatt, M., 2018. Agnostic fundamental analysis works. Journal of
Financial Economics. 128(1). pp.125-147.
Damodaran, A., 2016. Damodaran on valuation: security analysis for investment and corporate
finance (Vol. 324). John Wiley & Sons.
Drake, M. S., Quinn, P. J. and Thornock, J. R., 2017. Who uses financial statements? a
demographic analysis of financial statement downloads from edgar. Accounting
Horizons. 31(3). pp.55-68.
Minnis, M. and Sutherland, A., 2017. Financial statements as monitoring mechanisms: Evidence
from small commercial loans. Journal of Accounting Research. 55(1). pp.197-233.
Weygandt, J. J., Kimmel, P. D. and Kieso, D. E., 2015. Financial & managerial accounting. John
Wiley & Sons.
ONLINE
Loan Payment. 2018. [Online]. Available through :<https://www.accountingcoach.com/blog/is-
loan-payment-expense>.
⊘ This is a preview!⊘
Do you want full access?
Subscribe today to unlock all pages.
Trusted by 1+ million students worldwide
1 out of 12
Related Documents


Your All-in-One AI-Powered Toolkit for Academic Success.
+13062052269
info@desklib.com
Available 24*7 on WhatsApp / Email
![[object Object]](/_next/static/media/star-bottom.7253800d.svg)
Unlock your academic potential
Copyright © 2020–2026 A2Z Services. All Rights Reserved. Developed and managed by ZUCOL.