DIBD Report: Exploring Quantitative and Qualitative Research Methods
VerifiedAdded on 2023/06/10
|14
|1565
|266
Report
AI Summary
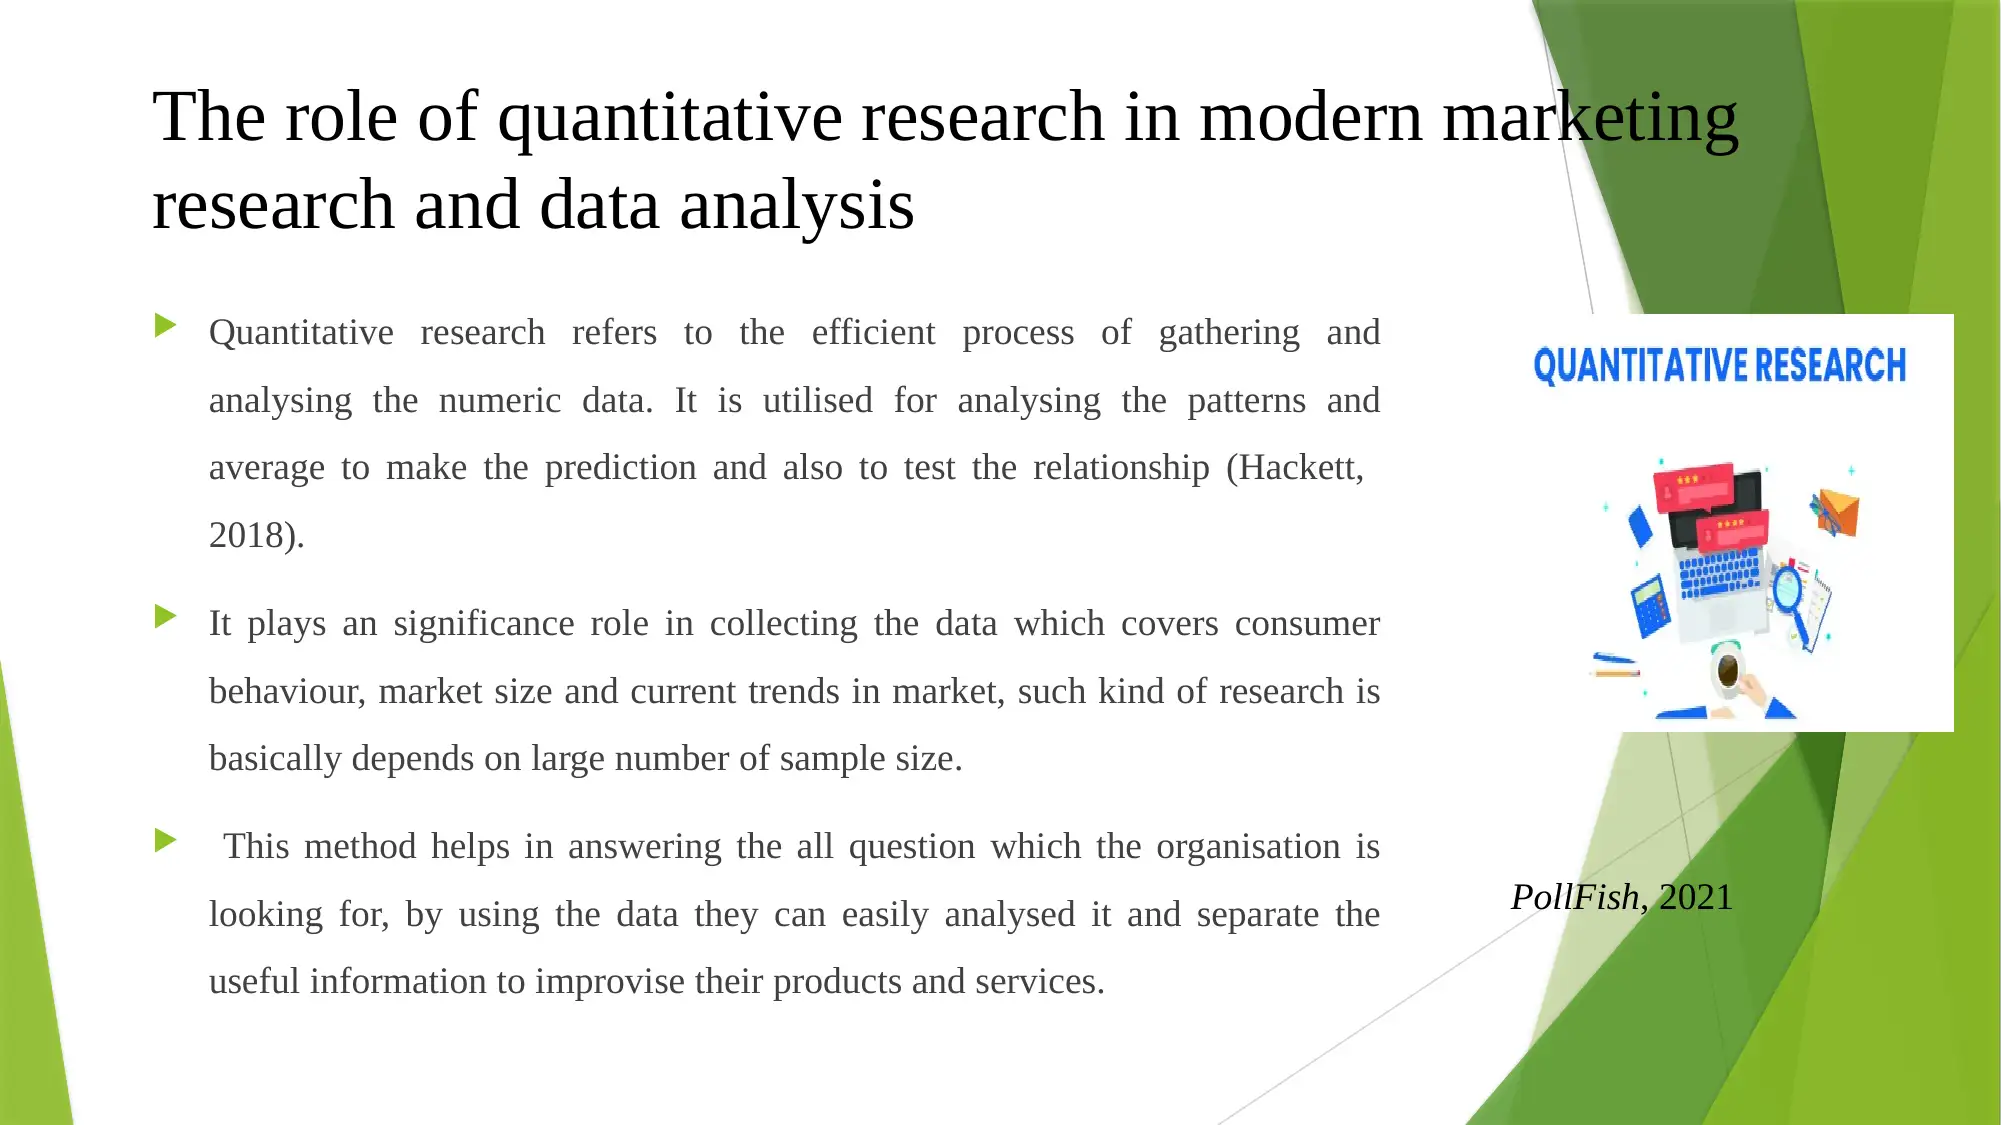
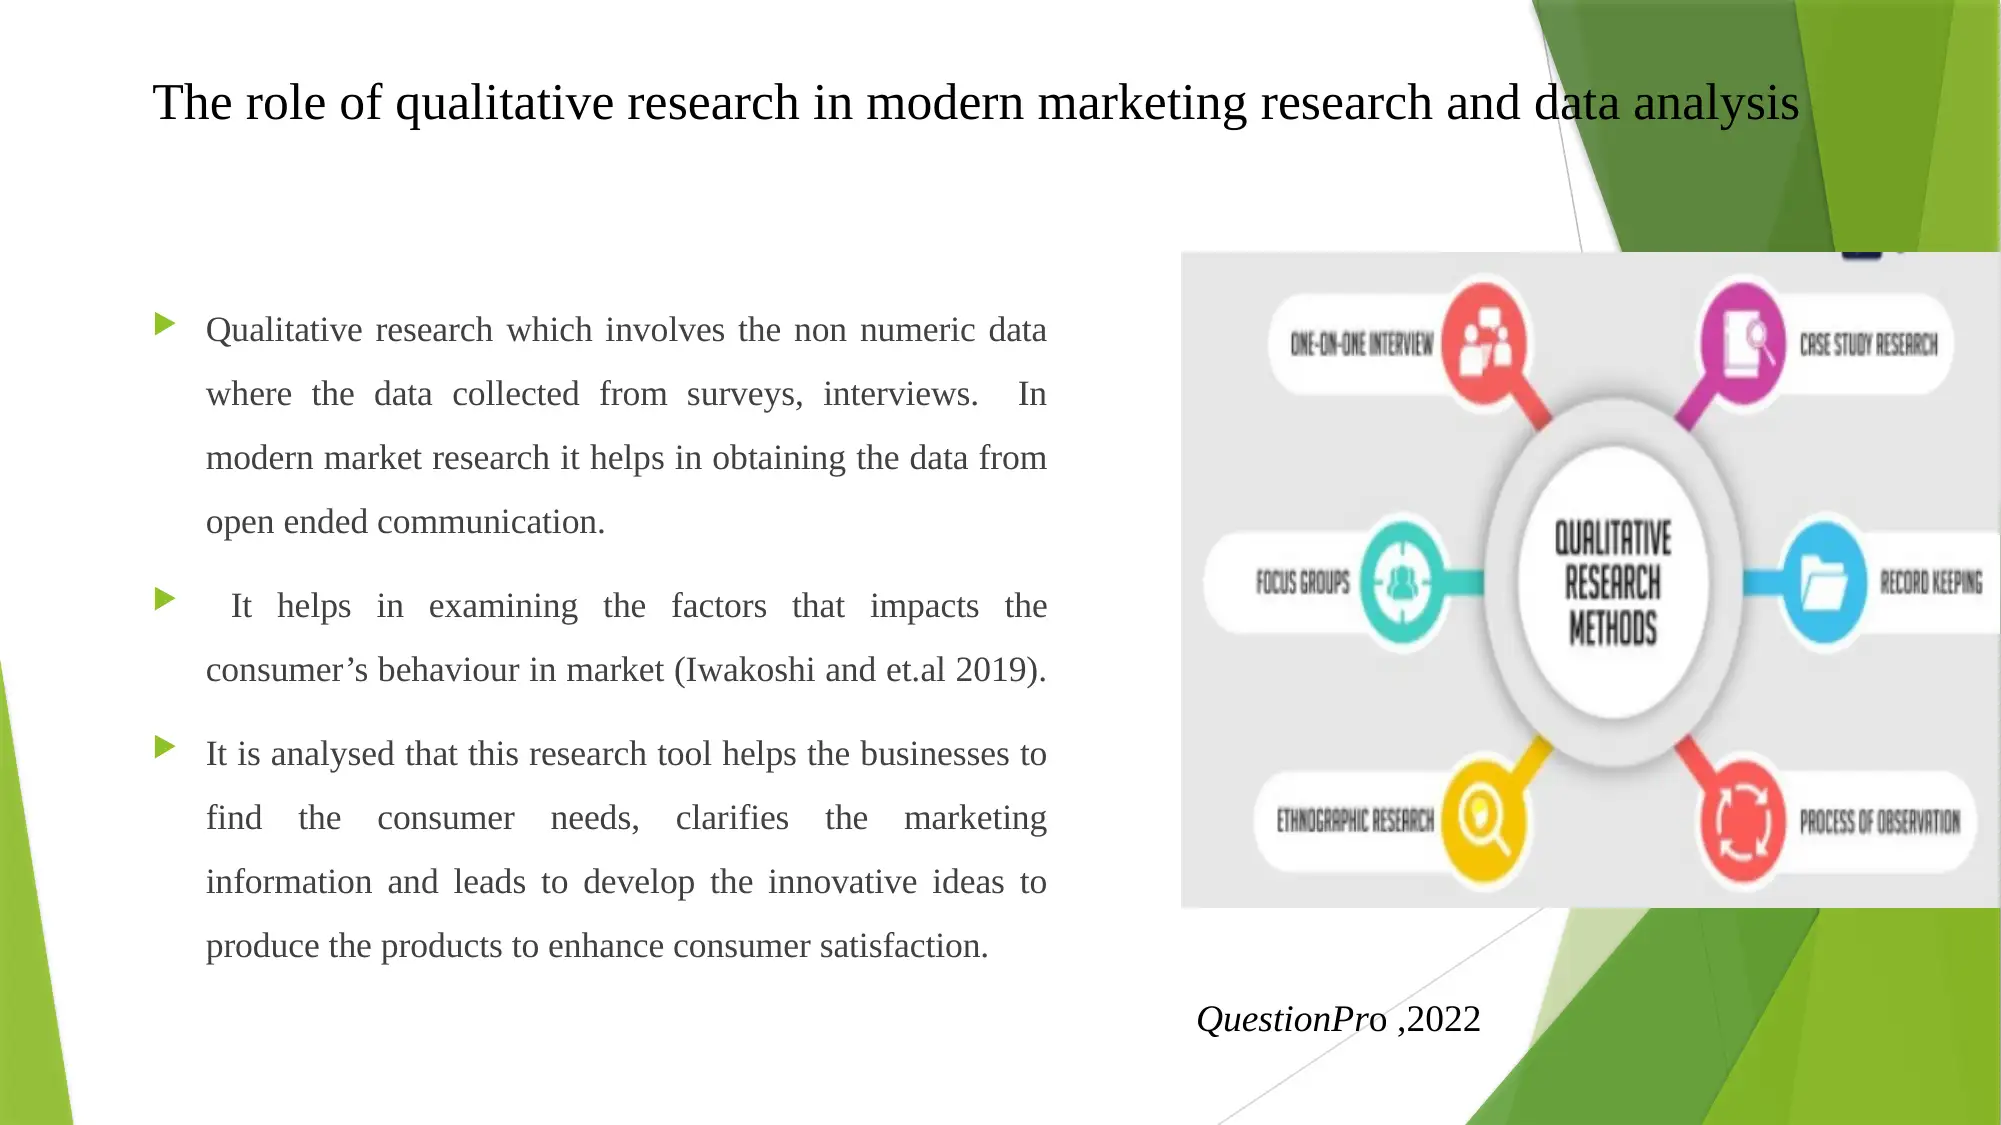
This report provides a comprehensive analysis of quantitative and qualitative research methods in business development. It explores the roles of quantitative market research, emphasizing the importance of questionnaire design, and delves into qualitative research, highlighting the use of discussion guides. The report also covers correlation, regression, and time series analysis, discussing their limitations and offering insights on improving data collection for informed business decisions. Furthermore, it examines the application of these techniques in the context of big data and their impact on business decision-making, concluding with the importance of integrating both research approaches for a holistic understanding of market dynamics and consumer behavior. This resource is available on Desklib, a platform offering study tools, past papers, and solved assignments for students.

DIBD
Paraphrase This Document
Need a fresh take? Get an instant paraphrase of this document with our AI Paraphraser

Introduction
Roles of quantitative market research in business
Importance of relevant questionnaire design
Role of Qualitative research in Business
Importance of discussion guide and use
Correlation. Regression. And Time Series Analysis
Limitations of Correlation, regression
How to improve collecting Data (when the data is required to make business decisions)

The role of quantitative research in modern marketing
research and data analysis
Quantitative research refers to the efficient process of gathering and
analysing the numeric data. It is utilised for analysing the patterns and
average to make the prediction and also to test the relationship (Hackett,
2018).
It plays an significance role in collecting the data which covers consumer
behaviour, market size and current trends in market, such kind of research is
basically depends on large number of sample size.
This method helps in answering the all question which the organisation is
looking for, by using the data they can easily analysed it and separate the
useful information to improvise their products and services.
PollFish, 2021
⊘ This is a preview!⊘
Do you want full access?
Subscribe today to unlock all pages.

Trusted by 1+ million students worldwide

The role of quantitative research: Questionnaire design with examples of good
practice
There are some good practice which is required in designing questionnaire which are as follows:
Brevity: It is refer as quality of being concise and brief, it is important that questions are brief and can be
easily understood. Use the language which enables the respondents to complete questionnaire rapidly.
Clarity and consistency: Questions must be clear and unambiguous, for this it is recommended to phrase the
questions verifiably and try to not use unnecessary adjectives.
Prestige bias: This will guides the participants to answer the question in a specific manner by confirming the
social norms.
Double barrelling: If the wordings in question is split down into other question then it will be complex to
record the response and often leads to ambiguity. Therefore it is recommended to involve only one variable at
a time for every questions.
Paraphrase This Document
Need a fresh take? Get an instant paraphrase of this document with our AI Paraphraser

The role of qualitative research in modern marketing research and data analysis
Qualitative research which involves the non numeric data
where the data collected from surveys, interviews. In
modern market research it helps in obtaining the data from
open ended communication.
It helps in examining the factors that impacts the
consumer’s behaviour in market (Iwakoshi and et.al 2019).
It is analysed that this research tool helps the businesses to
find the consumer needs, clarifies the marketing
information and leads to develop the innovative ideas to
produce the products to enhance consumer satisfaction.
QuestionPro ,2022

The role of qualitative research. The Interview Discussion guide: design & use (with
examples)
Generally there are three type of interview method that is used in qualitative
research which are structured, semi structured and unstructured.
In this structured interviews involves the number of questions that are
required to asked in particular order which increases the credibility and
reliability of data.
While in unstructured interview researcher have the topic list but there is no
pre identified question (Richard and et.al 2021). It aims to enhance the
interview flexibility, in semi structured interview where the list of question
as well as topic are already prepared. Semi structured interview is efficient
as it enhance the flexibility as well as responsiveness.
⊘ This is a preview!⊘
Do you want full access?
Subscribe today to unlock all pages.

Trusted by 1+ million students worldwide

Correlation & Regression:
How & why it is used - with examples
Correlation refers to the statistical measurement for identifying the relation between
the different variables.
While regression helps in examining how numerically one independent variable is
associated with the dependent variable.
In research association degree is constant by correlation coefficient which is
represented as r, this coefficient is usually measured on scale which ranges from +1
to 0 to -1.
Reason for using the correlation is that it helps in providing the quick delivery as
well as simple and concise summary about the direction and the relationship among
the numeric variables. While regression can be used to make the prediction and to
examine the responses between the variables as how a affects the b
Key differences, 2021
Paraphrase This Document
Need a fresh take? Get an instant paraphrase of this document with our AI Paraphraser

Time series:
What it is & how it is used - with examples
Time series refers to the observation from order of time about
successive intervals, it is also termed as the running chart.
Time variable is the independent variable that aims to cooperate the
target changing variable for predicting the outcomes.
Time series also allows to view the elements that impacts the specific
variables in a certain period, it is beneficial as to view the asset,
security over the time.
For an example forecasting the costs for the stocks every day, another
example can be forecasting the sales of tech savvy product which is
sell for each day. CFI, 2022

Critique of issues surrounding the analysis techniques
One of the key issue faced by analysing big
data using regression analysis is that it used to
consider only linear relations.
Business decision making does not always
follow linear path and thus in real decision
making situation the analysis may impose
certain limitations (Cao and et.al 2019).
While analysing big data it is also possible that
some variables are not taken into consideration
thus it may have adverse impact upon quality of
decision making.
(Source: Kelman, A., 2016)
⊘ This is a preview!⊘
Do you want full access?
Subscribe today to unlock all pages.

Trusted by 1+ million students worldwide

Critique of issues surrounding the analysis techniques
The most prominent feature of time series analysis is that it helps
organisation to assess the index and trends over a particular time period.
Thus it is highly useful for monitoring and evaluation of performance over
fix time span (Prasad, 2019).
With big data analysis time series does not face any major challenges
because it deals with only single variable. However, if organisation decision
making process is based upon multiple factors which is in most of the cases
then it serve as limitation.
Though if time series is used with regression then its limitation can be
suppressed but it must be used along with the management information
system.
(Source: Jensen., Leverage
Your Data to Make Informed
Business Decisions, 2021)
Paraphrase This Document
Need a fresh take? Get an instant paraphrase of this document with our AI Paraphraser

How data can be collected & used to make informed business decisions
For achieving sustainable growth organisations must collect the reliable
data for which appropriate planning and techniques are needed.
The data collection techniques used for this purpose must meet the
organisational objectives, resources as well as purpose of data
collection.
When collecting data businesses must ensure that they used to
choose suitable method as well as type of both qualitative and
quantitative data. When data choices are clear then collection can be
made more feasible and reliable (Prasad, 2019).
(Source: Jensen., 2021)

Conclusion
From the above it is concluded that qualitative and quantitative research approach
helps in analysing the various market factor as to obtain the details which include the
consumer behaviour and current modern marketing trend.
It helps the businesses to improvise the services to provide better customer
satisfaction. It further illustrated the correlation and regression terms along with its
use, also discuss the description about time series.
⊘ This is a preview!⊘
Do you want full access?
Subscribe today to unlock all pages.

Trusted by 1+ million students worldwide
1 out of 14
Related Documents

Your All-in-One AI-Powered Toolkit for Academic Success.
+13062052269
info@desklib.com
Available 24*7 on WhatsApp / Email
Unlock your academic potential
Copyright © 2020–2025 A2Z Services. All Rights Reserved. Developed and managed by ZUCOL.