Nutrition Assessment: Analysis of Agnes' Diet and Recommendations

Verified

Added on  2022/10/13

|9
|2059
|66
Case Study
AI Summary
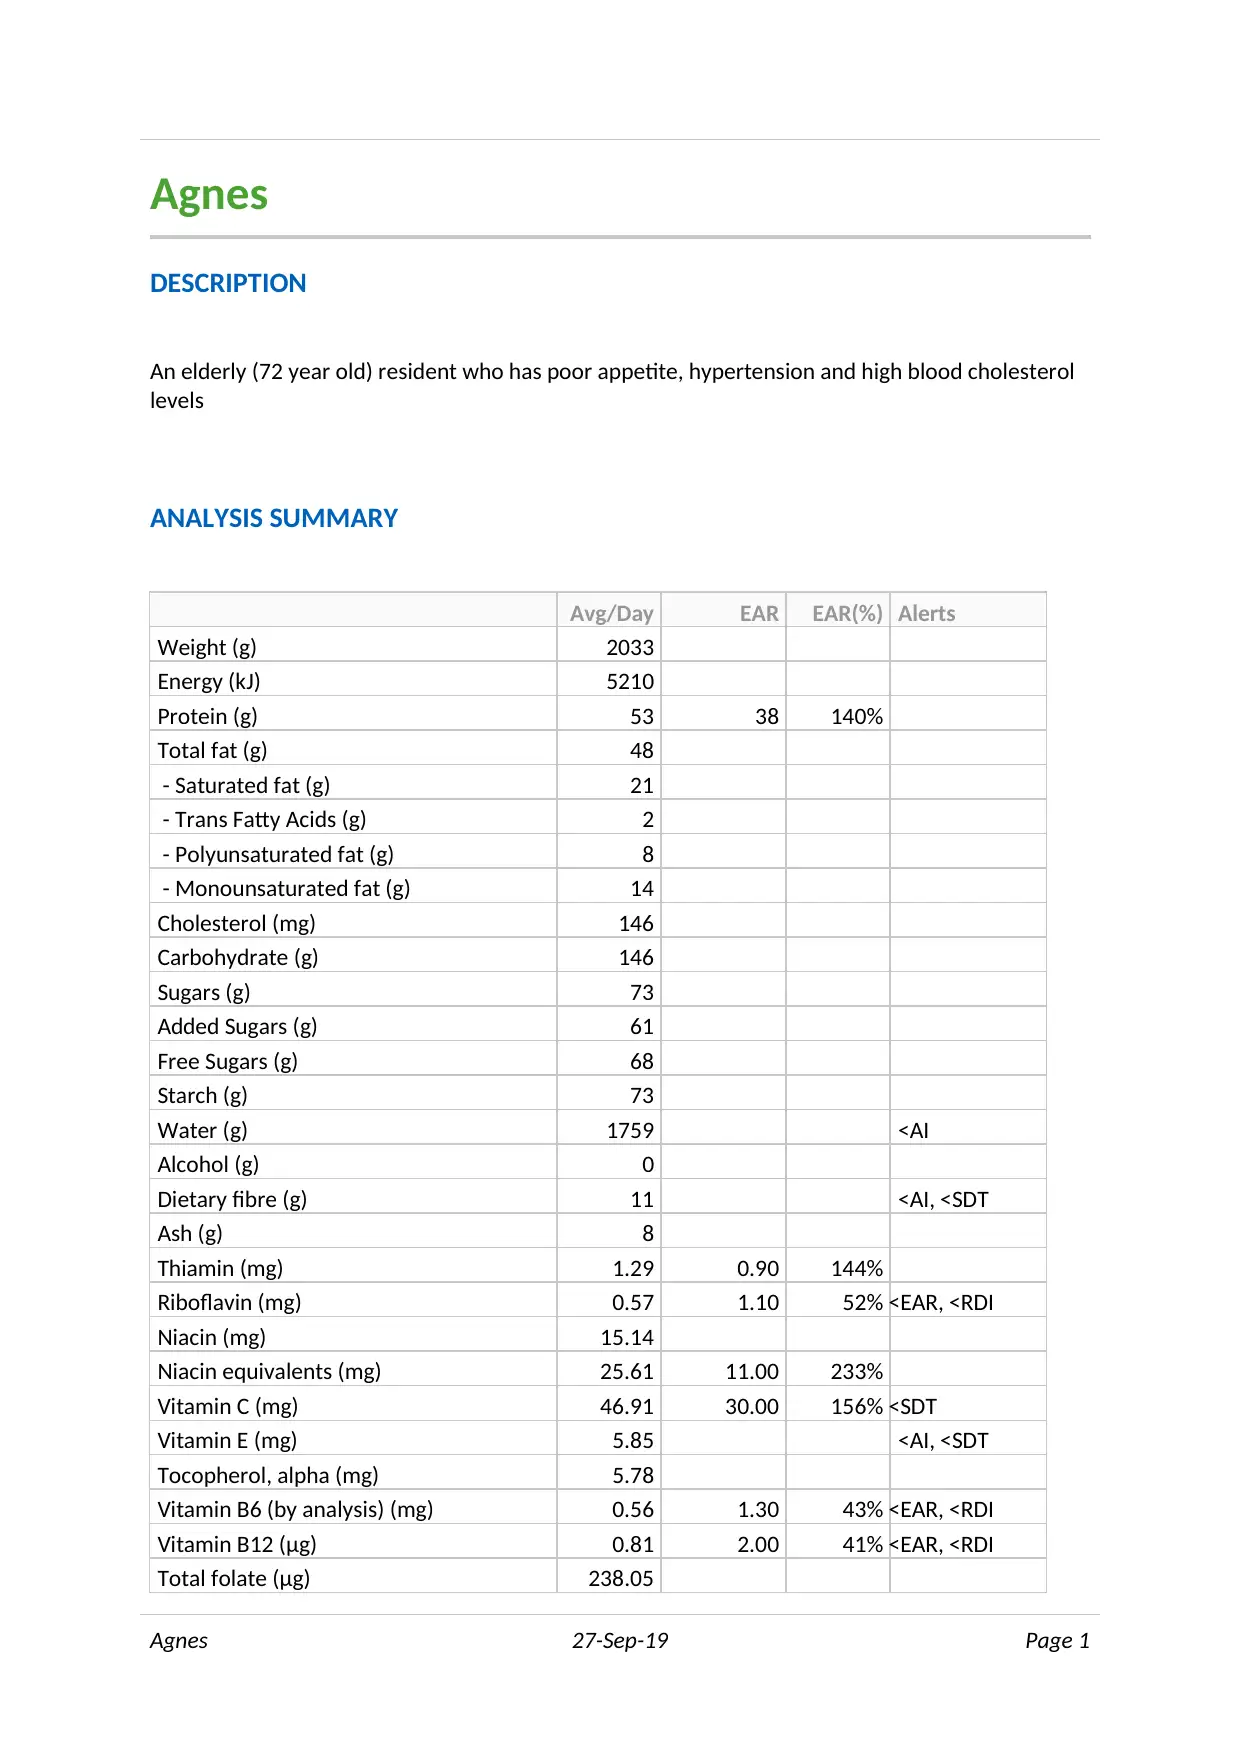
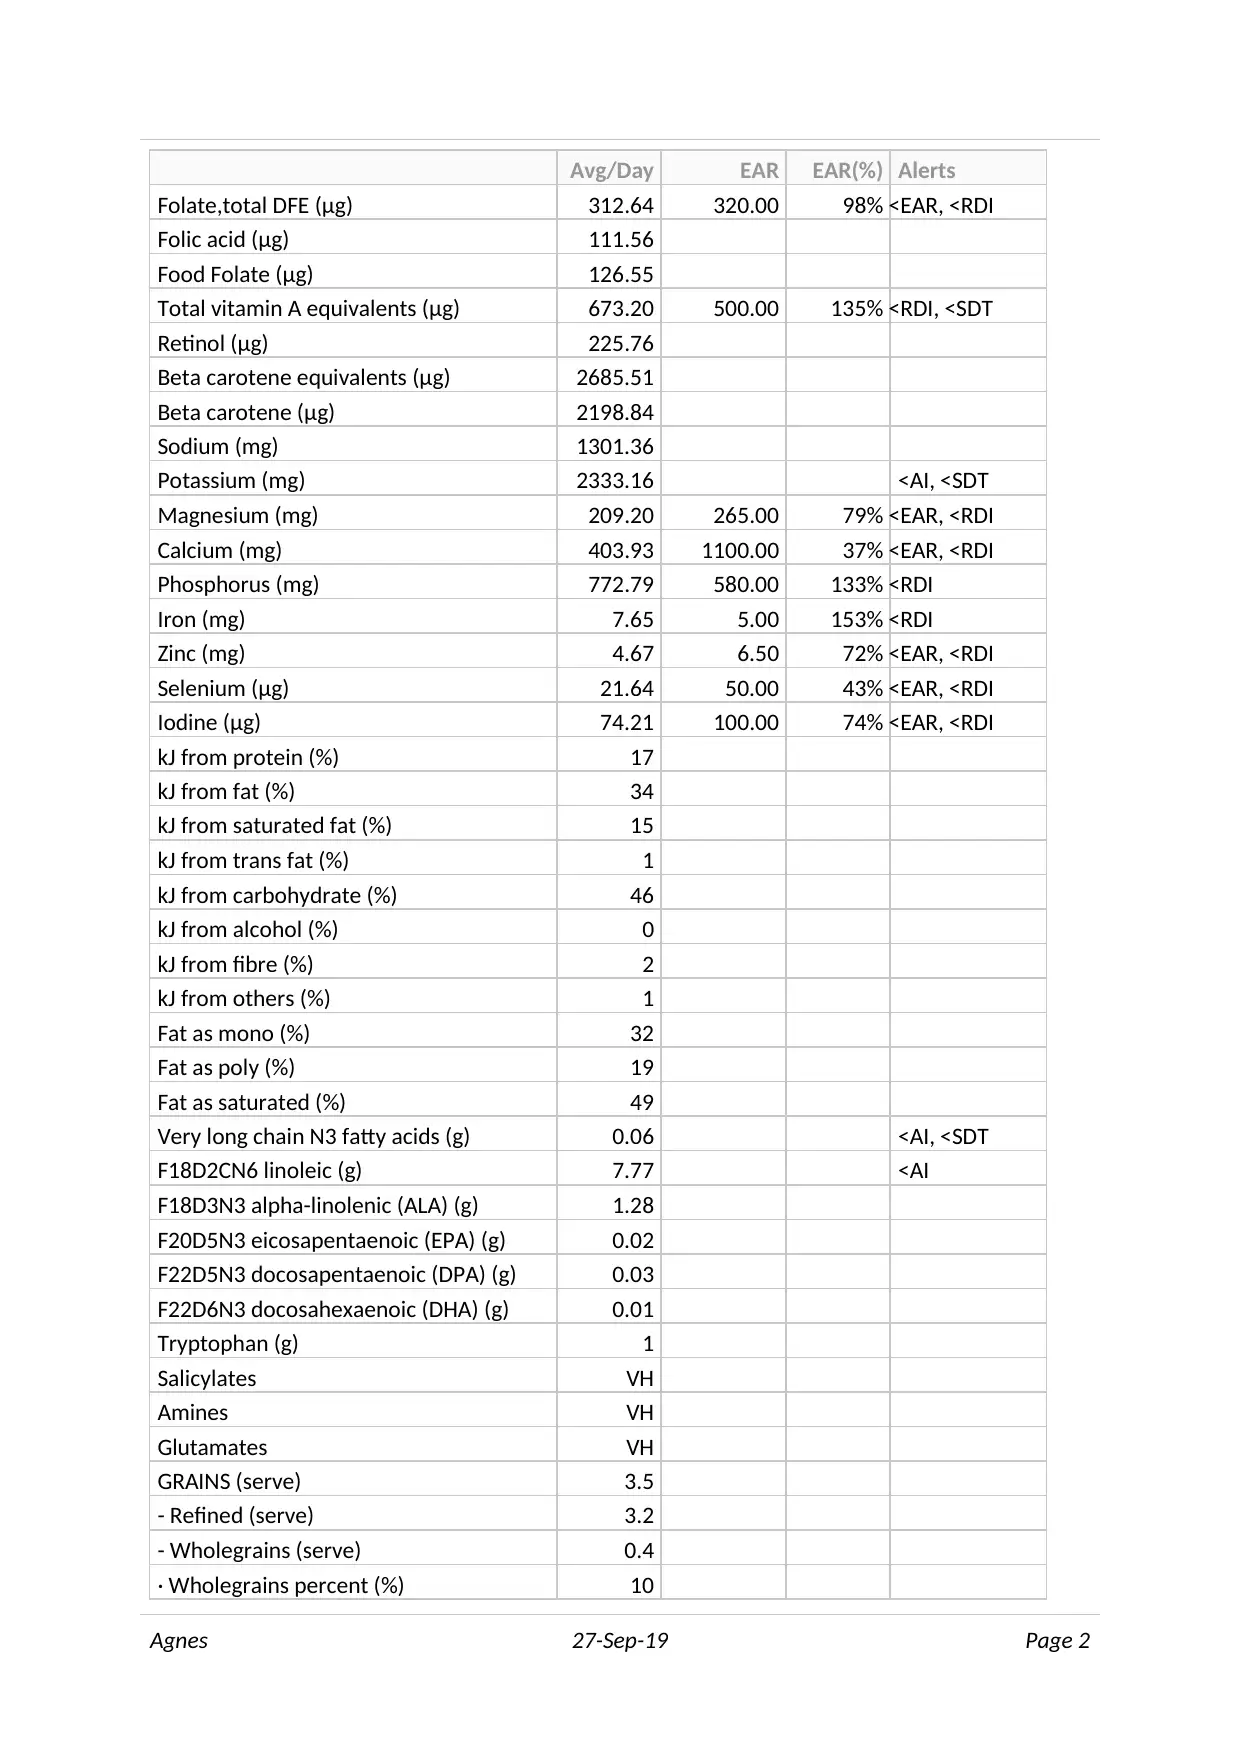
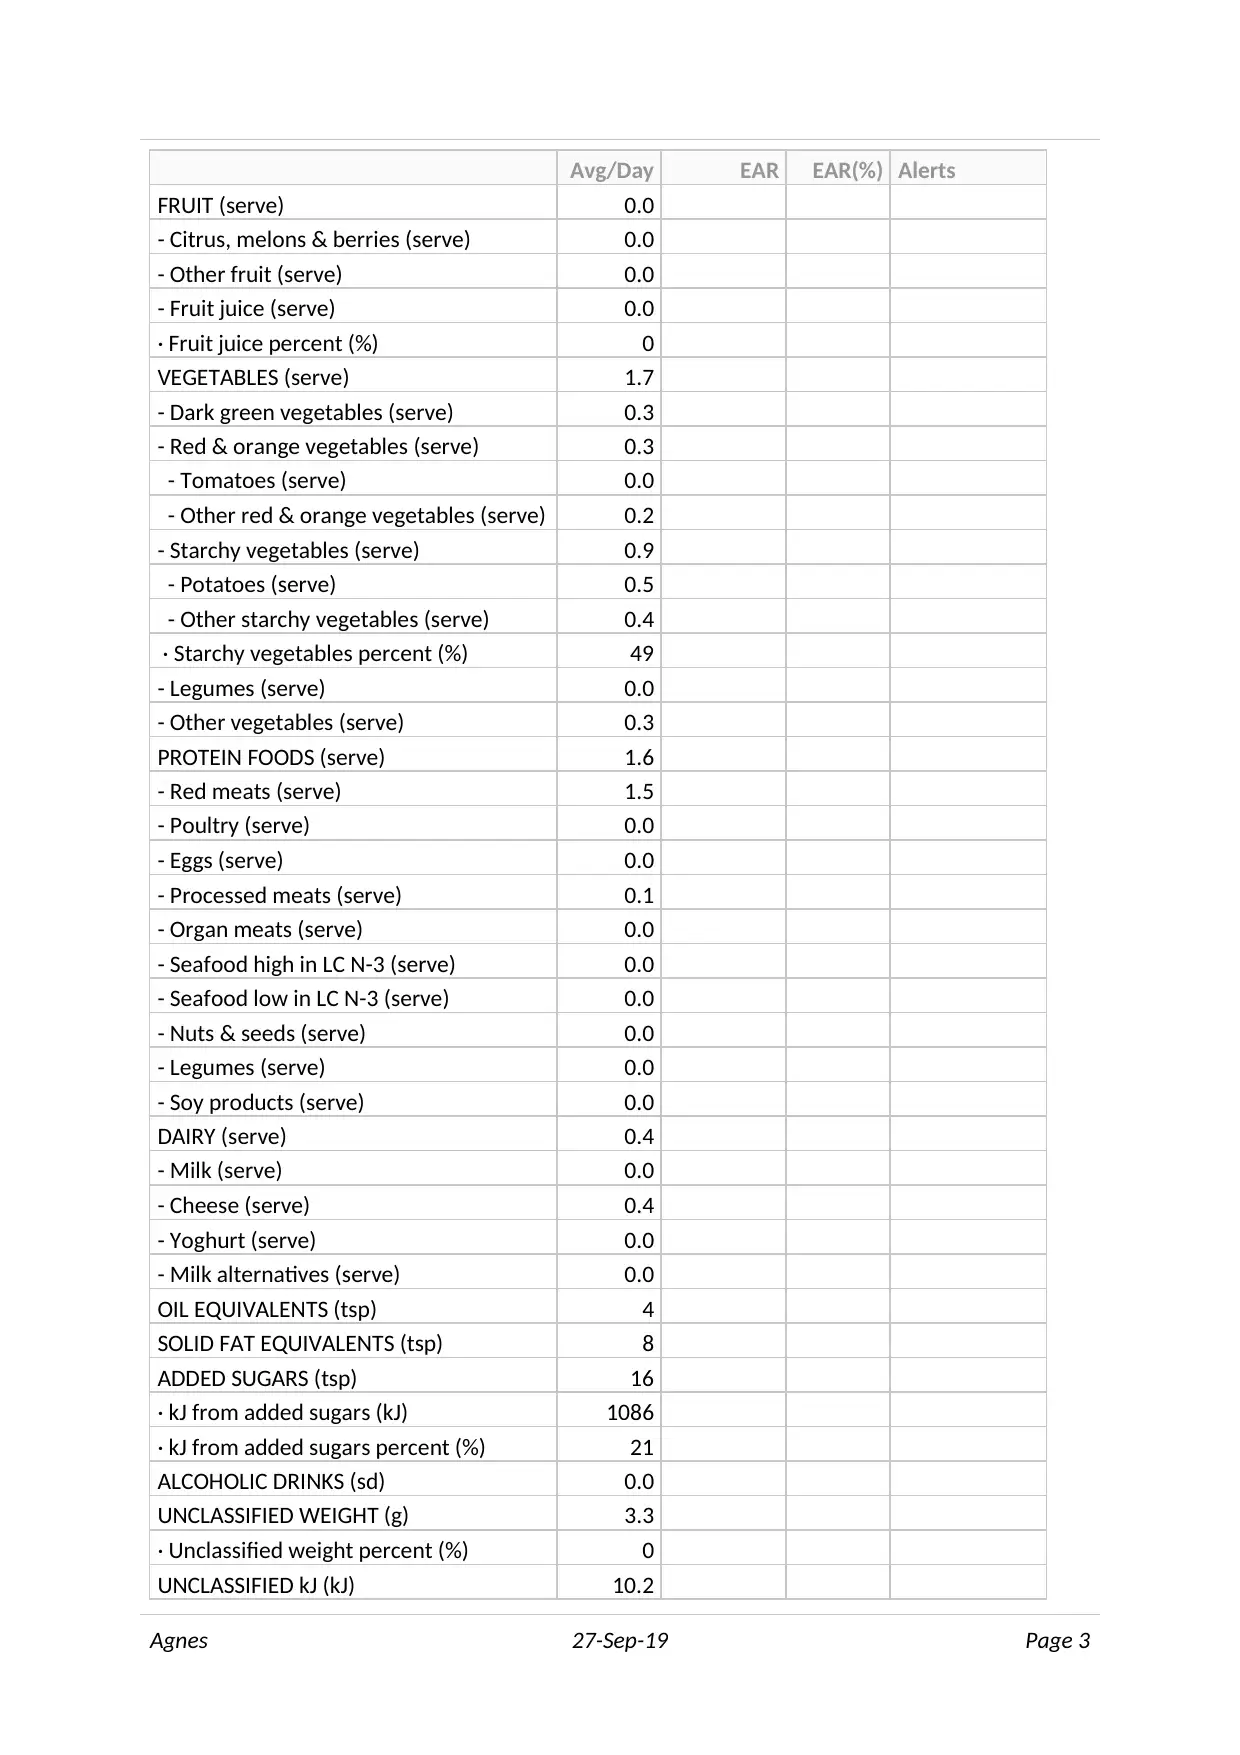
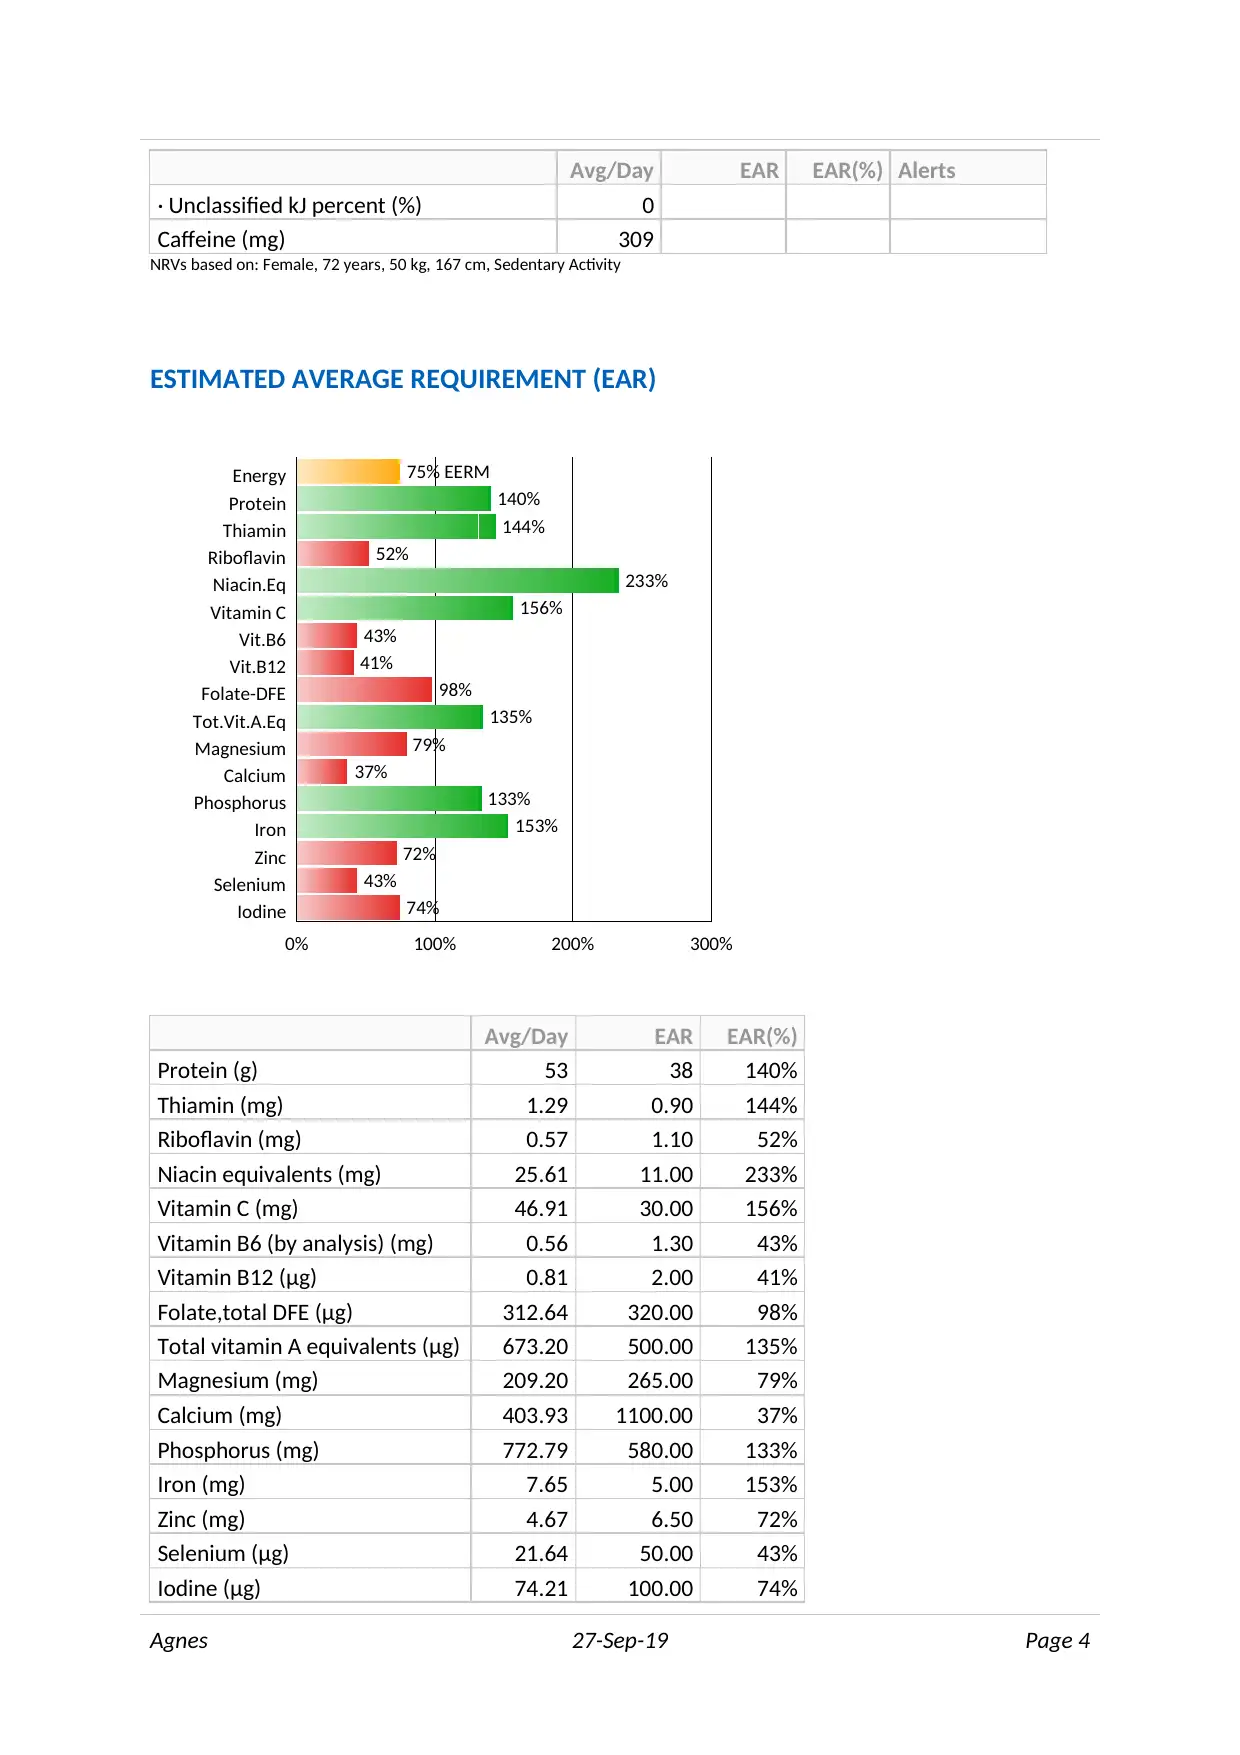
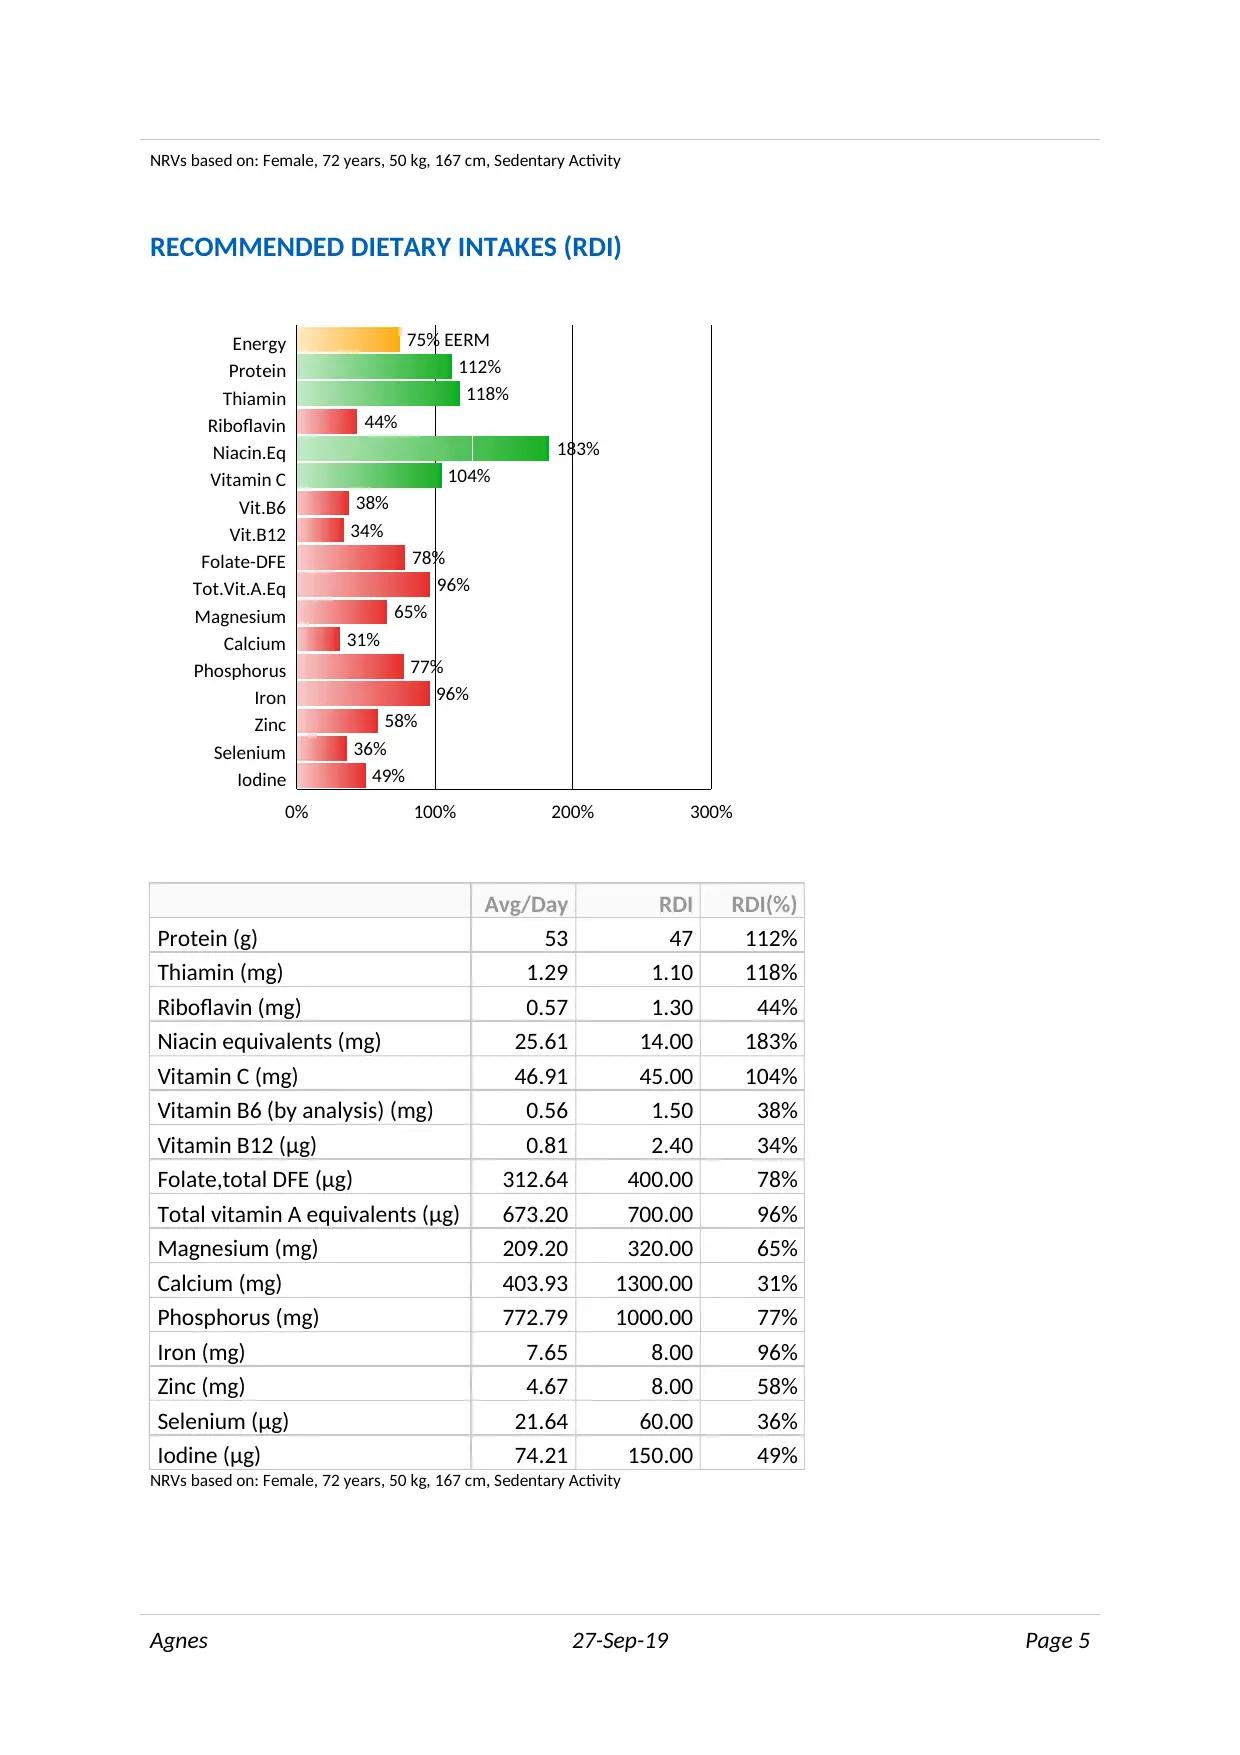
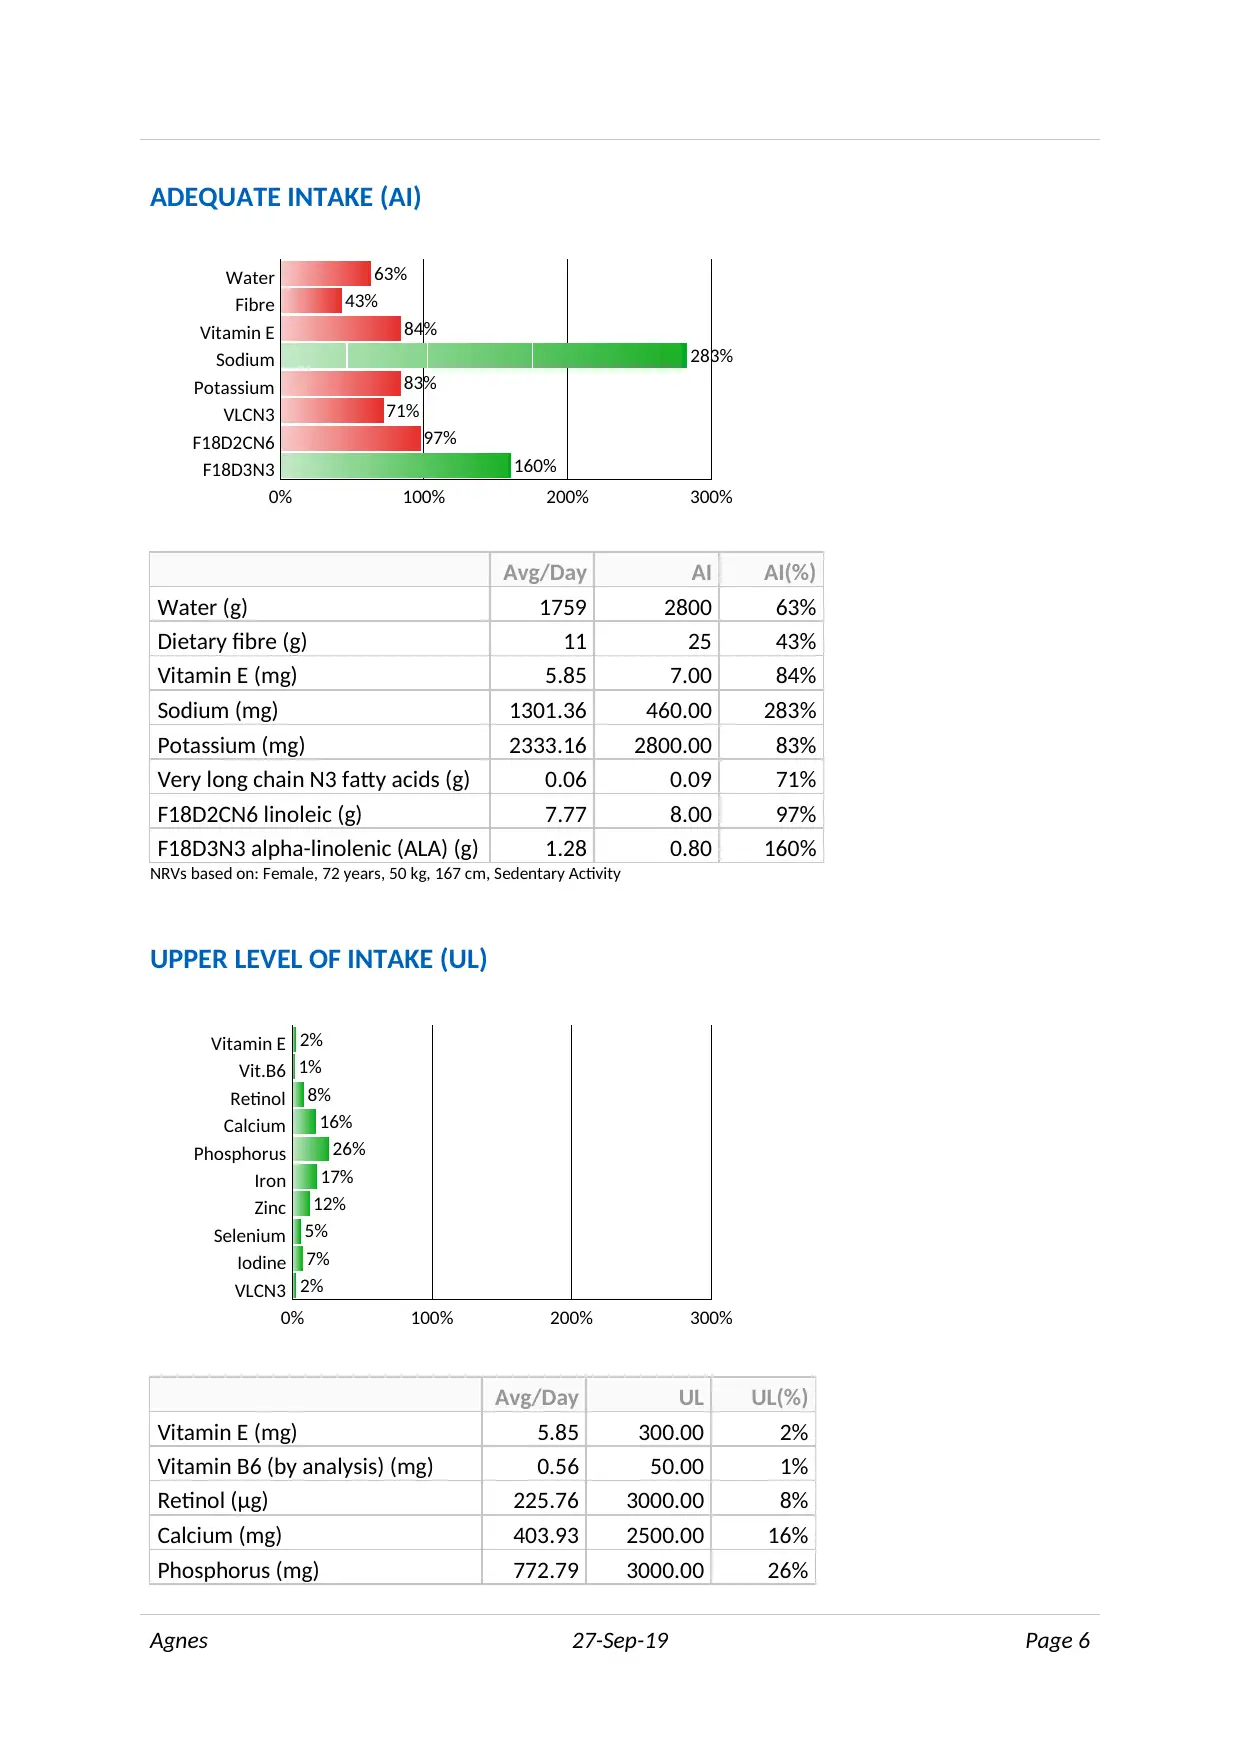
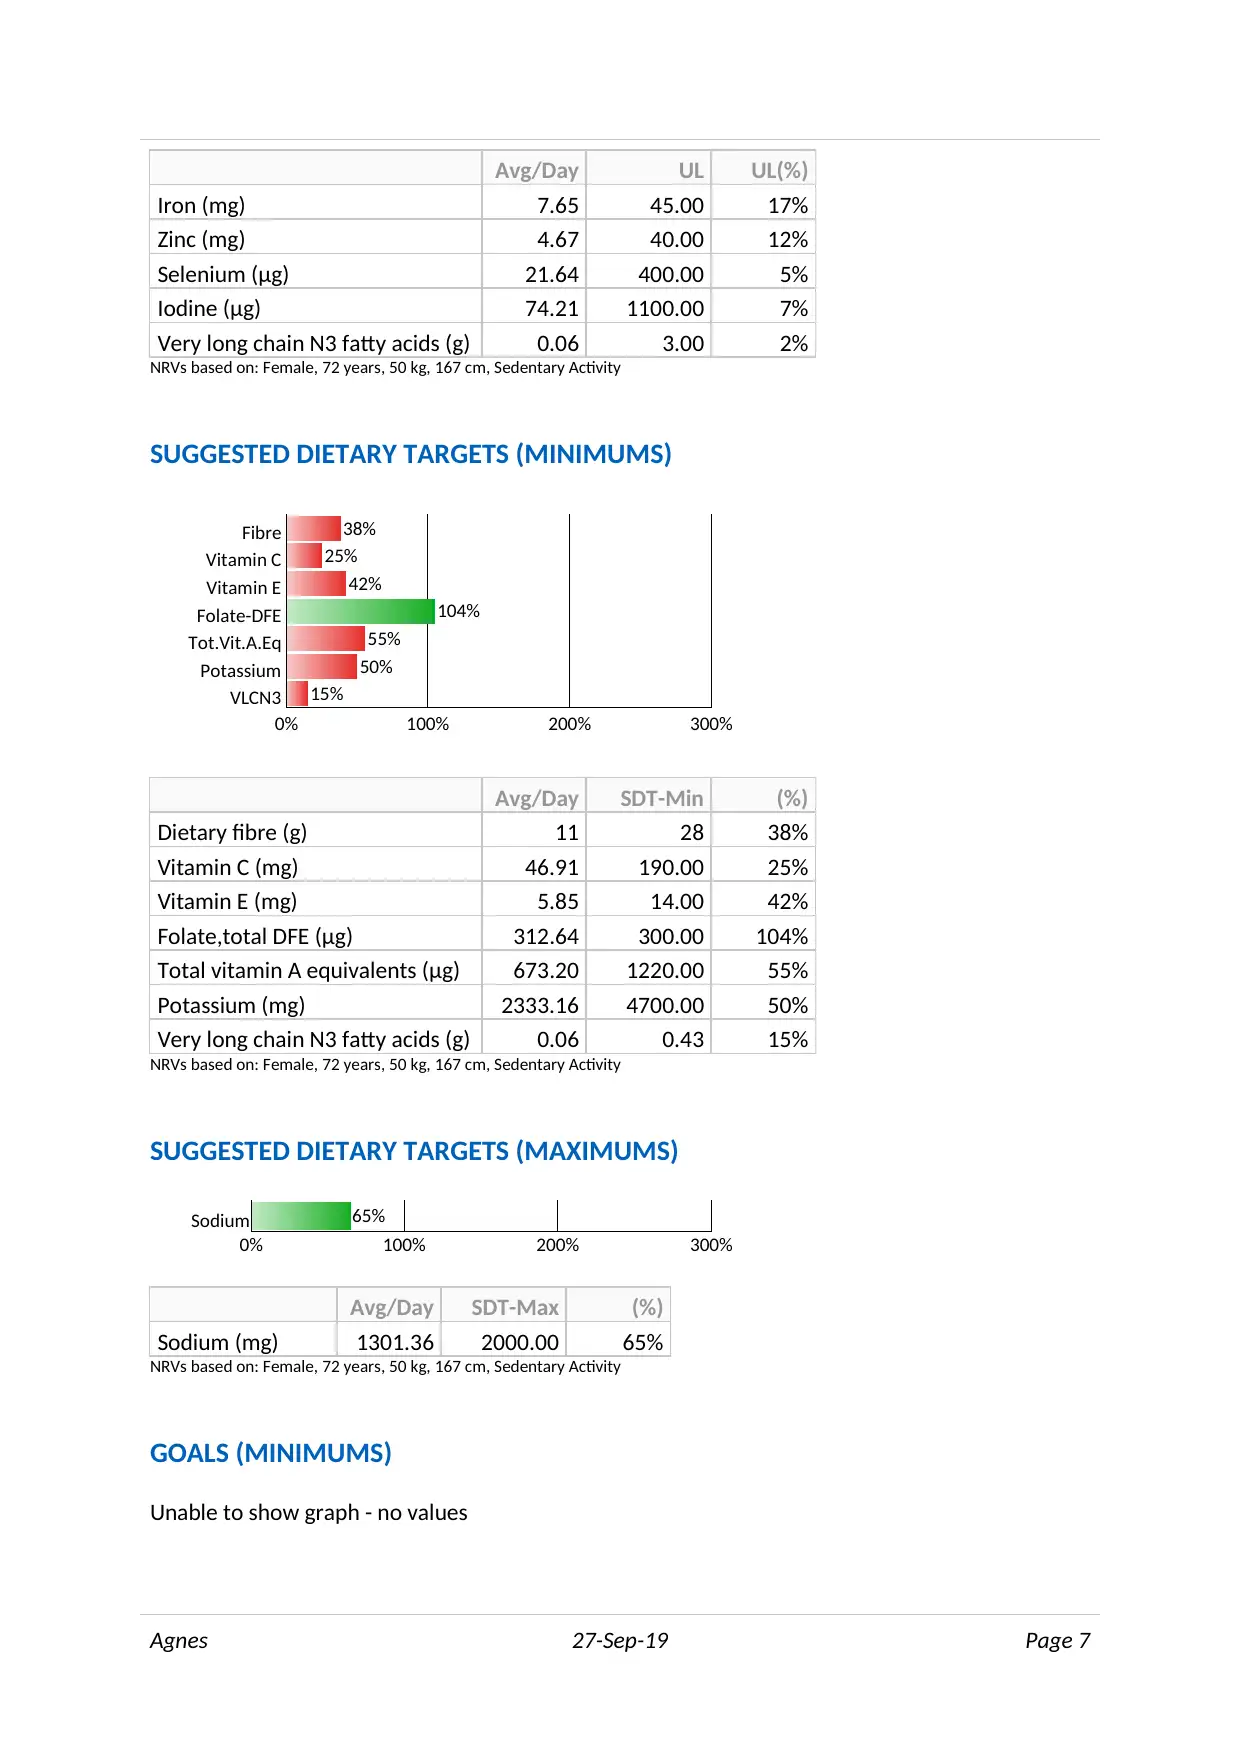
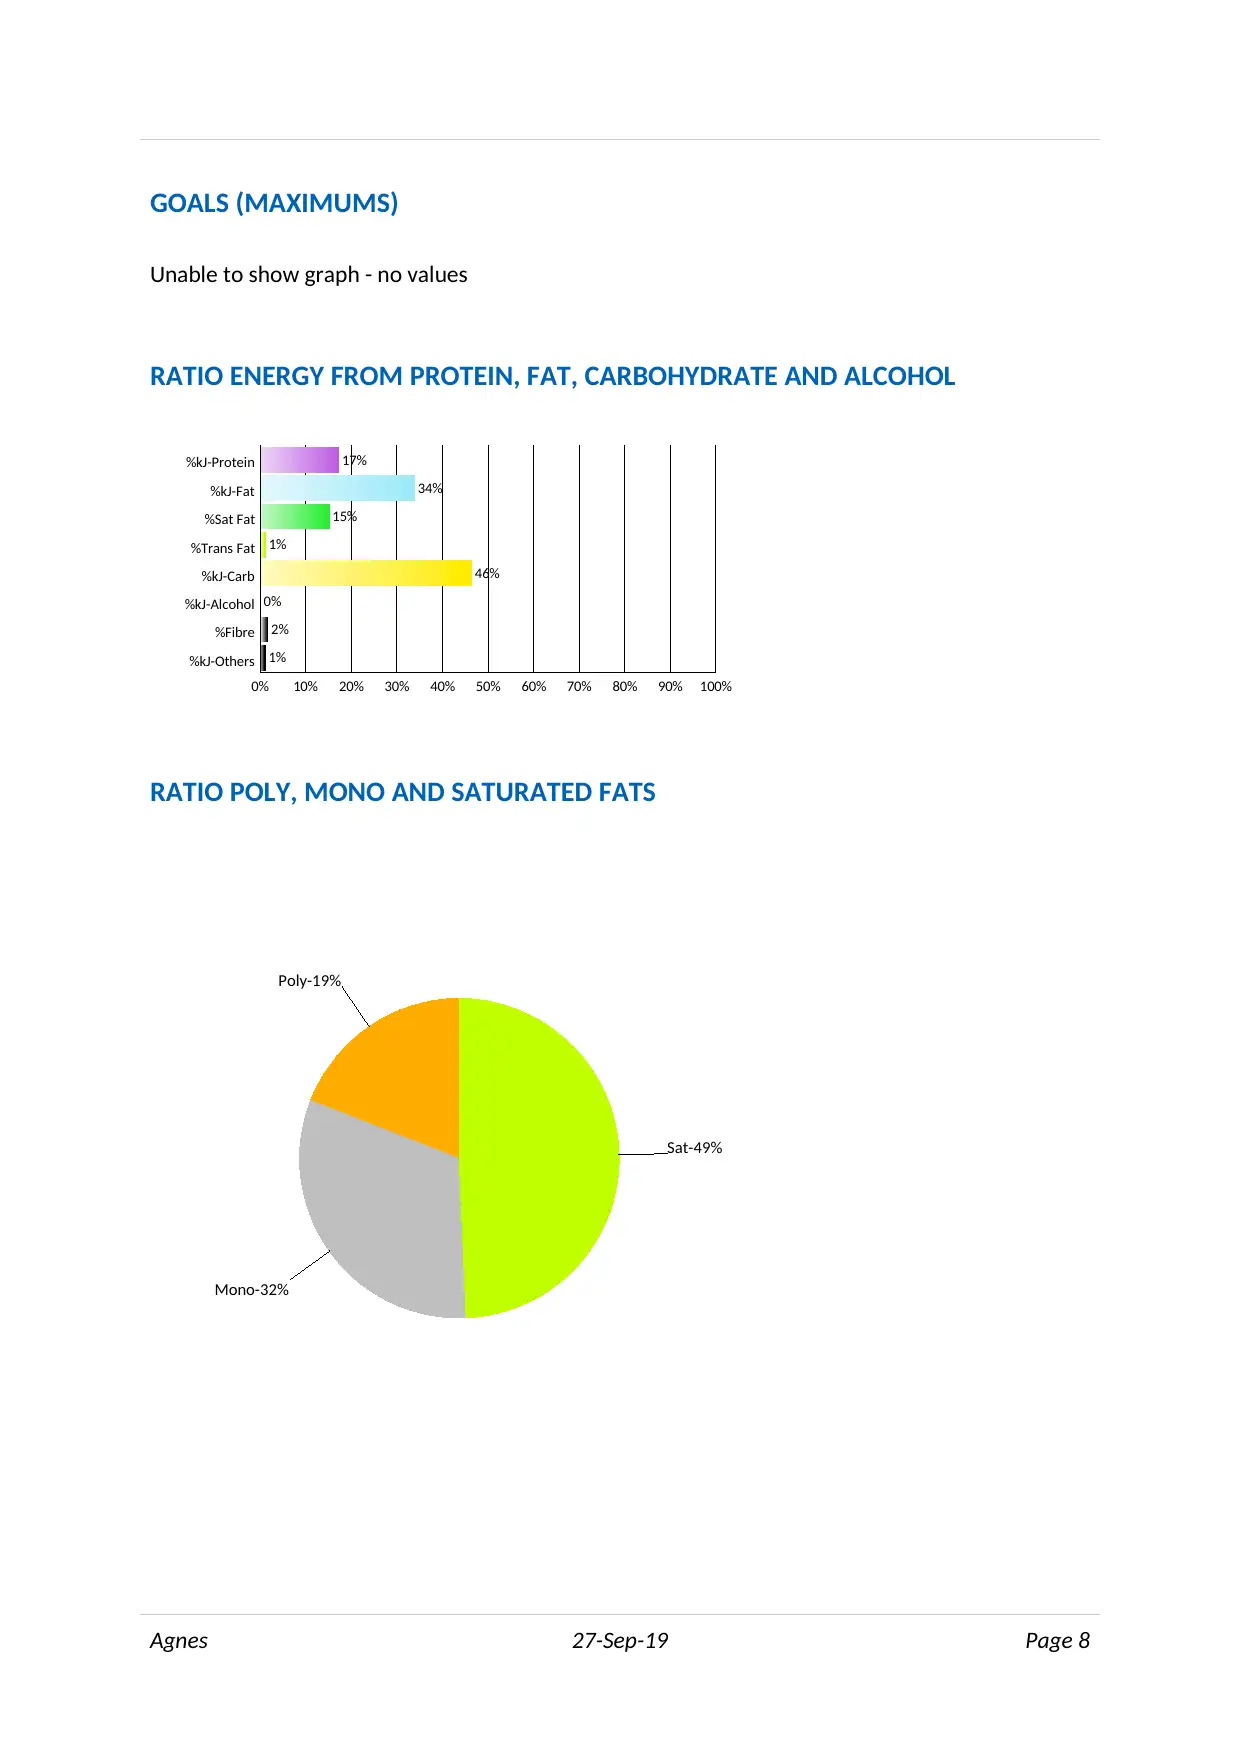
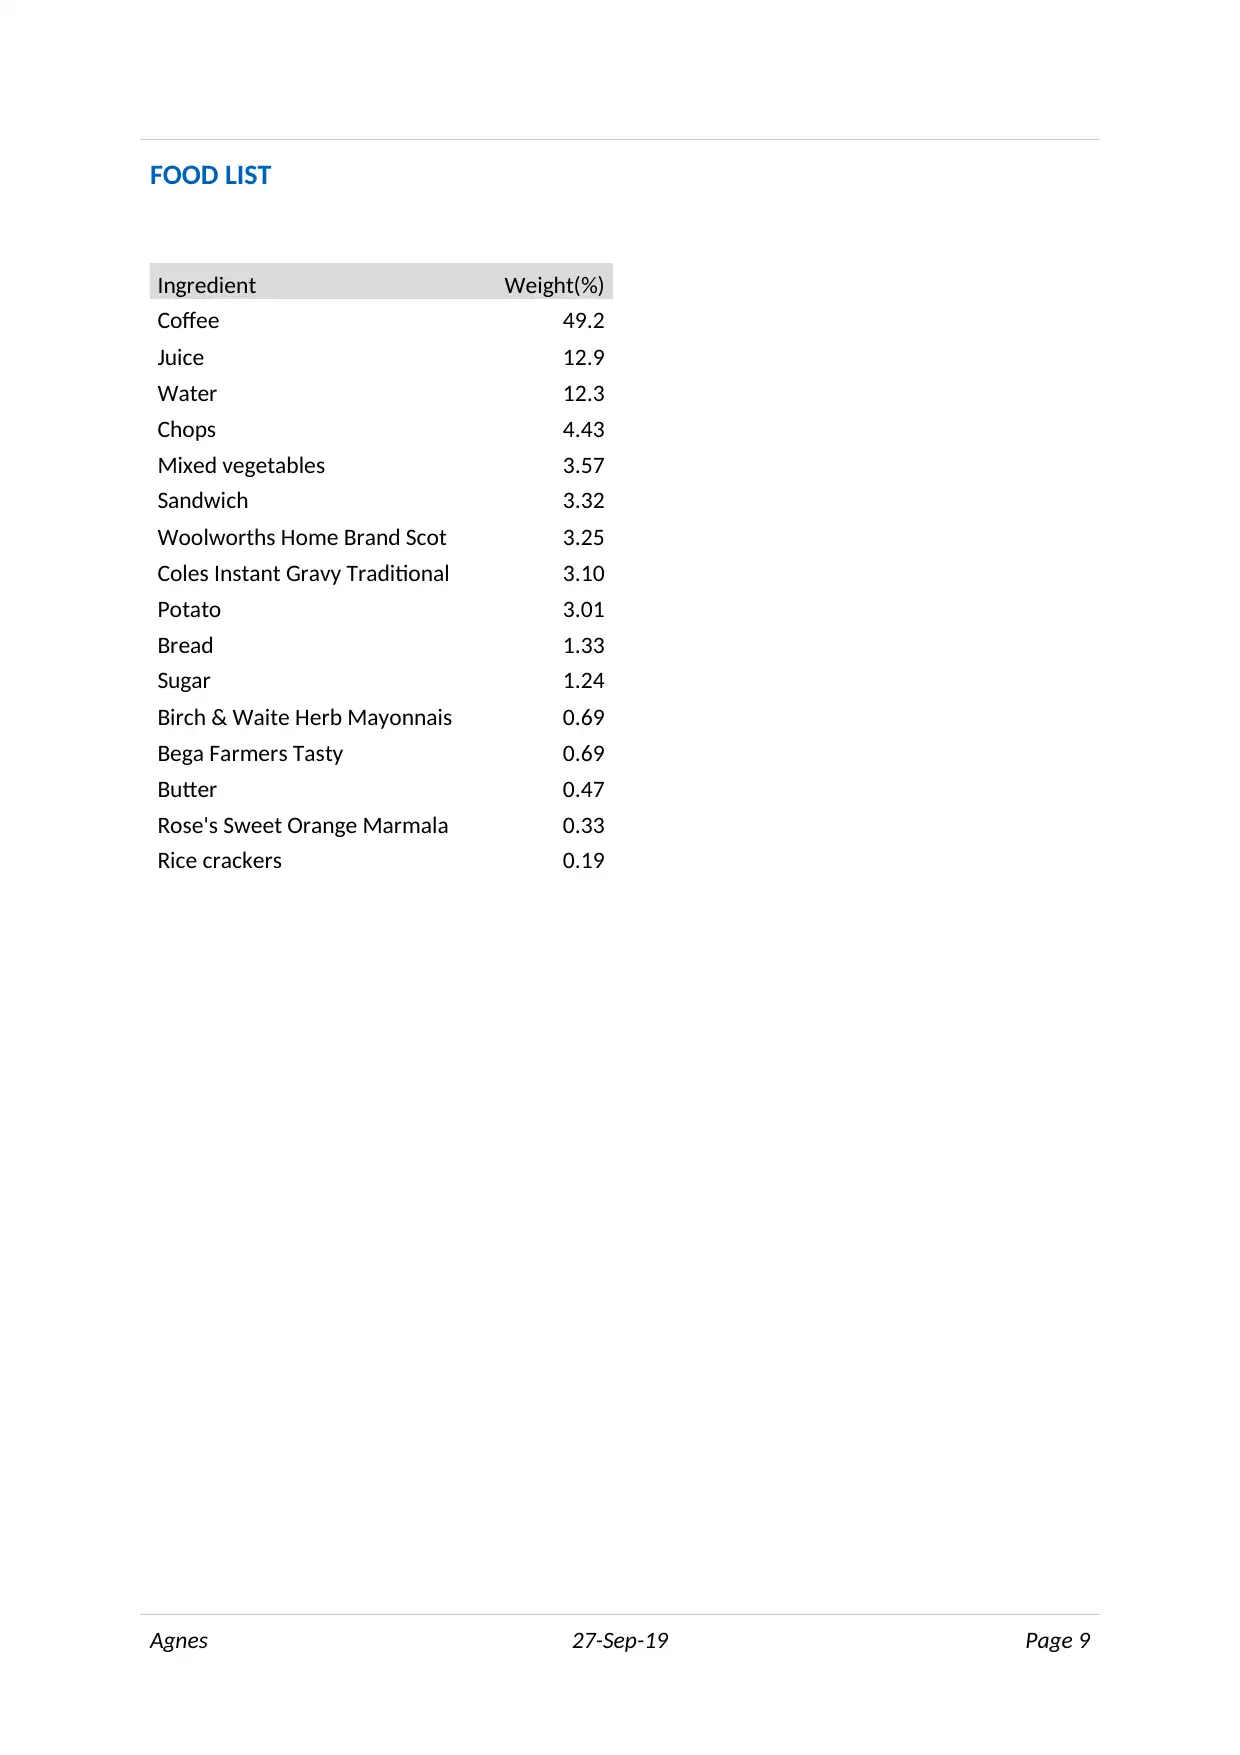
This case study presents a detailed analysis of Agnes, a 72-year-old elderly resident with poor appetite, hypertension, and high blood cholesterol levels, residing in an aged care facility. The assignment involves a comprehensive review of Agnes's daily dietary intake, including the assessment of energy, macronutrient, micronutrient, and other dietary components. The analysis compares Agnes's average daily intake against Estimated Average Requirements (EARs), Recommended Dietary Intakes (RDIs), Adequate Intakes (AIs), and Suggested Dietary Targets (SDTs) to identify potential deficiencies and excesses. The provided data encompasses detailed information on various food groups, including grains, fruits, vegetables, protein sources, dairy, and added sugars. The study also includes a breakdown of the percentage of energy derived from protein, fat, carbohydrates, and alcohol, along with the ratio of different types of fats. Finally, a food list detailing the weight percentage of individual food items in Agnes's diet is provided. The goal is to evaluate Agnes's nutritional status and offer practical strategies to address her health concerns and improve her dietary intake.
tabler-icon-diamond-filled.svg

Contribute Materials

Your contribution can guide someone’s learning journey. Share your documents today.
Document Page
Agnes
DESCRIPTION
An elderly (72 year old) resident who has poor appetite, hypertension and high blood cholesterol
levels
ANALYSIS SUMMARY
Avg/Day EAR EAR(%) Alerts
Weight (g) 2033
Energy (kJ) 5210
Protein (g) 53 38 140%
Total fat (g) 48
- Saturated fat (g) 21
- Trans Fatty Acids (g) 2
- Polyunsaturated fat (g) 8
- Monounsaturated fat (g) 14
Cholesterol (mg) 146
Carbohydrate (g) 146
Sugars (g) 73
Added Sugars (g) 61
Free Sugars (g) 68
Starch (g) 73
Water (g) 1759 <AI
Alcohol (g) 0
Dietary fibre (g) 11 <AI, <SDT
Ash (g) 8
Thiamin (mg) 1.29 0.90 144%
Riboflavin (mg) 0.57 1.10 52% <EAR, <RDI
Niacin (mg) 15.14
Niacin equivalents (mg) 25.61 11.00 233%
Vitamin C (mg) 46.91 30.00 156% <SDT
Vitamin E (mg) 5.85 <AI, <SDT
Tocopherol, alpha (mg) 5.78
Vitamin B6 (by analysis) (mg) 0.56 1.30 43% <EAR, <RDI
Vitamin B12 (μg) 0.81 2.00 41% <EAR, <RDI
Total folate (μg) 238.05
Agnes 27-Sep-19 Page 1
tabler-icon-diamond-filled.svg

Secure Best Marks with AI Grader

Need help grading? Try our AI Grader for instant feedback on your assignments.
Document Page
Avg/Day EAR EAR(%) Alerts
Folate,total DFE (μg) 312.64 320.00 98% <EAR, <RDI
Folic acid (μg) 111.56
Food Folate (μg) 126.55
Total vitamin A equivalents (μg) 673.20 500.00 135% <RDI, <SDT
Retinol (μg) 225.76
Beta carotene equivalents (μg) 2685.51
Beta carotene (μg) 2198.84
Sodium (mg) 1301.36
Potassium (mg) 2333.16 <AI, <SDT
Magnesium (mg) 209.20 265.00 79% <EAR, <RDI
Calcium (mg) 403.93 1100.00 37% <EAR, <RDI
Phosphorus (mg) 772.79 580.00 133% <RDI
Iron (mg) 7.65 5.00 153% <RDI
Zinc (mg) 4.67 6.50 72% <EAR, <RDI
Selenium (μg) 21.64 50.00 43% <EAR, <RDI
Iodine (μg) 74.21 100.00 74% <EAR, <RDI
kJ from protein (%) 17
kJ from fat (%) 34
kJ from saturated fat (%) 15
kJ from trans fat (%) 1
kJ from carbohydrate (%) 46
kJ from alcohol (%) 0
kJ from fibre (%) 2
kJ from others (%) 1
Fat as mono (%) 32
Fat as poly (%) 19
Fat as saturated (%) 49
Very long chain N3 fatty acids (g) 0.06 <AI, <SDT
F18D2CN6 linoleic (g) 7.77 <AI
F18D3N3 alpha-linolenic (ALA) (g) 1.28
F20D5N3 eicosapentaenoic (EPA) (g) 0.02
F22D5N3 docosapentaenoic (DPA) (g) 0.03
F22D6N3 docosahexaenoic (DHA) (g) 0.01
Tryptophan (g) 1
Salicylates VH
Amines VH
Glutamates VH
GRAINS (serve) 3.5
- Refined (serve) 3.2
- Wholegrains (serve) 0.4
· Wholegrains percent (%) 10
Agnes 27-Sep-19 Page 2
Document Page
Avg/Day EAR EAR(%) Alerts
FRUIT (serve) 0.0
- Citrus, melons & berries (serve) 0.0
- Other fruit (serve) 0.0
- Fruit juice (serve) 0.0
· Fruit juice percent (%) 0
VEGETABLES (serve) 1.7
- Dark green vegetables (serve) 0.3
- Red & orange vegetables (serve) 0.3
- Tomatoes (serve) 0.0
- Other red & orange vegetables (serve) 0.2
- Starchy vegetables (serve) 0.9
- Potatoes (serve) 0.5
- Other starchy vegetables (serve) 0.4
· Starchy vegetables percent (%) 49
- Legumes (serve) 0.0
- Other vegetables (serve) 0.3
PROTEIN FOODS (serve) 1.6
- Red meats (serve) 1.5
- Poultry (serve) 0.0
- Eggs (serve) 0.0
- Processed meats (serve) 0.1
- Organ meats (serve) 0.0
- Seafood high in LC N-3 (serve) 0.0
- Seafood low in LC N-3 (serve) 0.0
- Nuts & seeds (serve) 0.0
- Legumes (serve) 0.0
- Soy products (serve) 0.0
DAIRY (serve) 0.4
- Milk (serve) 0.0
- Cheese (serve) 0.4
- Yoghurt (serve) 0.0
- Milk alternatives (serve) 0.0
OIL EQUIVALENTS (tsp) 4
SOLID FAT EQUIVALENTS (tsp) 8
ADDED SUGARS (tsp) 16
· kJ from added sugars (kJ) 1086
· kJ from added sugars percent (%) 21
ALCOHOLIC DRINKS (sd) 0.0
UNCLASSIFIED WEIGHT (g) 3.3
· Unclassified weight percent (%) 0
UNCLASSIFIED kJ (kJ) 10.2
Agnes 27-Sep-19 Page 3
Document Page
Avg/Day EAR EAR(%) Alerts
· Unclassified kJ percent (%) 0
Caffeine (mg) 309
NRVs based on: Female, 72 years, 50 kg, 167 cm, Sedentary Activity
ESTIMATED AVERAGE REQUIREMENT (EAR)
74%
43%
72%
153%
133%
37%
79%
135%
98%
41%
43%
156%
233%
52%
144%
140%
75% EERM
Iodine
Selenium
Zinc
Iron
Phosphorus
Calcium
Magnesium
Tot.Vit.A.Eq
Folate-DFE
Vit.B12
Vit.B6
Vitamin C
Niacin.Eq
Riboflavin
Thiamin
Protein
Energy
0% 100% 200% 300%
Avg/Day EAR EAR(%)
Protein (g) 53 38 140%
Thiamin (mg) 1.29 0.90 144%
Riboflavin (mg) 0.57 1.10 52%
Niacin equivalents (mg) 25.61 11.00 233%
Vitamin C (mg) 46.91 30.00 156%
Vitamin B6 (by analysis) (mg) 0.56 1.30 43%
Vitamin B12 (μg) 0.81 2.00 41%
Folate,total DFE (μg) 312.64 320.00 98%
Total vitamin A equivalents (μg) 673.20 500.00 135%
Magnesium (mg) 209.20 265.00 79%
Calcium (mg) 403.93 1100.00 37%
Phosphorus (mg) 772.79 580.00 133%
Iron (mg) 7.65 5.00 153%
Zinc (mg) 4.67 6.50 72%
Selenium (μg) 21.64 50.00 43%
Iodine (μg) 74.21 100.00 74%
Agnes 27-Sep-19 Page 4
tabler-icon-diamond-filled.svg

Secure Best Marks with AI Grader

Need help grading? Try our AI Grader for instant feedback on your assignments.
Document Page
NRVs based on: Female, 72 years, 50 kg, 167 cm, Sedentary Activity
RECOMMENDED DIETARY INTAKES (RDI)
49%
36%
58%
96%
77%
31%
65%
96%
78%
34%
38%
104%
183%
44%
118%
112%
75% EERM
Iodine
Selenium
Zinc
Iron
Phosphorus
Calcium
Magnesium
Tot.Vit.A.Eq
Folate-DFE
Vit.B12
Vit.B6
Vitamin C
Niacin.Eq
Riboflavin
Thiamin
Protein
Energy
0% 100% 200% 300%
Avg/Day RDI RDI(%)
Protein (g) 53 47 112%
Thiamin (mg) 1.29 1.10 118%
Riboflavin (mg) 0.57 1.30 44%
Niacin equivalents (mg) 25.61 14.00 183%
Vitamin C (mg) 46.91 45.00 104%
Vitamin B6 (by analysis) (mg) 0.56 1.50 38%
Vitamin B12 (μg) 0.81 2.40 34%
Folate,total DFE (μg) 312.64 400.00 78%
Total vitamin A equivalents (μg) 673.20 700.00 96%
Magnesium (mg) 209.20 320.00 65%
Calcium (mg) 403.93 1300.00 31%
Phosphorus (mg) 772.79 1000.00 77%
Iron (mg) 7.65 8.00 96%
Zinc (mg) 4.67 8.00 58%
Selenium (μg) 21.64 60.00 36%
Iodine (μg) 74.21 150.00 49%
NRVs based on: Female, 72 years, 50 kg, 167 cm, Sedentary Activity
Agnes 27-Sep-19 Page 5
Document Page
ADEQUATE INTAKE (AI)
160%
97%
71%
83%
283%
84%
43%
63%
F18D3N3
F18D2CN6
VLCN3
Potassium
Sodium
Vitamin E
Fibre
Water
0% 100% 200% 300%
Avg/Day AI AI(%)
Water (g) 1759 2800 63%
Dietary fibre (g) 11 25 43%
Vitamin E (mg) 5.85 7.00 84%
Sodium (mg) 1301.36 460.00 283%
Potassium (mg) 2333.16 2800.00 83%
Very long chain N3 fatty acids (g) 0.06 0.09 71%
F18D2CN6 linoleic (g) 7.77 8.00 97%
F18D3N3 alpha-linolenic (ALA) (g) 1.28 0.80 160%
NRVs based on: Female, 72 years, 50 kg, 167 cm, Sedentary Activity
UPPER LEVEL OF INTAKE (UL)
2%
7%
5%
12%
17%
26%
16%
8%
1%
2%
VLCN3
Iodine
Selenium
Zinc
Iron
Phosphorus
Calcium
Retinol
Vit.B6
Vitamin E
0% 100% 200% 300%
Avg/Day UL UL(%)
Vitamin E (mg) 5.85 300.00 2%
Vitamin B6 (by analysis) (mg) 0.56 50.00 1%
Retinol (μg) 225.76 3000.00 8%
Calcium (mg) 403.93 2500.00 16%
Phosphorus (mg) 772.79 3000.00 26%
Agnes 27-Sep-19 Page 6
Document Page
Avg/Day UL UL(%)
Iron (mg) 7.65 45.00 17%
Zinc (mg) 4.67 40.00 12%
Selenium (μg) 21.64 400.00 5%
Iodine (μg) 74.21 1100.00 7%
Very long chain N3 fatty acids (g) 0.06 3.00 2%
NRVs based on: Female, 72 years, 50 kg, 167 cm, Sedentary Activity
SUGGESTED DIETARY TARGETS (MINIMUMS)
15%
50%
55%
104%
42%
25%
38%
VLCN3
Potassium
Tot.Vit.A.Eq
Folate-DFE
Vitamin E
Vitamin C
Fibre
0% 100% 200% 300%
Avg/Day SDT-Min (%)
Dietary fibre (g) 11 28 38%
Vitamin C (mg) 46.91 190.00 25%
Vitamin E (mg) 5.85 14.00 42%
Folate,total DFE (μg) 312.64 300.00 104%
Total vitamin A equivalents (μg) 673.20 1220.00 55%
Potassium (mg) 2333.16 4700.00 50%
Very long chain N3 fatty acids (g) 0.06 0.43 15%
NRVs based on: Female, 72 years, 50 kg, 167 cm, Sedentary Activity
SUGGESTED DIETARY TARGETS (MAXIMUMS)
65%Sodium
0% 100% 200% 300%
Avg/Day SDT-Max (%)
Sodium (mg) 1301.36 2000.00 65%
NRVs based on: Female, 72 years, 50 kg, 167 cm, Sedentary Activity
GOALS (MINIMUMS)
Unable to show graph - no values
Agnes 27-Sep-19 Page 7
tabler-icon-diamond-filled.svg

Paraphrase This Document

Need a fresh take? Get an instant paraphrase of this document with our AI Paraphraser
Document Page
GOALS (MAXIMUMS)
Unable to show graph - no values
RATIO ENERGY FROM PROTEIN, FAT, CARBOHYDRATE AND ALCOHOL
1%
2%
0%
46%
1%
15%
34%
17%
%kJ-Others
%Fibre
%kJ-Alcohol
%kJ-Carb
%Trans Fat
%Sat Fat
%kJ-Fat
%kJ-Protein
0% 10% 20% 30% 40% 50% 60% 70% 80% 90% 100%
RATIO POLY, MONO AND SATURATED FATS
Poly-19%
Mono-32%
Sat-49%
Agnes 27-Sep-19 Page 8
Document Page
FOOD LIST
Ingredient Weight(%)
Coffee 49.2
Juice 12.9
Water 12.3
Chops 4.43
Mixed vegetables 3.57
Sandwich 3.32
Woolworths Home Brand Scot 3.25
Coles Instant Gravy Traditional 3.10
Potato 3.01
Bread 1.33
Sugar 1.24
Birch & Waite Herb Mayonnais 0.69
Bega Farmers Tasty 0.69
Butter 0.47
Rose's Sweet Orange Marmala 0.33
Rice crackers 0.19
Agnes 27-Sep-19 Page 9
chevron_up_icon
1 out of 9
circle_padding
hide_on_mobile
zoom_out_icon
logo.png

Your All-in-One AI-Powered Toolkit for Academic Success.

Available 24*7 on WhatsApp / Email

[object Object]