Financial Analysis and Valuation Report: Dietswell SA's IPO Decision
VerifiedAdded on 2020/10/22
|13
|3049
|235
Report
AI Summary
This report provides a comprehensive financial analysis of Dietswell SA, a French service provider in the oil and gas industry, focusing on its four business units: Dietswell Services, Dietswell Solutions, Facto-rig, and Dietswell Contracting. The analysis includes a detailed examination of financial ratios, such as turnover, cost of sales, contribution, gross margin, EBITDA, EBIT, and net results, for the period from 2009 to 2011. The report evaluates the company's performance, considering the impact of the global economic downturn and internal restructuring efforts. It rationalizes financial decisions based on findings, emphasizing the need for the company to utilize external funding sources to improve its debt-equity ratio. Furthermore, the report applies the Discounted Cash Flow (DCF) approach to value Dietswell SA, forecasting revenues, capital expenditures, and EBIT, and compares the results to market values. The conclusion highlights the importance of factors such as depreciation and amortization in management decision-making, recommending strategies for future growth and financial stability. The analysis also compares the results with market values during the previous trading year. The report includes tables of financial data, including unlevered free cash flow, enterprise value, and market capitalization to support its conclusions and recommendations.
FINANCIAL
DECISION
MAKING
DECISION
MAKING
Paraphrase This Document
Need a fresh take? Get an instant paraphrase of this document with our AI Paraphraser
EXECUTIVE SUMMARY
This report summarises that Dietswell SA has to select IPO for future perspective. It has
been analysed that company have much more equity compare to debt so they need to debt for
future business activities. There is recommanded that they has to used external sources less than
to internal sources. The company has analysis financial ratio regarding to four business units and
find that business run on credit sales and purchase. For reduction of liabilities need to use
external sources which are come by debt. The company has apply discount cash flow
methodology to compare actual and expected amounts of every year.
Table of Contents
EXECUTIVE SUMMARY ............................................................................................................2
INTRODUCTION...........................................................................................................................2
MAIN BODY...................................................................................................................................2
Financial ratio analysis of Dietswell SA referring to four business units..............................2
Company's Performance.........................................................................................................3
Rationalise of decision based on findings..............................................................................4
Valuation of Dietswell SA using an appropriate DCF approach and the forecasting
assumptions ...........................................................................................................................4
Compare result to market values during the previous trading year .......................................6
Factors are using to valuation bases for the management decision making...........................6
RECOMMENDATION...................................................................................................................6
CONCLUSION................................................................................................................................7
REFERENCES................................................................................................................................8
APPENDIX......................................................................................................................................9
1
⊘ This is a preview!⊘
Do you want full access?
Subscribe today to unlock all pages.
Trusted by 1+ million students worldwide
INTRODUCTION
Financial decision making is a process which made by the financial manager relating to
the financing mix of an organization (Financial decision making. 2019). The aim of this report
is to conduct an analysis of the industry for future growth of Dietswell SA and valuation of
company regarding management decision making. Financial ratio provides accurate performance
of company regarding to decision making.. Dietswell SA is a French service provider in the oil
and gas industry. They have four business units such as Dietswell Services, Dietswell Solutions,
Facto-rig and Dietswell Contracting. The report focused on analysis of financial ratios of the
company and calculate value with the help of appropriate methodology of DCF approach and the
forecasting assumptions.
MAIN BODY
Financial ratio analysis of Dietswell SA referring to four business units
For analysing of financial ratio of Dietswell SA referring to the four business units, they
are as follows -
Dietswell Services
It has been analysed that in 2011, Dietswell services accounted for 78% of Dietswell SA
revenues. There was considering a core competency for company, generating high levels revenue
with low capital requirements. From 2012, restructuring accelerated at dietswell services with
several developments. In 2009, turn over of Dietswell services unit was EUR 8072485, growth
of the unit -28% and cost of sales is £7156960 so contribution was £915525. There is gross
margin was £679793 and EBITDA £1174307, £836682 and £45942 from 2009 to 2011 (Arnold
and et. Al, 2012). From EBITDA deduct amount of amortization and depreciation and as a result
get earning before interest and tax like as £2021171, £1961165 and £1038180. From the result of
EBITDA deduct amount of financial and exceptional result and acquire amount of net result
before tax on profit like as £1237490, £5034489 and £1271115. from the mention amount of
EBT less amount of tax and get net result of three years like in 2009 – £1237490, in 2010 –
£5034489 and in 2011 – £1271293.
Dietswell Solutions
It is observed that turn over of Dietswell solutions from 2009 to 2011 is £1196151,
£1598101 and £577105. It shows growth of the company such as 237%, 34% and -64%
2
Paraphrase This Document
Need a fresh take? Get an instant paraphrase of this document with our AI Paraphraser
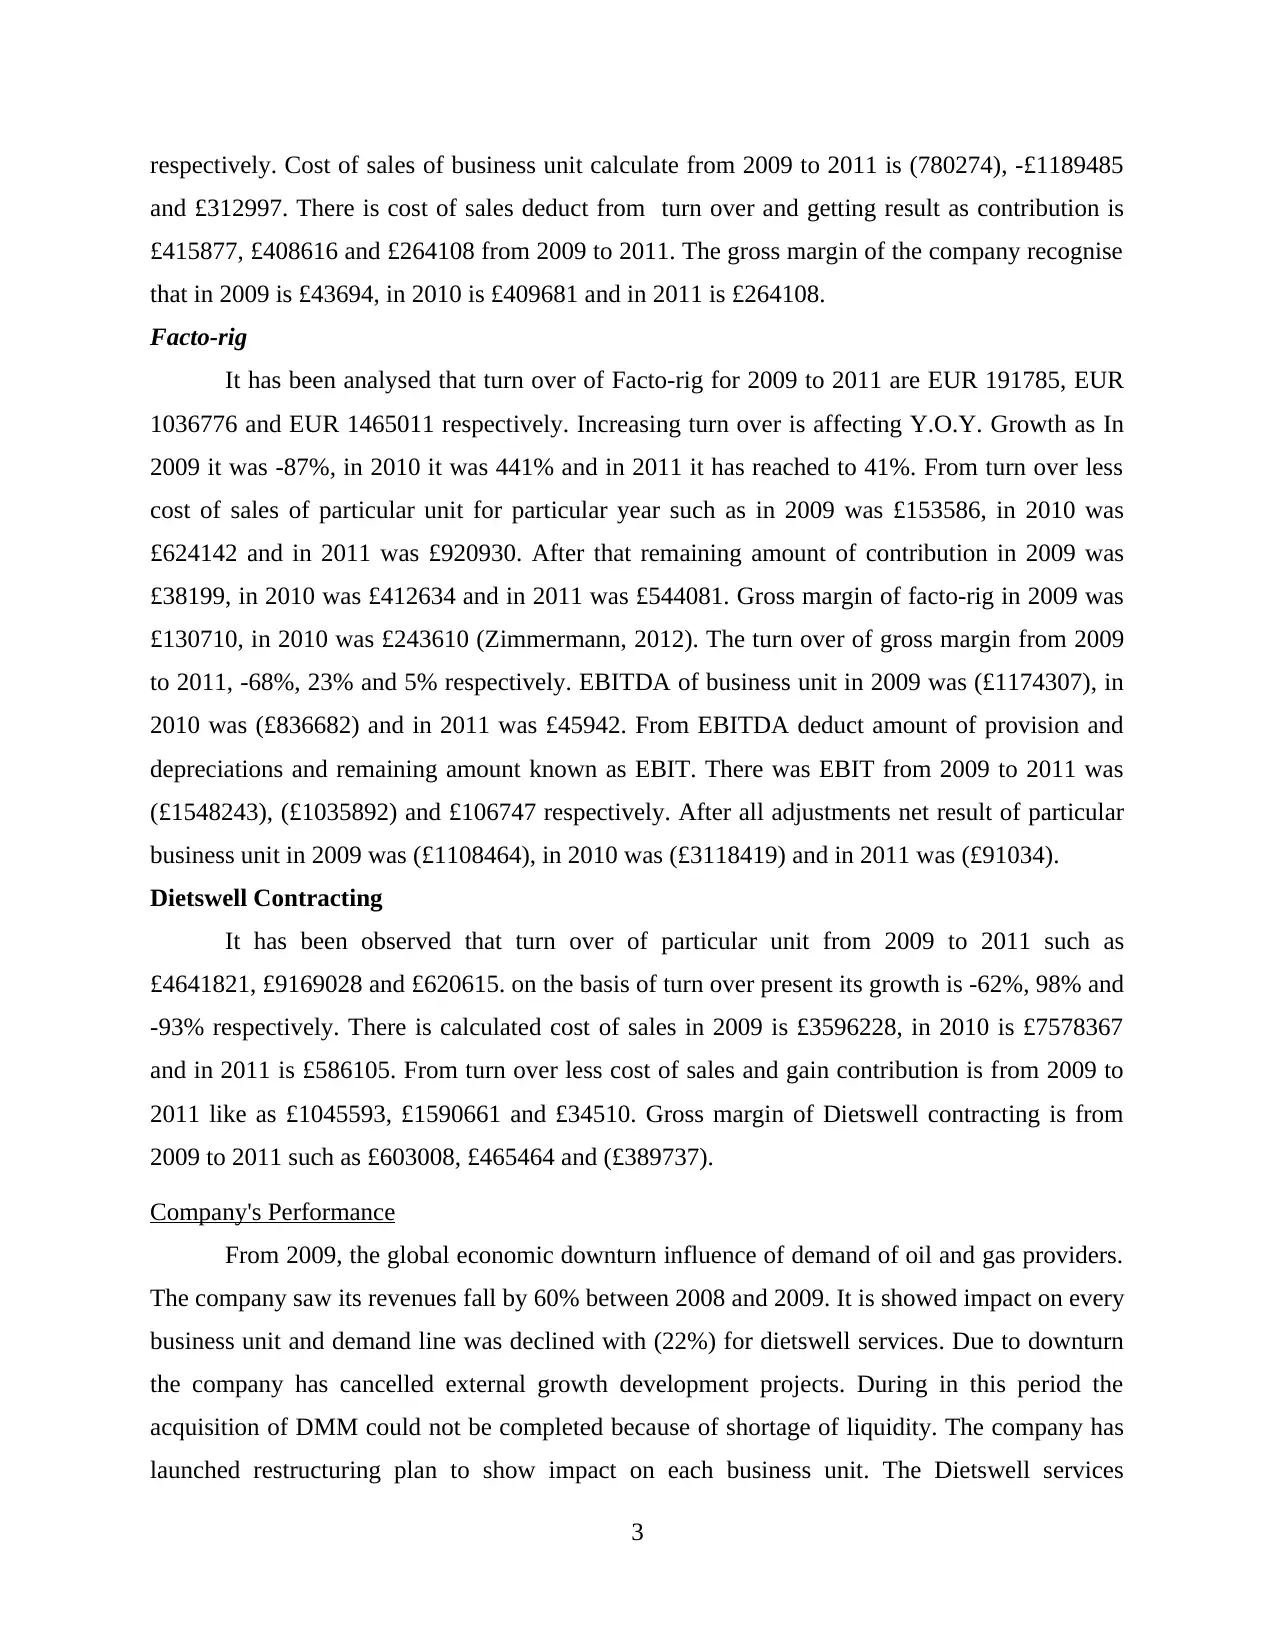
respectively. Cost of sales of business unit calculate from 2009 to 2011 is (780274), -£1189485
and £312997. There is cost of sales deduct from turn over and getting result as contribution is
£415877, £408616 and £264108 from 2009 to 2011. The gross margin of the company recognise
that in 2009 is £43694, in 2010 is £409681 and in 2011 is £264108.
Facto-rig
It has been analysed that turn over of Facto-rig for 2009 to 2011 are EUR 191785, EUR
1036776 and EUR 1465011 respectively. Increasing turn over is affecting Y.O.Y. Growth as In
2009 it was -87%, in 2010 it was 441% and in 2011 it has reached to 41%. From turn over less
cost of sales of particular unit for particular year such as in 2009 was £153586, in 2010 was
£624142 and in 2011 was £920930. After that remaining amount of contribution in 2009 was
£38199, in 2010 was £412634 and in 2011 was £544081. Gross margin of facto-rig in 2009 was
£130710, in 2010 was £243610 (Zimmermann, 2012). The turn over of gross margin from 2009
to 2011, -68%, 23% and 5% respectively. EBITDA of business unit in 2009 was (£1174307), in
2010 was (£836682) and in 2011 was £45942. From EBITDA deduct amount of provision and
depreciations and remaining amount known as EBIT. There was EBIT from 2009 to 2011 was
(£1548243), (£1035892) and £106747 respectively. After all adjustments net result of particular
business unit in 2009 was (£1108464), in 2010 was (£3118419) and in 2011 was (£91034).
Dietswell Contracting
It has been observed that turn over of particular unit from 2009 to 2011 such as
£4641821, £9169028 and £620615. on the basis of turn over present its growth is -62%, 98% and
-93% respectively. There is calculated cost of sales in 2009 is £3596228, in 2010 is £7578367
and in 2011 is £586105. From turn over less cost of sales and gain contribution is from 2009 to
2011 like as £1045593, £1590661 and £34510. Gross margin of Dietswell contracting is from
2009 to 2011 such as £603008, £465464 and (£389737).
Company's Performance
From 2009, the global economic downturn influence of demand of oil and gas providers.
The company saw its revenues fall by 60% between 2008 and 2009. It is showed impact on every
business unit and demand line was declined with (22%) for dietswell services. Due to downturn
the company has cancelled external growth development projects. During in this period the
acquisition of DMM could not be completed because of shortage of liquidity. The company has
launched restructuring plan to show impact on each business unit. The Dietswell services
3
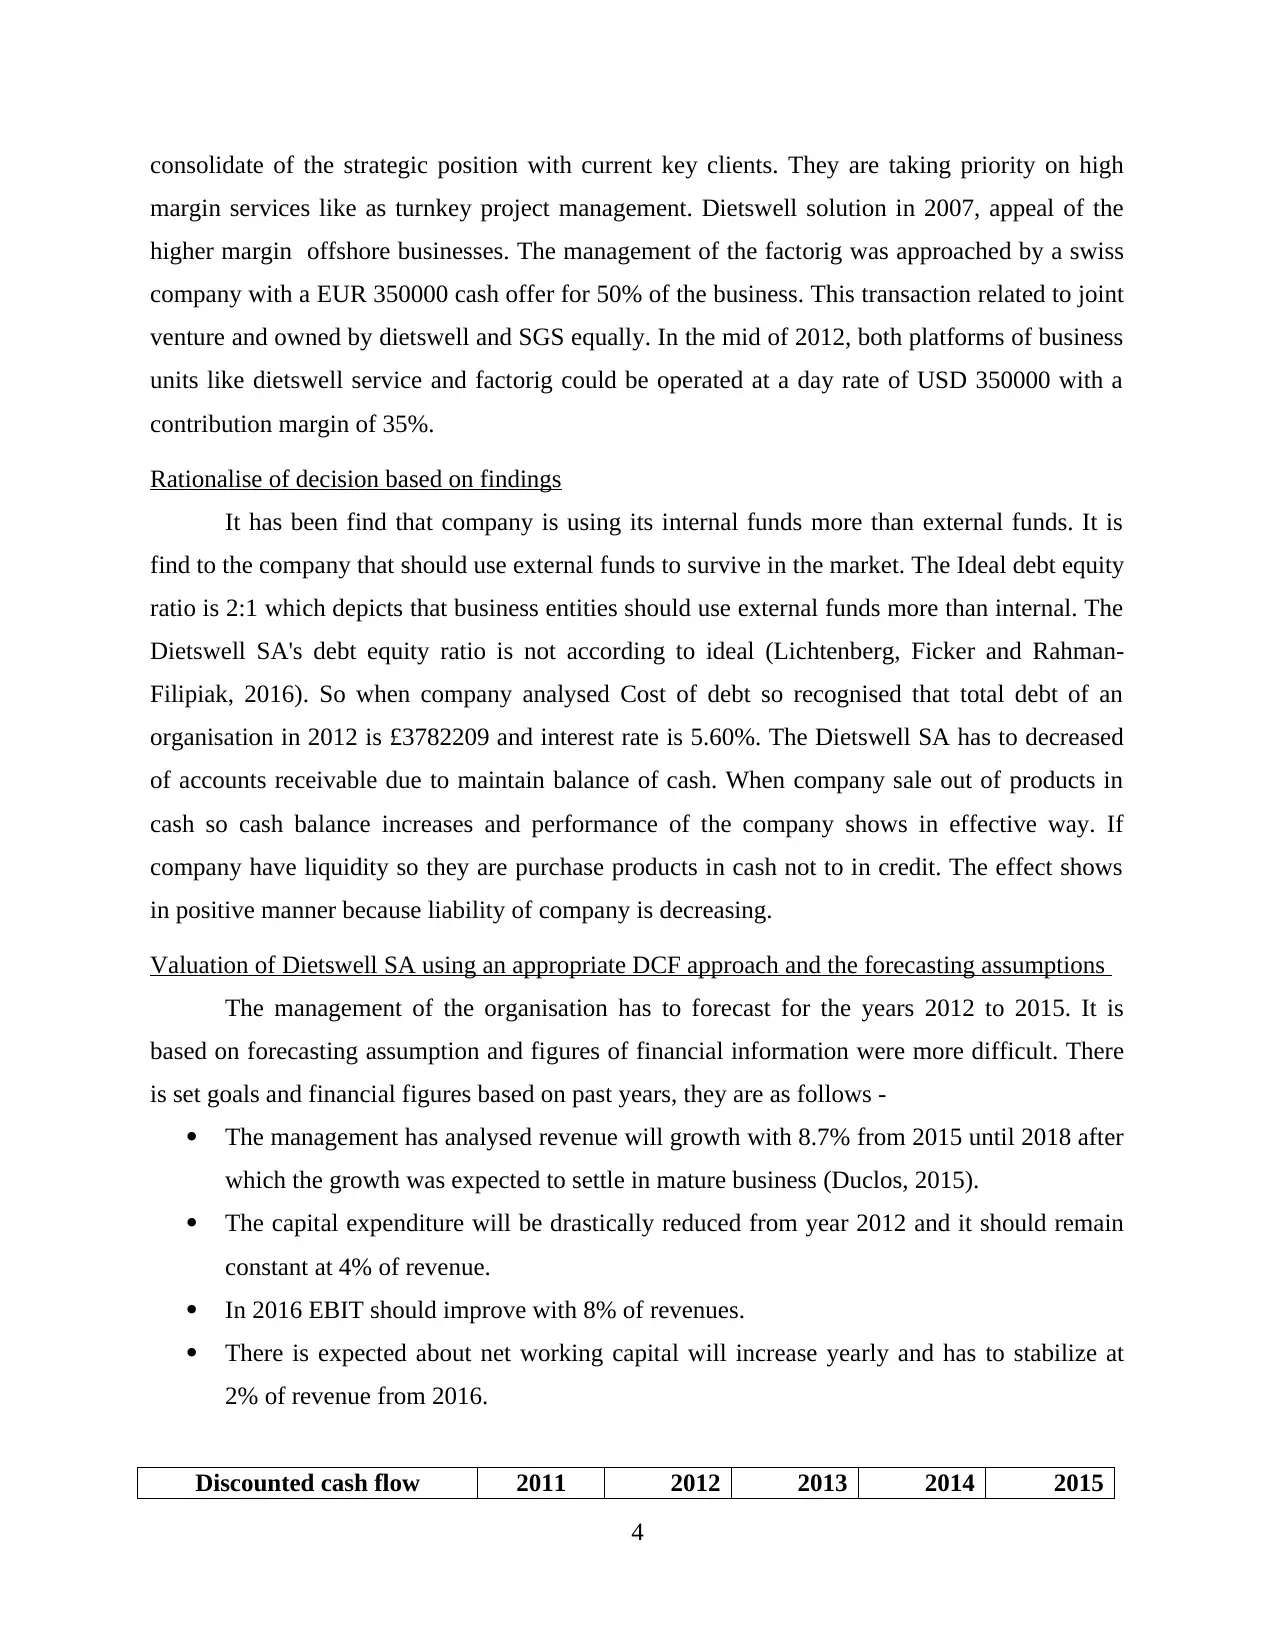
consolidate of the strategic position with current key clients. They are taking priority on high
margin services like as turnkey project management. Dietswell solution in 2007, appeal of the
higher margin offshore businesses. The management of the factorig was approached by a swiss
company with a EUR 350000 cash offer for 50% of the business. This transaction related to joint
venture and owned by dietswell and SGS equally. In the mid of 2012, both platforms of business
units like dietswell service and factorig could be operated at a day rate of USD 350000 with a
contribution margin of 35%.
Rationalise of decision based on findings
It has been find that company is using its internal funds more than external funds. It is
find to the company that should use external funds to survive in the market. The Ideal debt equity
ratio is 2:1 which depicts that business entities should use external funds more than internal. The
Dietswell SA's debt equity ratio is not according to ideal (Lichtenberg, Ficker and Rahman-
Filipiak, 2016). So when company analysed Cost of debt so recognised that total debt of an
organisation in 2012 is £3782209 and interest rate is 5.60%. The Dietswell SA has to decreased
of accounts receivable due to maintain balance of cash. When company sale out of products in
cash so cash balance increases and performance of the company shows in effective way. If
company have liquidity so they are purchase products in cash not to in credit. The effect shows
in positive manner because liability of company is decreasing.
Valuation of Dietswell SA using an appropriate DCF approach and the forecasting assumptions
The management of the organisation has to forecast for the years 2012 to 2015. It is
based on forecasting assumption and figures of financial information were more difficult. There
is set goals and financial figures based on past years, they are as follows -
The management has analysed revenue will growth with 8.7% from 2015 until 2018 after
which the growth was expected to settle in mature business (Duclos, 2015).
The capital expenditure will be drastically reduced from year 2012 and it should remain
constant at 4% of revenue.
In 2016 EBIT should improve with 8% of revenues.
There is expected about net working capital will increase yearly and has to stabilize at
2% of revenue from 2016.
Discounted cash flow 2011 2012 2013 2014 2015
4
⊘ This is a preview!⊘
Do you want full access?
Subscribe today to unlock all pages.
Trusted by 1+ million students worldwide
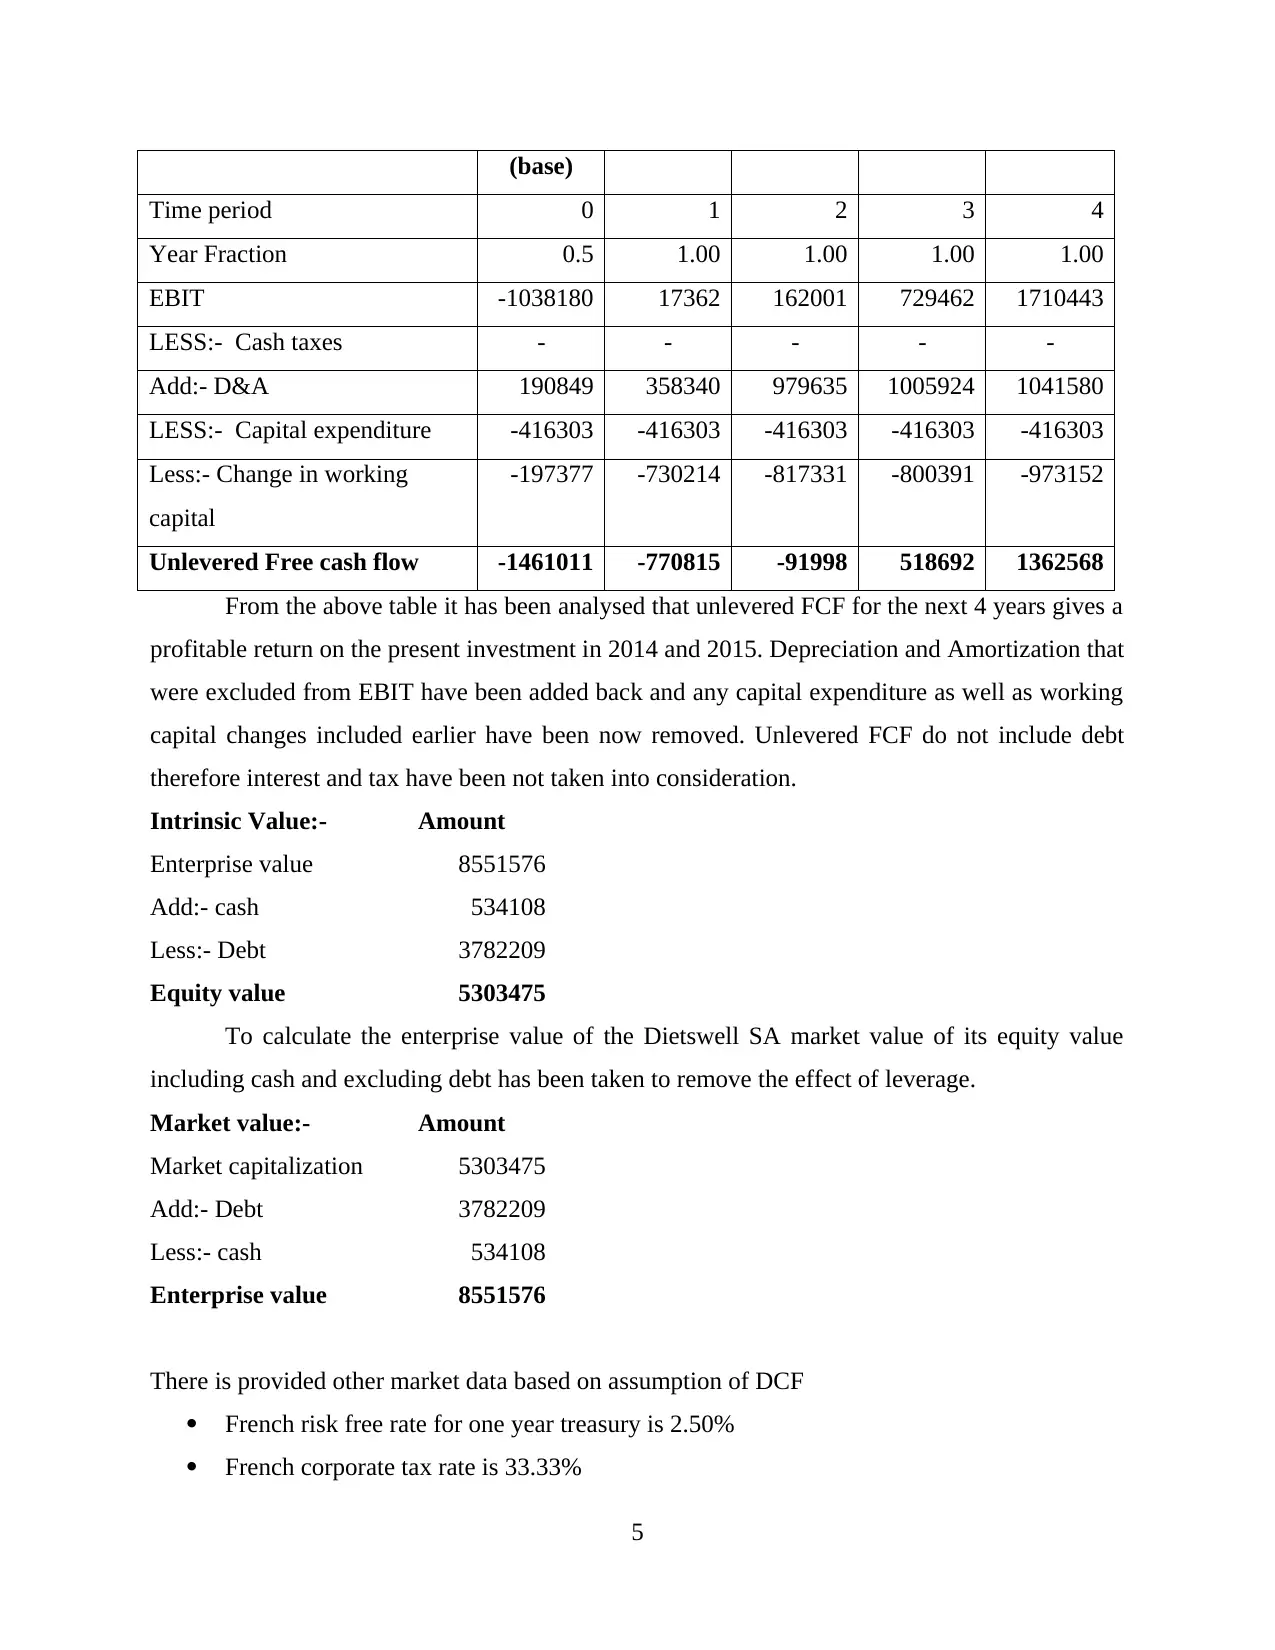
(base)
Time period 0 1 2 3 4
Year Fraction 0.5 1.00 1.00 1.00 1.00
EBIT -1038180 17362 162001 729462 1710443
LESS:- Cash taxes - - - - -
Add:- D&A 190849 358340 979635 1005924 1041580
LESS:- Capital expenditure -416303 -416303 -416303 -416303 -416303
Less:- Change in working
capital
-197377 -730214 -817331 -800391 -973152
Unlevered Free cash flow -1461011 -770815 -91998 518692 1362568
From the above table it has been analysed that unlevered FCF for the next 4 years gives a
profitable return on the present investment in 2014 and 2015. Depreciation and Amortization that
were excluded from EBIT have been added back and any capital expenditure as well as working
capital changes included earlier have been now removed. Unlevered FCF do not include debt
therefore interest and tax have been not taken into consideration.
Intrinsic Value:- Amount
Enterprise value 8551576
Add:- cash 534108
Less:- Debt 3782209
Equity value 5303475
To calculate the enterprise value of the Dietswell SA market value of its equity value
including cash and excluding debt has been taken to remove the effect of leverage.
Market value:- Amount
Market capitalization 5303475
Add:- Debt 3782209
Less:- cash 534108
Enterprise value 8551576
There is provided other market data based on assumption of DCF
French risk free rate for one year treasury is 2.50%
French corporate tax rate is 33.33%
5
Paraphrase This Document
Need a fresh take? Get an instant paraphrase of this document with our AI Paraphraser
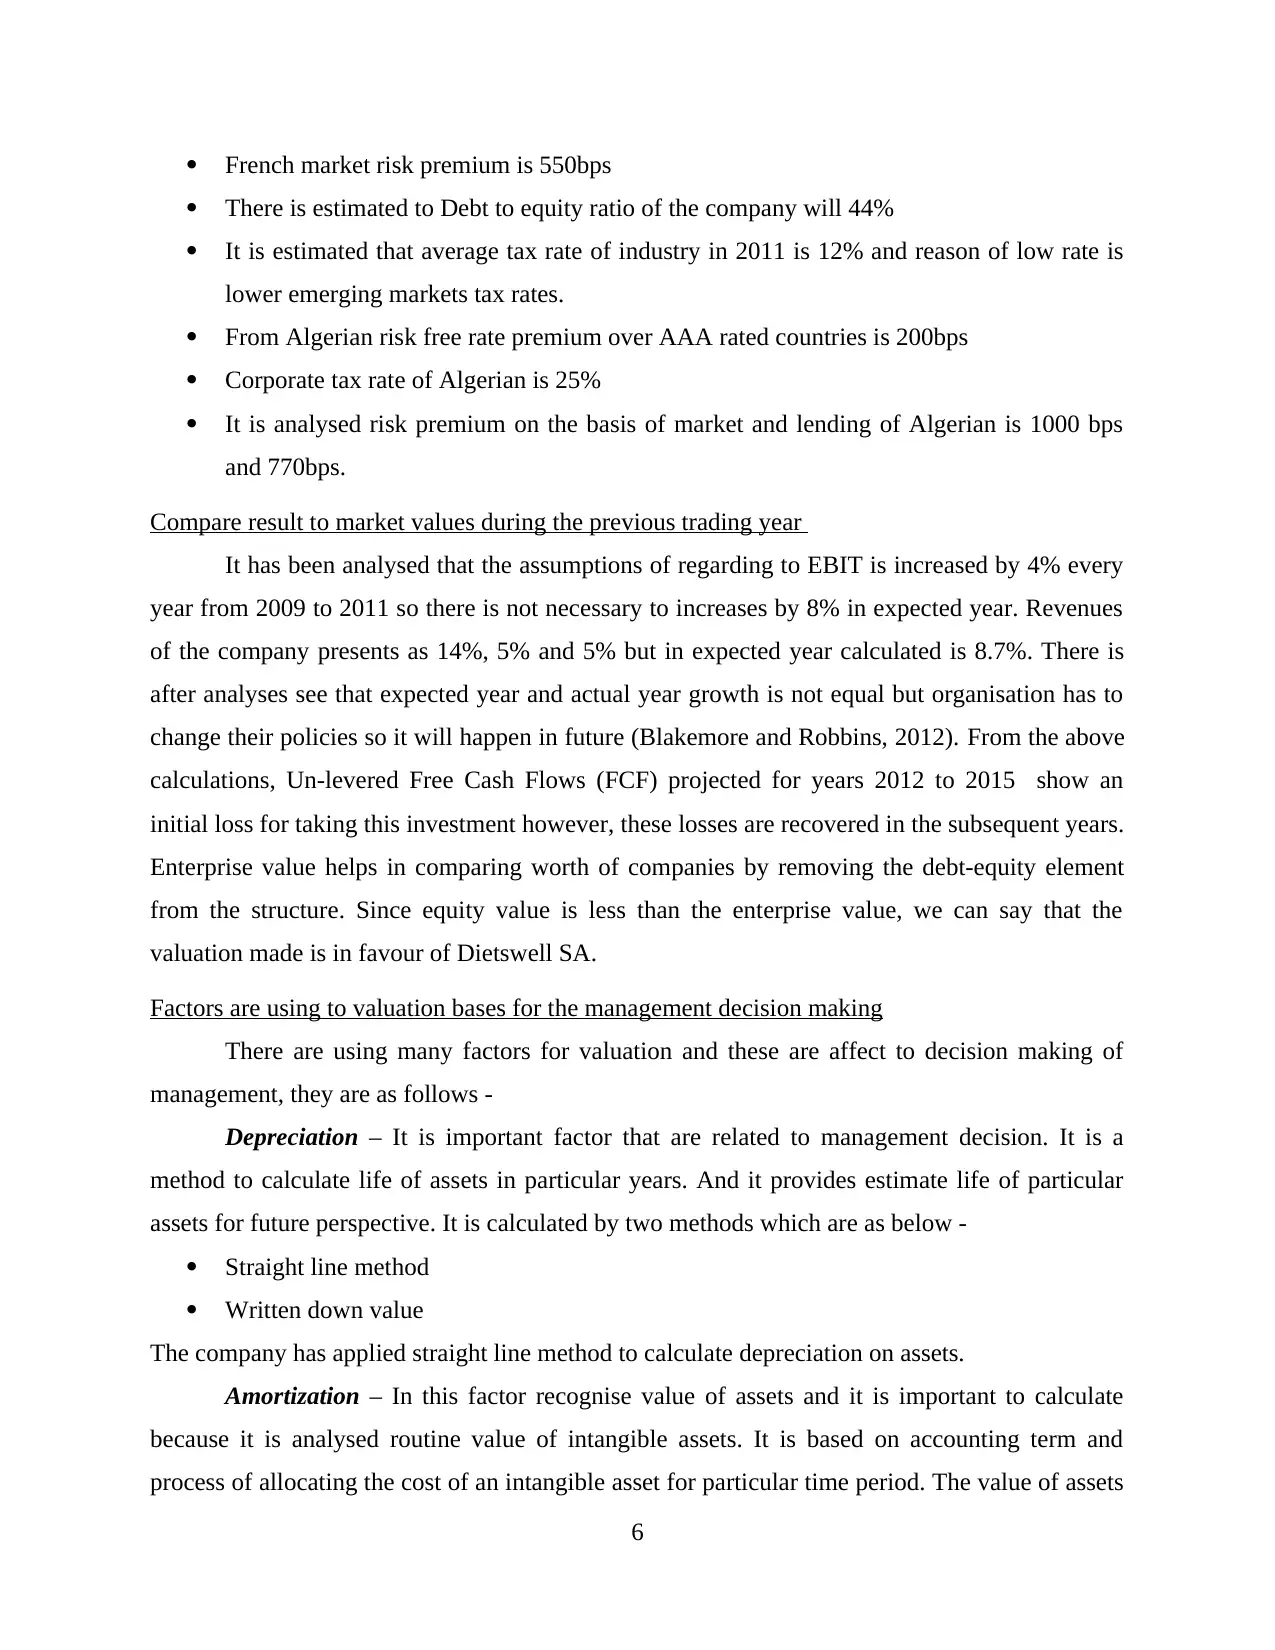
French market risk premium is 550bps
There is estimated to Debt to equity ratio of the company will 44%
It is estimated that average tax rate of industry in 2011 is 12% and reason of low rate is
lower emerging markets tax rates.
From Algerian risk free rate premium over AAA rated countries is 200bps
Corporate tax rate of Algerian is 25%
It is analysed risk premium on the basis of market and lending of Algerian is 1000 bps
and 770bps.
Compare result to market values during the previous trading year
It has been analysed that the assumptions of regarding to EBIT is increased by 4% every
year from 2009 to 2011 so there is not necessary to increases by 8% in expected year. Revenues
of the company presents as 14%, 5% and 5% but in expected year calculated is 8.7%. There is
after analyses see that expected year and actual year growth is not equal but organisation has to
change their policies so it will happen in future (Blakemore and Robbins, 2012). From the above
calculations, Un-levered Free Cash Flows (FCF) projected for years 2012 to 2015 show an
initial loss for taking this investment however, these losses are recovered in the subsequent years.
Enterprise value helps in comparing worth of companies by removing the debt-equity element
from the structure. Since equity value is less than the enterprise value, we can say that the
valuation made is in favour of Dietswell SA.
Factors are using to valuation bases for the management decision making
There are using many factors for valuation and these are affect to decision making of
management, they are as follows -
Depreciation – It is important factor that are related to management decision. It is a
method to calculate life of assets in particular years. And it provides estimate life of particular
assets for future perspective. It is calculated by two methods which are as below -
Straight line method
Written down value
The company has applied straight line method to calculate depreciation on assets.
Amortization – In this factor recognise value of assets and it is important to calculate
because it is analysed routine value of intangible assets. It is based on accounting term and
process of allocating the cost of an intangible asset for particular time period. The value of assets
6
affect to decision of management (Strang, 2012). It also provides the repayment of loan principal
over time.
RECOMMENDATION
It is recommanded that the organisation have to select IPO because they have already
much more equity. With this option company have to fulfil their objective and achieve their aim
regarding to position of company. If they are select option of private equity so it has been
increased much more and it is shows bad effect on company performance. There is finding that
total equity of the company from 2009 to 2011 such as £2,20,40273, £1,86,80816 and
£1,89,80941. Total debt from 2009 to 2011 like as £26,30,659, £2207966 and £15,63,405. It has
been analysed that company have less than debt compare to equity. So company have to used
external resources compare to internal resources. So for the future they have to select IPO
because it is best to improve performance and future growth of the company.
CONCLUSION
It has been concluded that the company has analysed of report to find out financial ratios
of Dietswell SA referring to the four business units. These units are support to management
decision making through financial ratios. There is finding that company has conducted activities
in credit terms that is not appropriate for future growth. The company have cash amount
£534108 and liabilities £3471059 so after analysis that company have much more liabilities. It
shows average performance of company so company have to reduce liabilities. There is
recommanded that company have to select IPO for future growth because they have already
private equity.
7
⊘ This is a preview!⊘
Do you want full access?
Subscribe today to unlock all pages.
Trusted by 1+ million students worldwide
REFERENCES
Books and Journal
Arnold, V. and et. al, 2012. The impact of tagging qualitative financial information on investor
decision making: Implications for XBRL. International Journal of Accounting
Information Systems. 13(1). pp.2-20.
Zimmermann, H. J., 2012. Fuzzy sets, decision making, and expert systems (Vol. 10). Springer
Science & Business Media.
Starcke, K. and Brand, M., 2012. Decision making under stress: a selective review. Neuroscience
& Biobehavioral Reviews. 36(4). pp.1228-1248.
Lichtenberg, P. A., Ficker, L. J. and Rahman-Filipiak, A., 2016. Financial decision-making
abilities and financial exploitation in older African Americans: Preliminary validity
evidence for the Lichtenberg Financial Decision Rating Scale (LFDRS). Journal of
elder abuse & neglect. 28(1). pp.14-33.
Duclos, R., 2015. The psychology of investment behavior:(De) biasing financial decision‐making
one graph at a time. Journal of Consumer psychology. 25(2). pp.317-325.
Blakemore, S. J. and Robbins, T. W., 2012. Decision-making in the adolescent brain. Nature
neuroscience. 15(9). p.1184.
Strang, K. D., 2012. Applied financial non-linear programming models for decision making.
International Journal of Applied Decision Sciences. 5(4). pp.370-395.
Online
Financial decision making. 2019. [online]. Available through:
<https://www.edx.org/course/financial-decision-making-usmx-umuc-af6010>
8
Paraphrase This Document
Need a fresh take? Get an instant paraphrase of this document with our AI Paraphraser
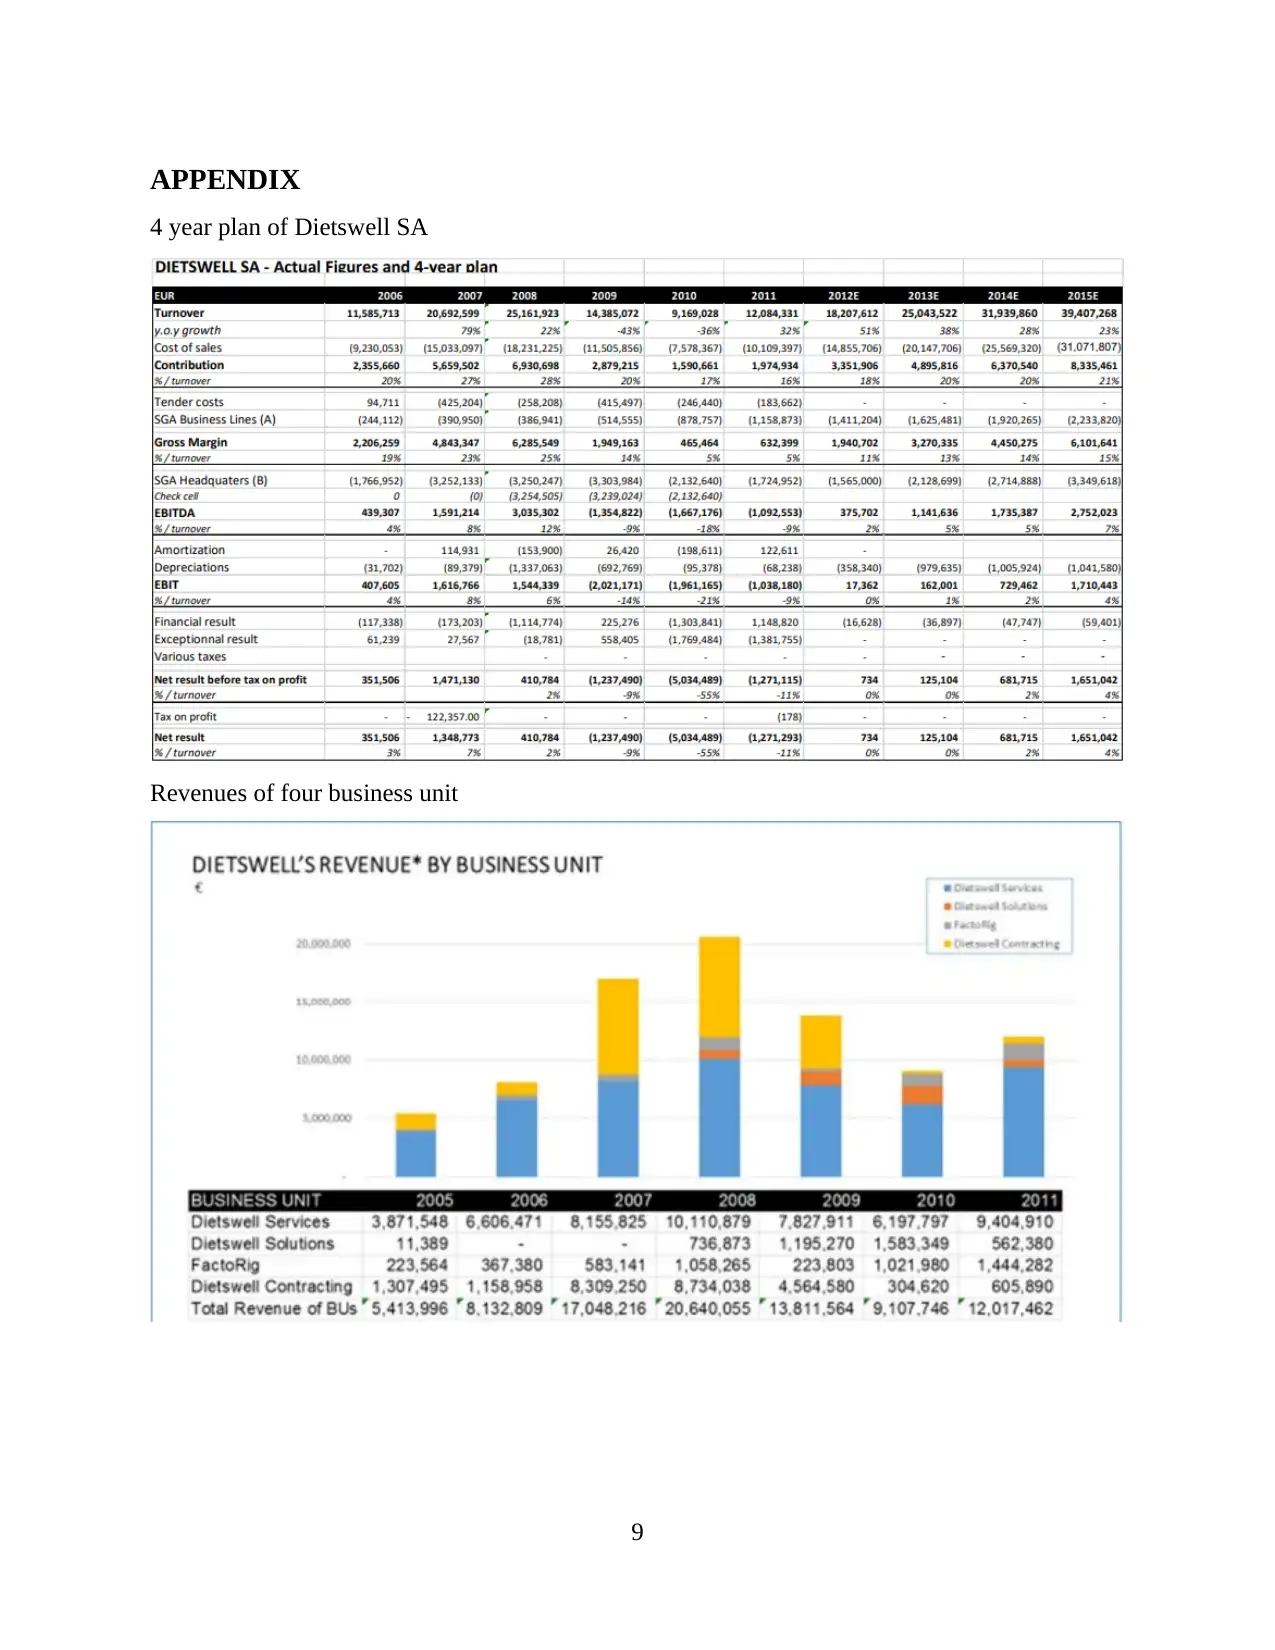
APPENDIX
4 year plan of Dietswell SA
Revenues of four business unit
9
4 year plan of Dietswell SA
Revenues of four business unit
9
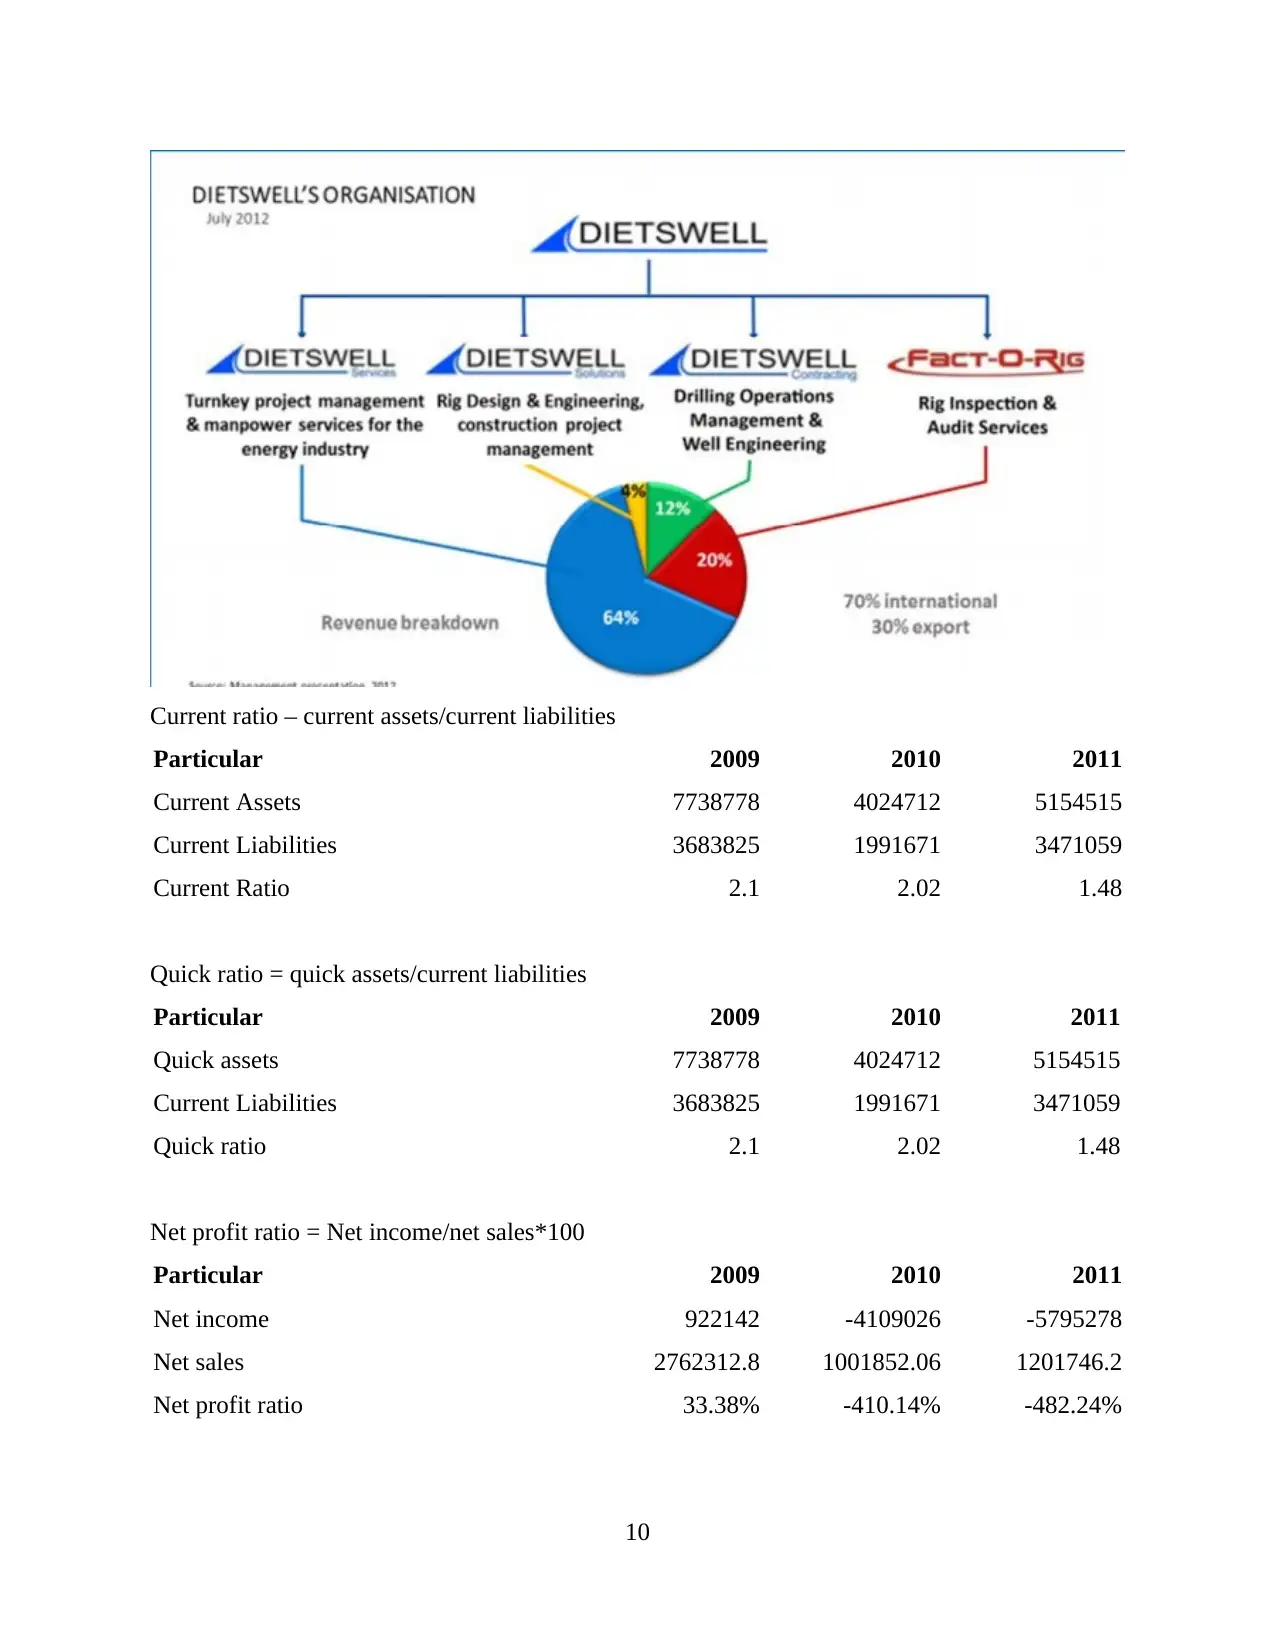
Current ratio – current assets/current liabilities
Particular 2009 2010 2011
Current Assets 7738778 4024712 5154515
Current Liabilities 3683825 1991671 3471059
Current Ratio 2.1 2.02 1.48
Quick ratio = quick assets/current liabilities
Particular 2009 2010 2011
Quick assets 7738778 4024712 5154515
Current Liabilities 3683825 1991671 3471059
Quick ratio 2.1 2.02 1.48
Net profit ratio = Net income/net sales*100
Particular 2009 2010 2011
Net income 922142 -4109026 -5795278
Net sales 2762312.8 1001852.06 1201746.2
Net profit ratio 33.38% -410.14% -482.24%
10
Particular 2009 2010 2011
Current Assets 7738778 4024712 5154515
Current Liabilities 3683825 1991671 3471059
Current Ratio 2.1 2.02 1.48
Quick ratio = quick assets/current liabilities
Particular 2009 2010 2011
Quick assets 7738778 4024712 5154515
Current Liabilities 3683825 1991671 3471059
Quick ratio 2.1 2.02 1.48
Net profit ratio = Net income/net sales*100
Particular 2009 2010 2011
Net income 922142 -4109026 -5795278
Net sales 2762312.8 1001852.06 1201746.2
Net profit ratio 33.38% -410.14% -482.24%
10
⊘ This is a preview!⊘
Do you want full access?
Subscribe today to unlock all pages.
Trusted by 1+ million students worldwide
1 out of 13
Related Documents


Your All-in-One AI-Powered Toolkit for Academic Success.
+13062052269
info@desklib.com
Available 24*7 on WhatsApp / Email
![[object Object]](/_next/static/media/star-bottom.7253800d.svg)
Unlock your academic potential
Copyright © 2020–2026 A2Z Services. All Rights Reserved. Developed and managed by ZUCOL.