AMN425: Digital Strategy and Analytics Report for Google Store
VerifiedAdded on 2023/06/07
|14
|3417
|321
Report
AI Summary
This report presents an analysis of the Google Merchandise Store's website performance using Google Analytics. It begins with an introduction outlining the objectives, including increasing website traffic, customer retention, and enhancing SEO. Section 1 provides a detailed Google Analytics report, examining visitor data, bounce rates, session information, and traffic sources. Section 2 focuses on search analysis, discussing improvements made through Search Engine Optimization and the use of Keyword Planner. Section 3 offers an interpretation of the collected data, highlighting trends in visitor behavior and identifying areas for improvement. The report concludes with Section 4, which provides specific recommendations for optimizing the website's digital strategy to achieve the defined objectives. The analysis includes data on visitor numbers, bounce rates, session duration, and the effectiveness of paid and organic search strategies. The report emphasizes the importance of customer relationship management, website content, and loyalty programs to improve customer retention and overall website performance, offering actionable insights to enhance the Google Merchandise Store's digital presence.
Running Head:ANALYSIS
ANALYSIS
Insert Your Name Here
Insert Your Tutor’s Name Here
Institution Affiliation
Date
ANALYSIS
Insert Your Name Here
Insert Your Tutor’s Name Here
Institution Affiliation
Date
Paraphrase This Document
Need a fresh take? Get an instant paraphrase of this document with our AI Paraphraser
ANALYSIS
Introduction 2
Section 1: Google Analytic Report 3
The visitors 3
The Bounce Rate 4
The Session 4
Visitor information 5
Sources 6
Section 2:Search 7
How search has been improved 7
Section 3: Interpretation of data 9
Section 4:Recommendation 11
References 13
Introduction 2
Section 1: Google Analytic Report 3
The visitors 3
The Bounce Rate 4
The Session 4
Visitor information 5
Sources 6
Section 2:Search 7
How search has been improved 7
Section 3: Interpretation of data 9
Section 4:Recommendation 11
References 13
ANALYSIS
Introduction
This is a report for Google Merchandise Store that will depict the website
‘googlemerchandisestore.com’ analytics. The report will show the google analytic report, the search
analysis, the interpretation of and recommendation, that will help improve the traffic to the website.
Google Analytics tool will be used in the project. Using the tool real time data will be retrieved and
data will be analyzed and presented in graphical representation for a a better understanding (McMullen,
2010). This will enable the company to make reliable and valid decisions that will help in the
improvement of website traffic flow.
It is important to understand how the tool works, in order to maximize on its utilities and also get to
understand the what the reported data means. The tool will help us in retrieving the website
performance, the visitors behavior on the website, the sales made within specific period and more
information regarding the websites.
Objectives
The objectives for this report include:
1. To increase the number of visitors in the site by 10 % monthly.
2. To retain customer who use the website to buy goods and services by 80%.
3. To enhance the Search Engine Optimization on the site using Key Planner.
4. To improve on marketing the website.
Section 1: Google Analytic Report
There is much report that was retrieved from the website using the Google Analytics Tool. The report
will range within a period of one month in order to view the trend after the Google Analytic tool was
integrated with the website (Bilella, 2013).
The visitors
In the last one month, the website site visitors have increased to 7,426 users in the site. The navigation
on the site has also been great. The average duration that the users remain on the site, is 2 minutes. The
trend on the visitors is not gradually increasing. During the weekends, there seems to be less visitor so
the site.
⊘ This is a preview!⊘
Do you want full access?
Subscribe today to unlock all pages.
Trusted by 1+ million students worldwide
ANALYSIS
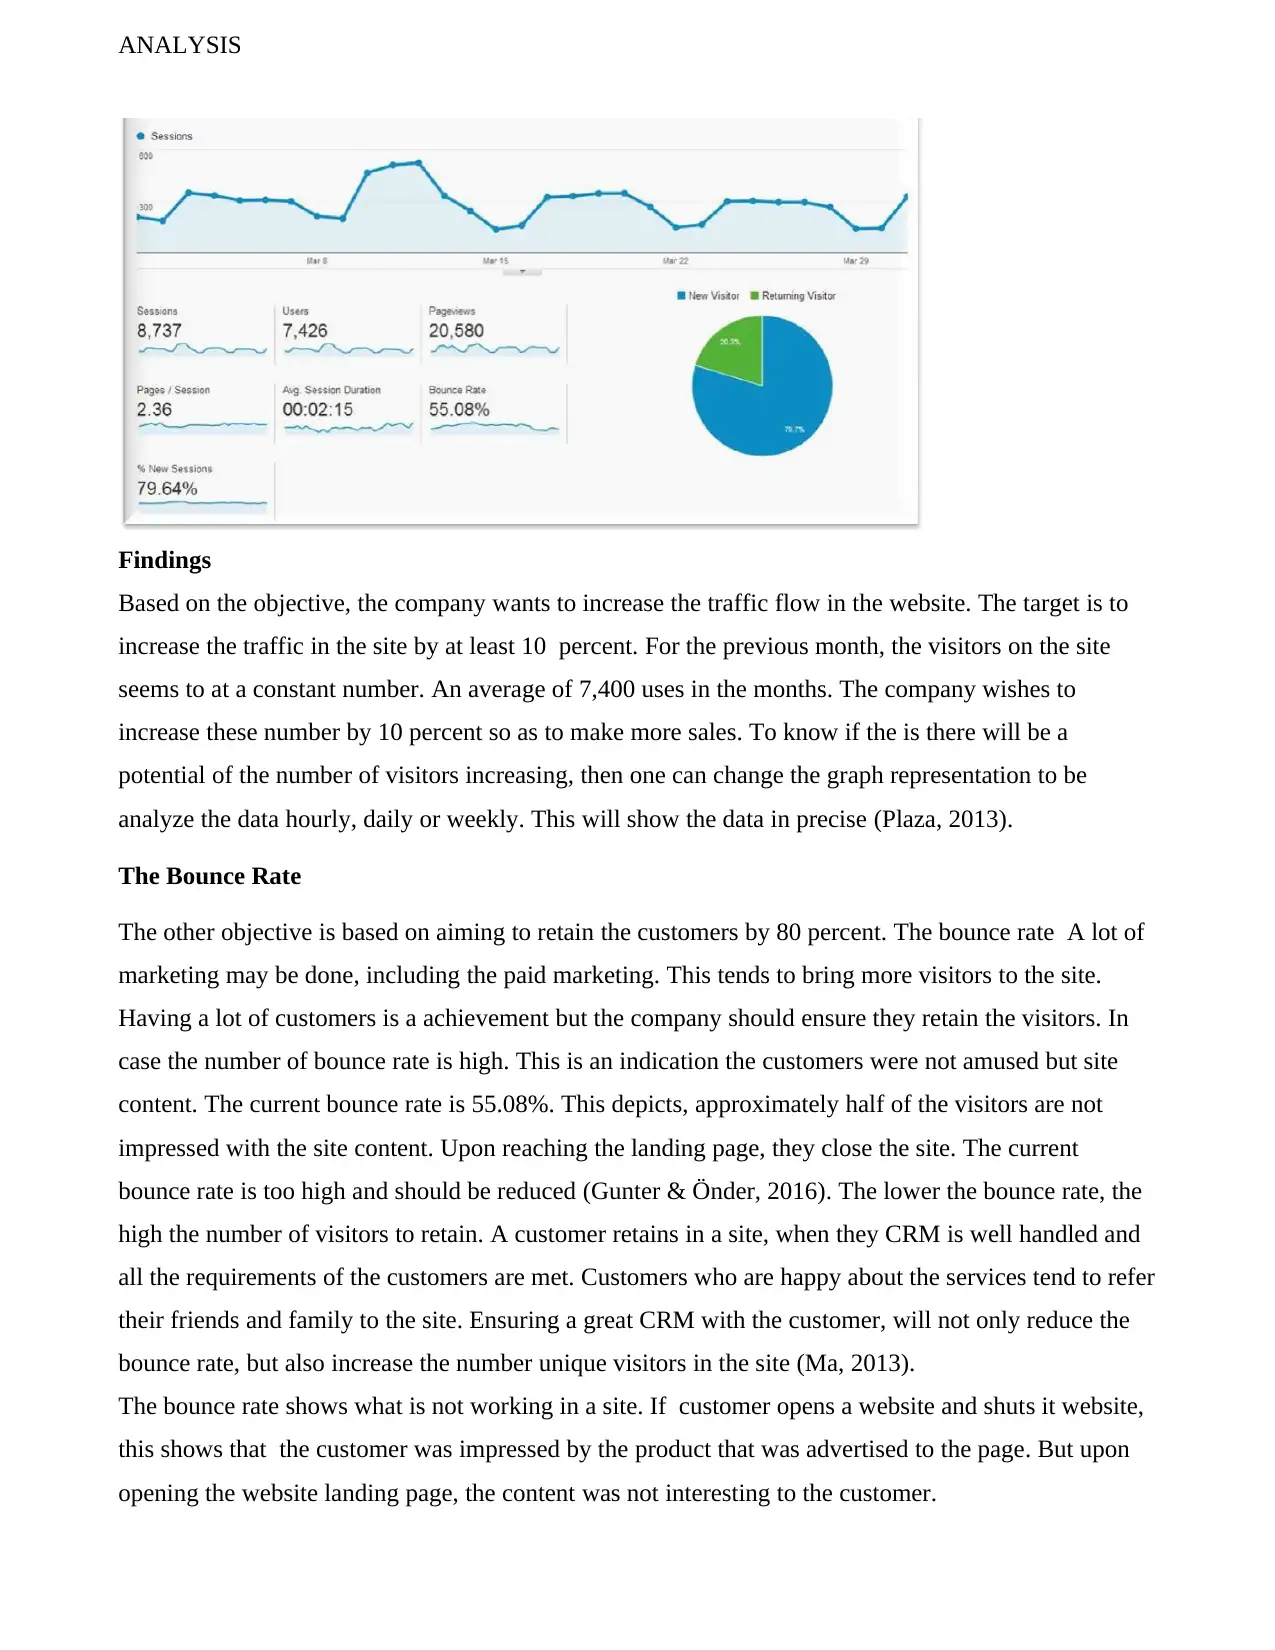
Findings
Based on the objective, the company wants to increase the traffic flow in the website. The target is to
increase the traffic in the site by at least 10 percent. For the previous month, the visitors on the site
seems to at a constant number. An average of 7,400 uses in the months. The company wishes to
increase these number by 10 percent so as to make more sales. To know if the is there will be a
potential of the number of visitors increasing, then one can change the graph representation to be
analyze the data hourly, daily or weekly. This will show the data in precise (Plaza, 2013).
The Bounce Rate
The other objective is based on aiming to retain the customers by 80 percent. The bounce rate A lot of
marketing may be done, including the paid marketing. This tends to bring more visitors to the site.
Having a lot of customers is a achievement but the company should ensure they retain the visitors. In
case the number of bounce rate is high. This is an indication the customers were not amused but site
content. The current bounce rate is 55.08%. This depicts, approximately half of the visitors are not
impressed with the site content. Upon reaching the landing page, they close the site. The current
bounce rate is too high and should be reduced (Gunter & Önder, 2016). The lower the bounce rate, the
high the number of visitors to retain. A customer retains in a site, when they CRM is well handled and
all the requirements of the customers are met. Customers who are happy about the services tend to refer
their friends and family to the site. Ensuring a great CRM with the customer, will not only reduce the
bounce rate, but also increase the number unique visitors in the site (Ma, 2013).
The bounce rate shows what is not working in a site. If customer opens a website and shuts it website,
this shows that the customer was impressed by the product that was advertised to the page. But upon
opening the website landing page, the content was not interesting to the customer.
Paraphrase This Document
Need a fresh take? Get an instant paraphrase of this document with our AI Paraphraser
ANALYSIS
The bounce rate tends to measure the visitor engagement on the site. From the business perspective, it
tends to provide an index for Return on Investment. The bounced visitors can be seen as a loss of
money. Its is important to reduce and minimize the bounce rate as much as possible.
The Session
The Google Analytics tool is also used to record the time every visitor remains navigating in the site.
The session normally starts when a user load a website page. It ends after 30 minutes of inactivity.
Every page view is tracked.
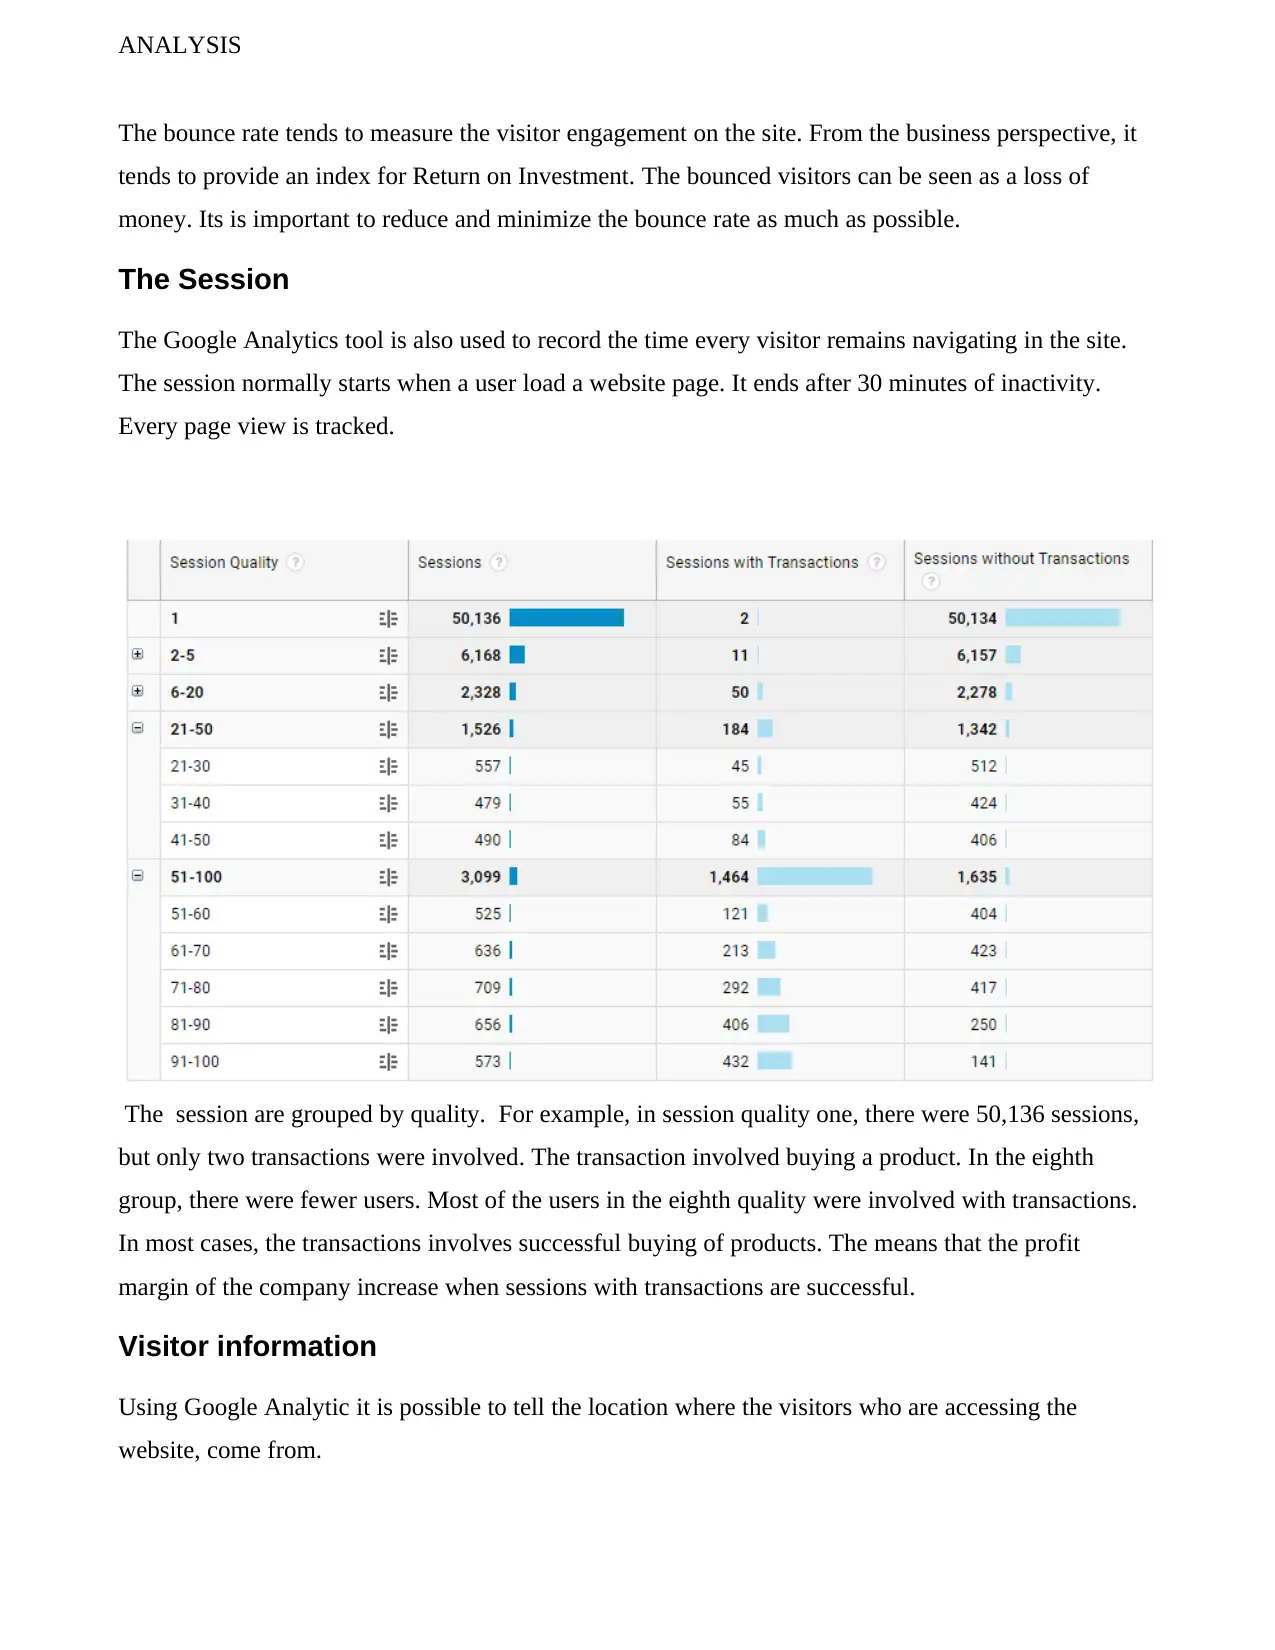
The session are grouped by quality. For example, in session quality one, there were 50,136 sessions,
but only two transactions were involved. The transaction involved buying a product. In the eighth
group, there were fewer users. Most of the users in the eighth quality were involved with transactions.
In most cases, the transactions involves successful buying of products. The means that the profit
margin of the company increase when sessions with transactions are successful.
Visitor information
Using Google Analytic it is possible to tell the location where the visitors who are accessing the
website, come from.
The bounce rate tends to measure the visitor engagement on the site. From the business perspective, it
tends to provide an index for Return on Investment. The bounced visitors can be seen as a loss of
money. Its is important to reduce and minimize the bounce rate as much as possible.
The Session
The Google Analytics tool is also used to record the time every visitor remains navigating in the site.
The session normally starts when a user load a website page. It ends after 30 minutes of inactivity.
Every page view is tracked.
The session are grouped by quality. For example, in session quality one, there were 50,136 sessions,
but only two transactions were involved. The transaction involved buying a product. In the eighth
group, there were fewer users. Most of the users in the eighth quality were involved with transactions.
In most cases, the transactions involves successful buying of products. The means that the profit
margin of the company increase when sessions with transactions are successful.
Visitor information
Using Google Analytic it is possible to tell the location where the visitors who are accessing the
website, come from.
ANALYSIS
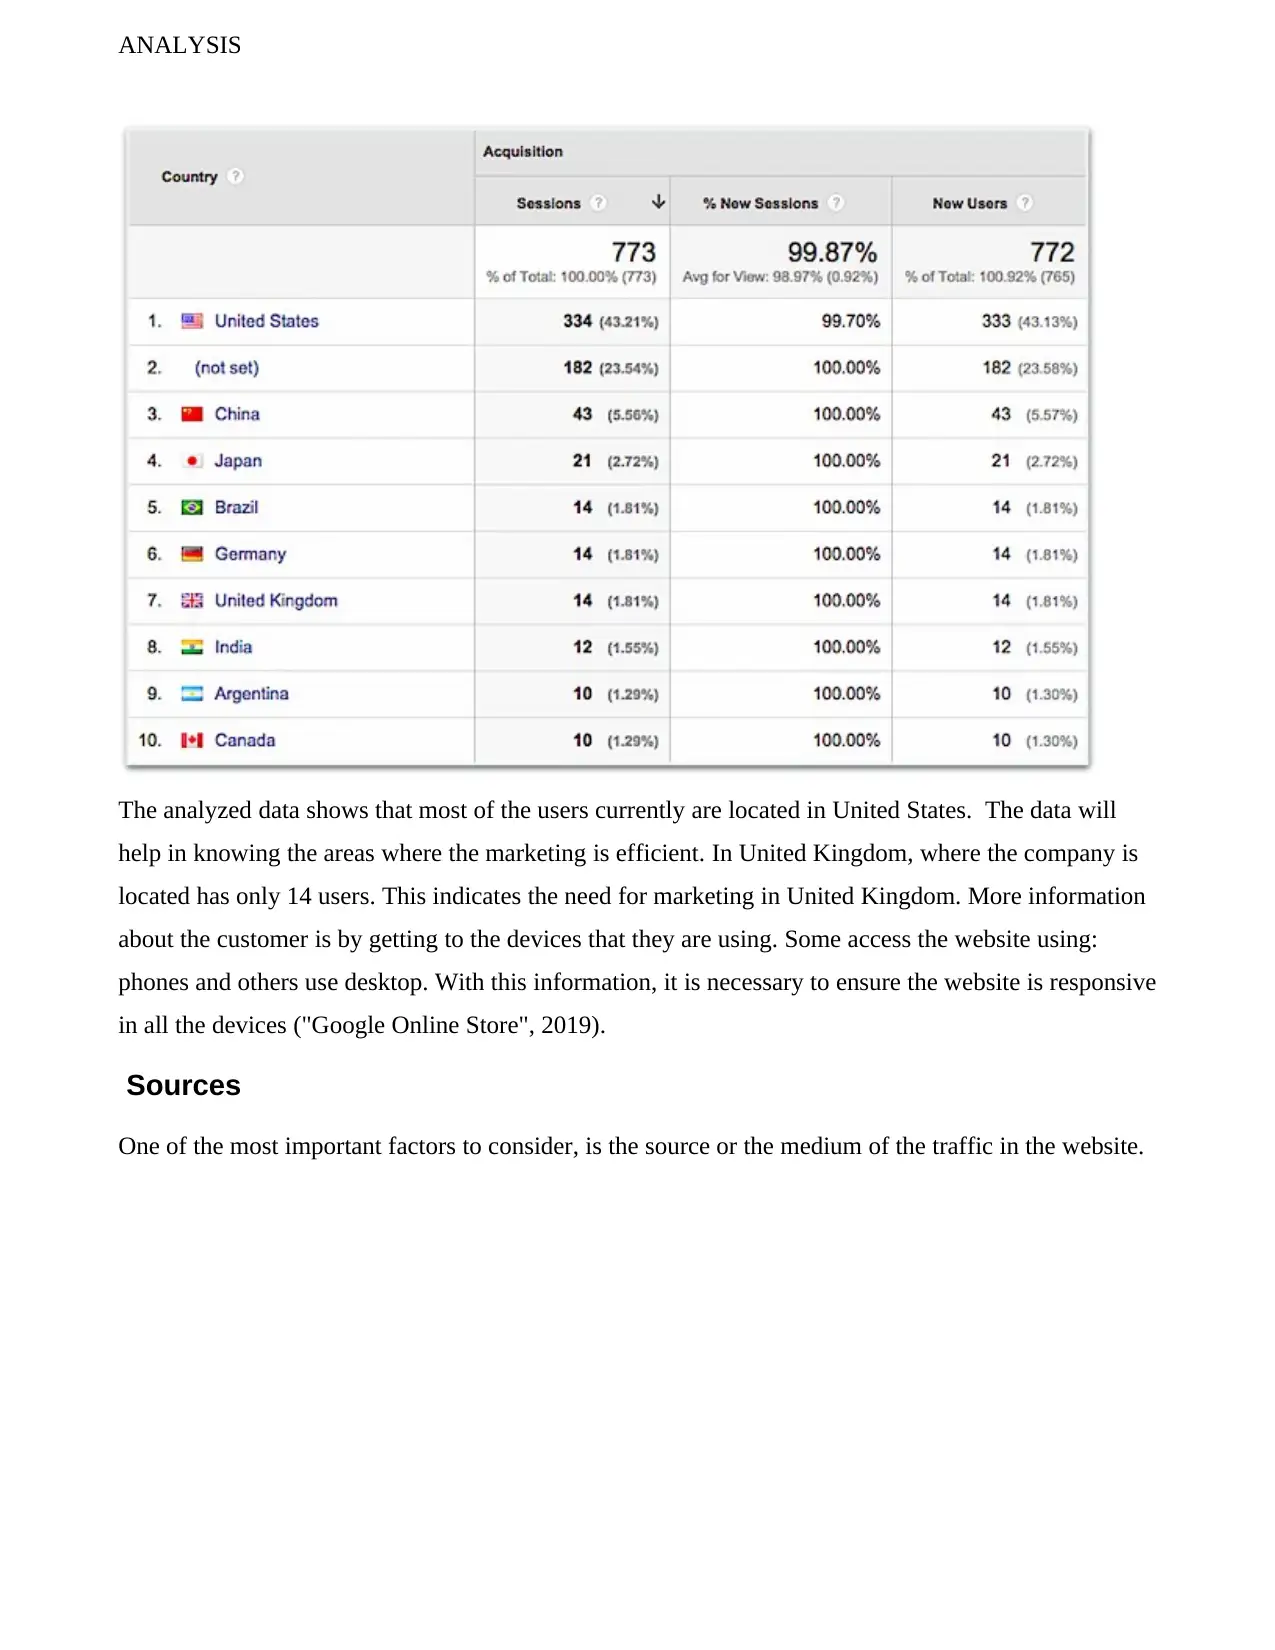
The analyzed data shows that most of the users currently are located in United States. The data will
help in knowing the areas where the marketing is efficient. In United Kingdom, where the company is
located has only 14 users. This indicates the need for marketing in United Kingdom. More information
about the customer is by getting to the devices that they are using. Some access the website using:
phones and others use desktop. With this information, it is necessary to ensure the website is responsive
in all the devices ("Google Online Store", 2019).
Sources
One of the most important factors to consider, is the source or the medium of the traffic in the website.
⊘ This is a preview!⊘
Do you want full access?
Subscribe today to unlock all pages.
Trusted by 1+ million students worldwide
ANALYSIS
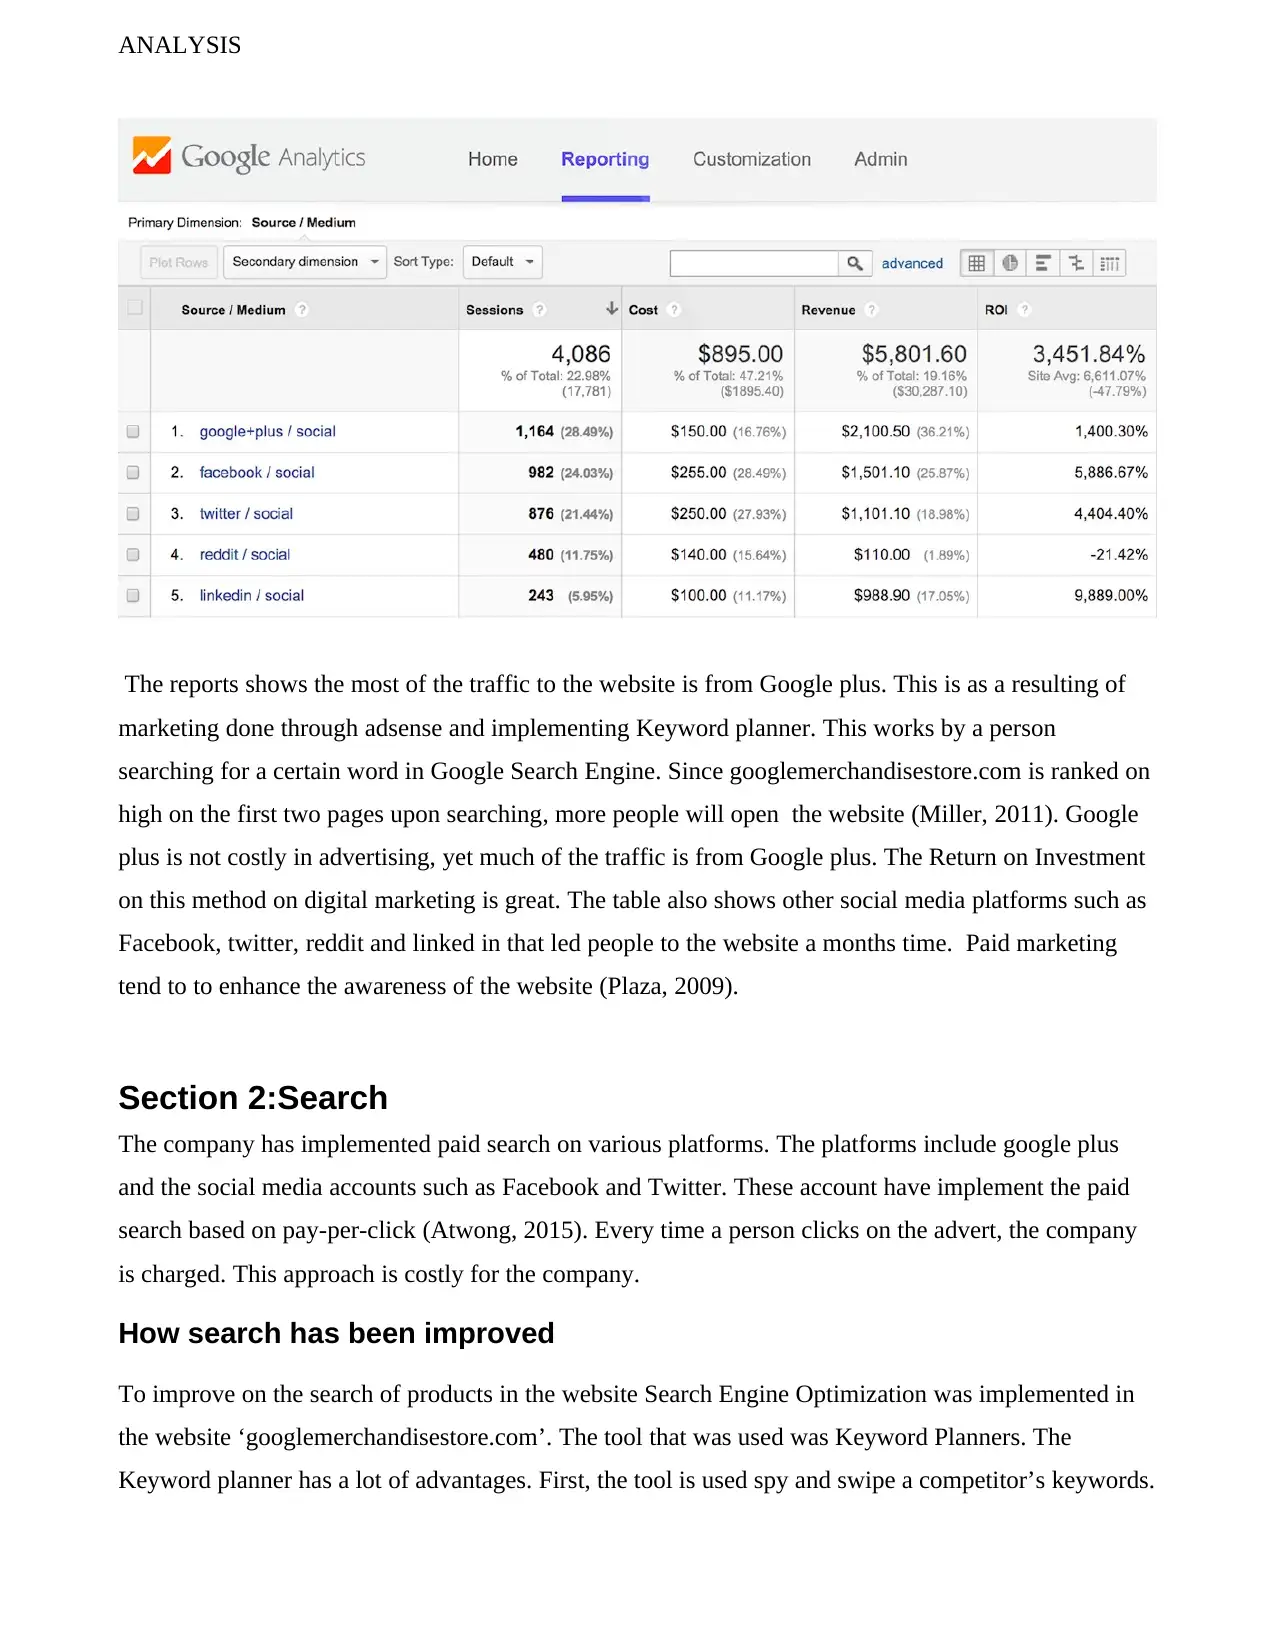
The reports shows the most of the traffic to the website is from Google plus. This is as a resulting of
marketing done through adsense and implementing Keyword planner. This works by a person
searching for a certain word in Google Search Engine. Since googlemerchandisestore.com is ranked on
high on the first two pages upon searching, more people will open the website (Miller, 2011). Google
plus is not costly in advertising, yet much of the traffic is from Google plus. The Return on Investment
on this method on digital marketing is great. The table also shows other social media platforms such as
Facebook, twitter, reddit and linked in that led people to the website a months time. Paid marketing
tend to to enhance the awareness of the website (Plaza, 2009).
Section 2:Search
The company has implemented paid search on various platforms. The platforms include google plus
and the social media accounts such as Facebook and Twitter. These account have implement the paid
search based on pay-per-click (Atwong, 2015). Every time a person clicks on the advert, the company
is charged. This approach is costly for the company.
How search has been improved
To improve on the search of products in the website Search Engine Optimization was implemented in
the website ‘googlemerchandisestore.com’. The tool that was used was Keyword Planners. The
Keyword planner has a lot of advantages. First, the tool is used spy and swipe a competitor’s keywords.
Paraphrase This Document
Need a fresh take? Get an instant paraphrase of this document with our AI Paraphraser
ANALYSIS
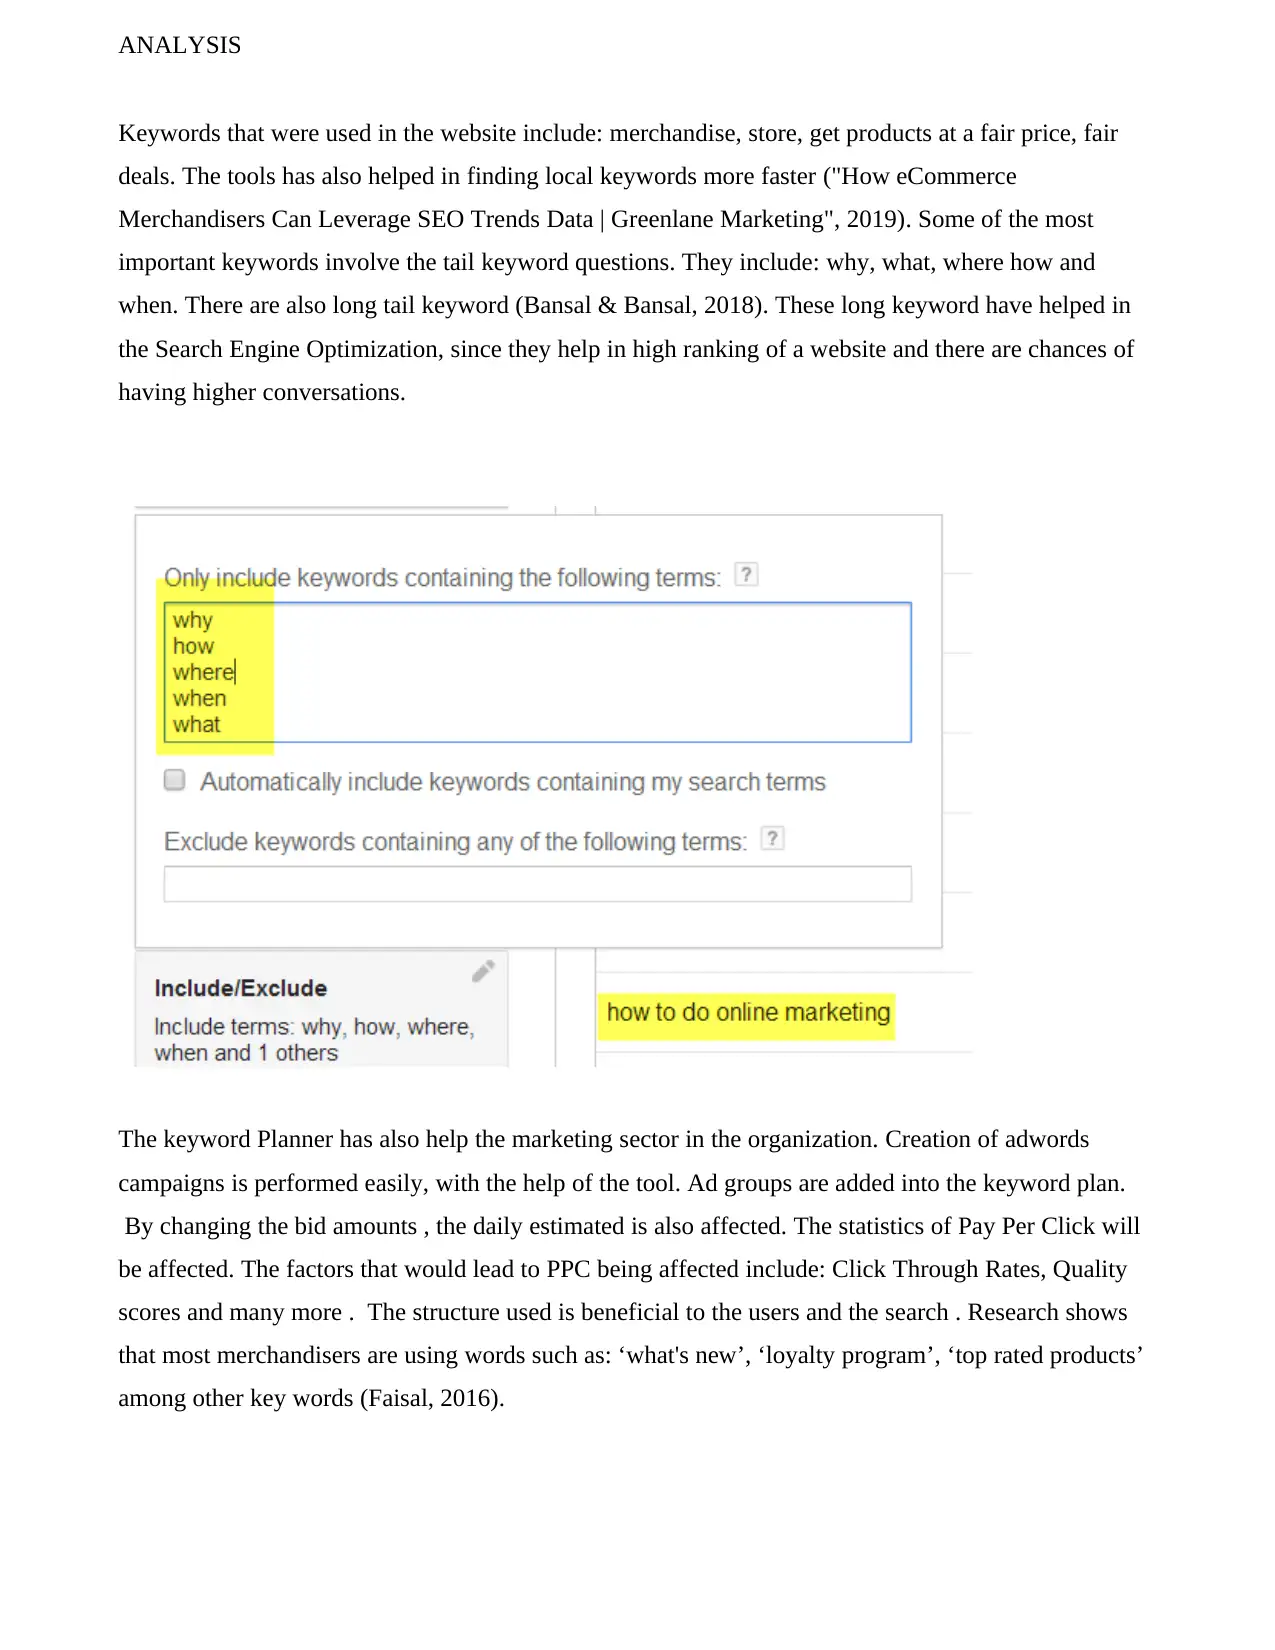
Keywords that were used in the website include: merchandise, store, get products at a fair price, fair
deals. The tools has also helped in finding local keywords more faster ("How eCommerce
Merchandisers Can Leverage SEO Trends Data | Greenlane Marketing", 2019). Some of the most
important keywords involve the tail keyword questions. They include: why, what, where how and
when. There are also long tail keyword (Bansal & Bansal, 2018). These long keyword have helped in
the Search Engine Optimization, since they help in high ranking of a website and there are chances of
having higher conversations.
The keyword Planner has also help the marketing sector in the organization. Creation of adwords
campaigns is performed easily, with the help of the tool. Ad groups are added into the keyword plan.
By changing the bid amounts , the daily estimated is also affected. The statistics of Pay Per Click will
be affected. The factors that would lead to PPC being affected include: Click Through Rates, Quality
scores and many more . The structure used is beneficial to the users and the search . Research shows
that most merchandisers are using words such as: ‘what's new’, ‘loyalty program’, ‘top rated products’
among other key words (Faisal, 2016).
ANALYSIS
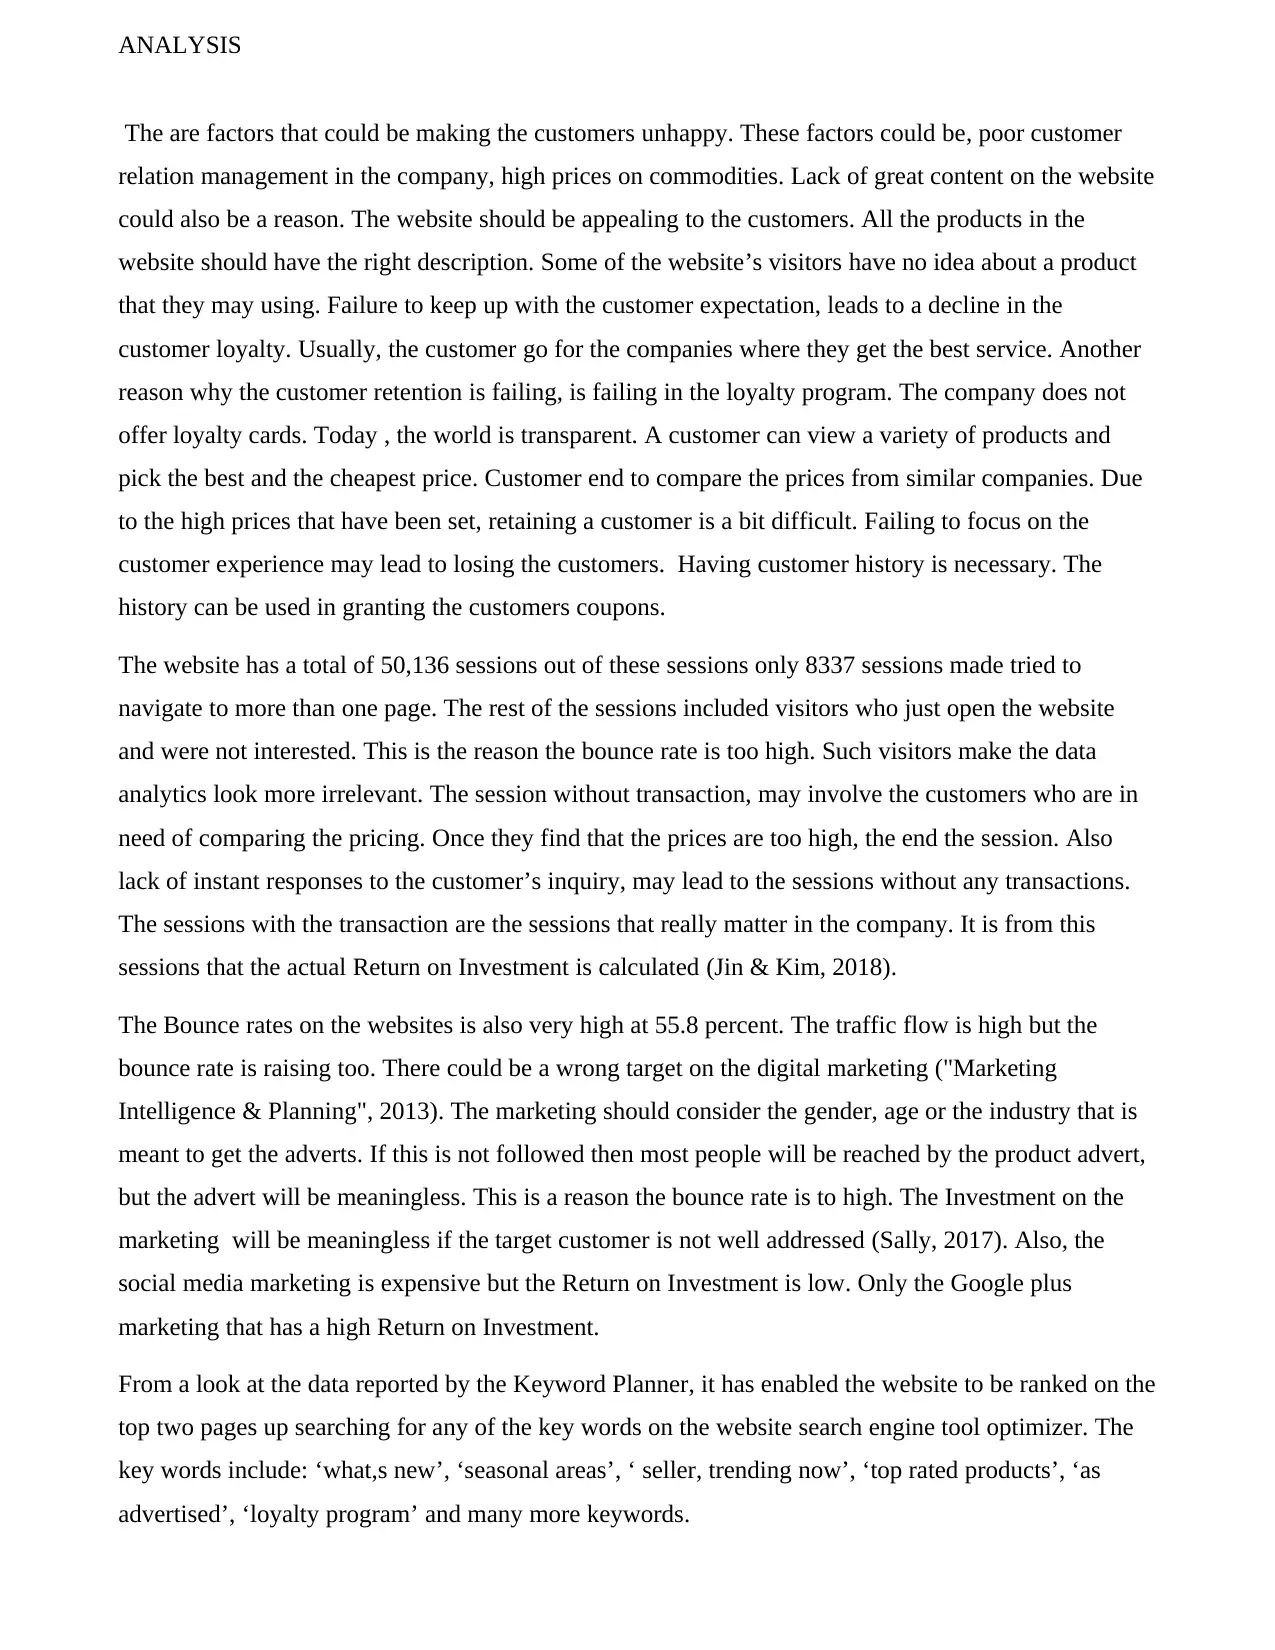
Section 3: Interpretation of data
From the data represented above, the reports clearly indicate that there is some improvement in the
Return on Investment. The graph is not descending but constant. This graphical representation in the
past one month shows that more customers are visiting the website , but the retention rate is quite low.
The rate of the returning visitors is 30 percent only, where as the rate of having the new visitors at 70
%. This shows that the company marketing department is performing well. Having a rate of 70 % new
visitors is good for the company. The problem comes when retaining the customers is a problems.
⊘ This is a preview!⊘
Do you want full access?
Subscribe today to unlock all pages.
Trusted by 1+ million students worldwide
ANALYSIS
The are factors that could be making the customers unhappy. These factors could be, poor customer
relation management in the company, high prices on commodities. Lack of great content on the website
could also be a reason. The website should be appealing to the customers. All the products in the
website should have the right description. Some of the website’s visitors have no idea about a product
that they may using. Failure to keep up with the customer expectation, leads to a decline in the
customer loyalty. Usually, the customer go for the companies where they get the best service. Another
reason why the customer retention is failing, is failing in the loyalty program. The company does not
offer loyalty cards. Today , the world is transparent. A customer can view a variety of products and
pick the best and the cheapest price. Customer end to compare the prices from similar companies. Due
to the high prices that have been set, retaining a customer is a bit difficult. Failing to focus on the
customer experience may lead to losing the customers. Having customer history is necessary. The
history can be used in granting the customers coupons.
The website has a total of 50,136 sessions out of these sessions only 8337 sessions made tried to
navigate to more than one page. The rest of the sessions included visitors who just open the website
and were not interested. This is the reason the bounce rate is too high. Such visitors make the data
analytics look more irrelevant. The session without transaction, may involve the customers who are in
need of comparing the pricing. Once they find that the prices are too high, the end the session. Also
lack of instant responses to the customer’s inquiry, may lead to the sessions without any transactions.
The sessions with the transaction are the sessions that really matter in the company. It is from this
sessions that the actual Return on Investment is calculated (Jin & Kim, 2018).
The Bounce rates on the websites is also very high at 55.8 percent. The traffic flow is high but the
bounce rate is raising too. There could be a wrong target on the digital marketing ("Marketing
Intelligence & Planning", 2013). The marketing should consider the gender, age or the industry that is
meant to get the adverts. If this is not followed then most people will be reached by the product advert,
but the advert will be meaningless. This is a reason the bounce rate is to high. The Investment on the
marketing will be meaningless if the target customer is not well addressed (Sally, 2017). Also, the
social media marketing is expensive but the Return on Investment is low. Only the Google plus
marketing that has a high Return on Investment.
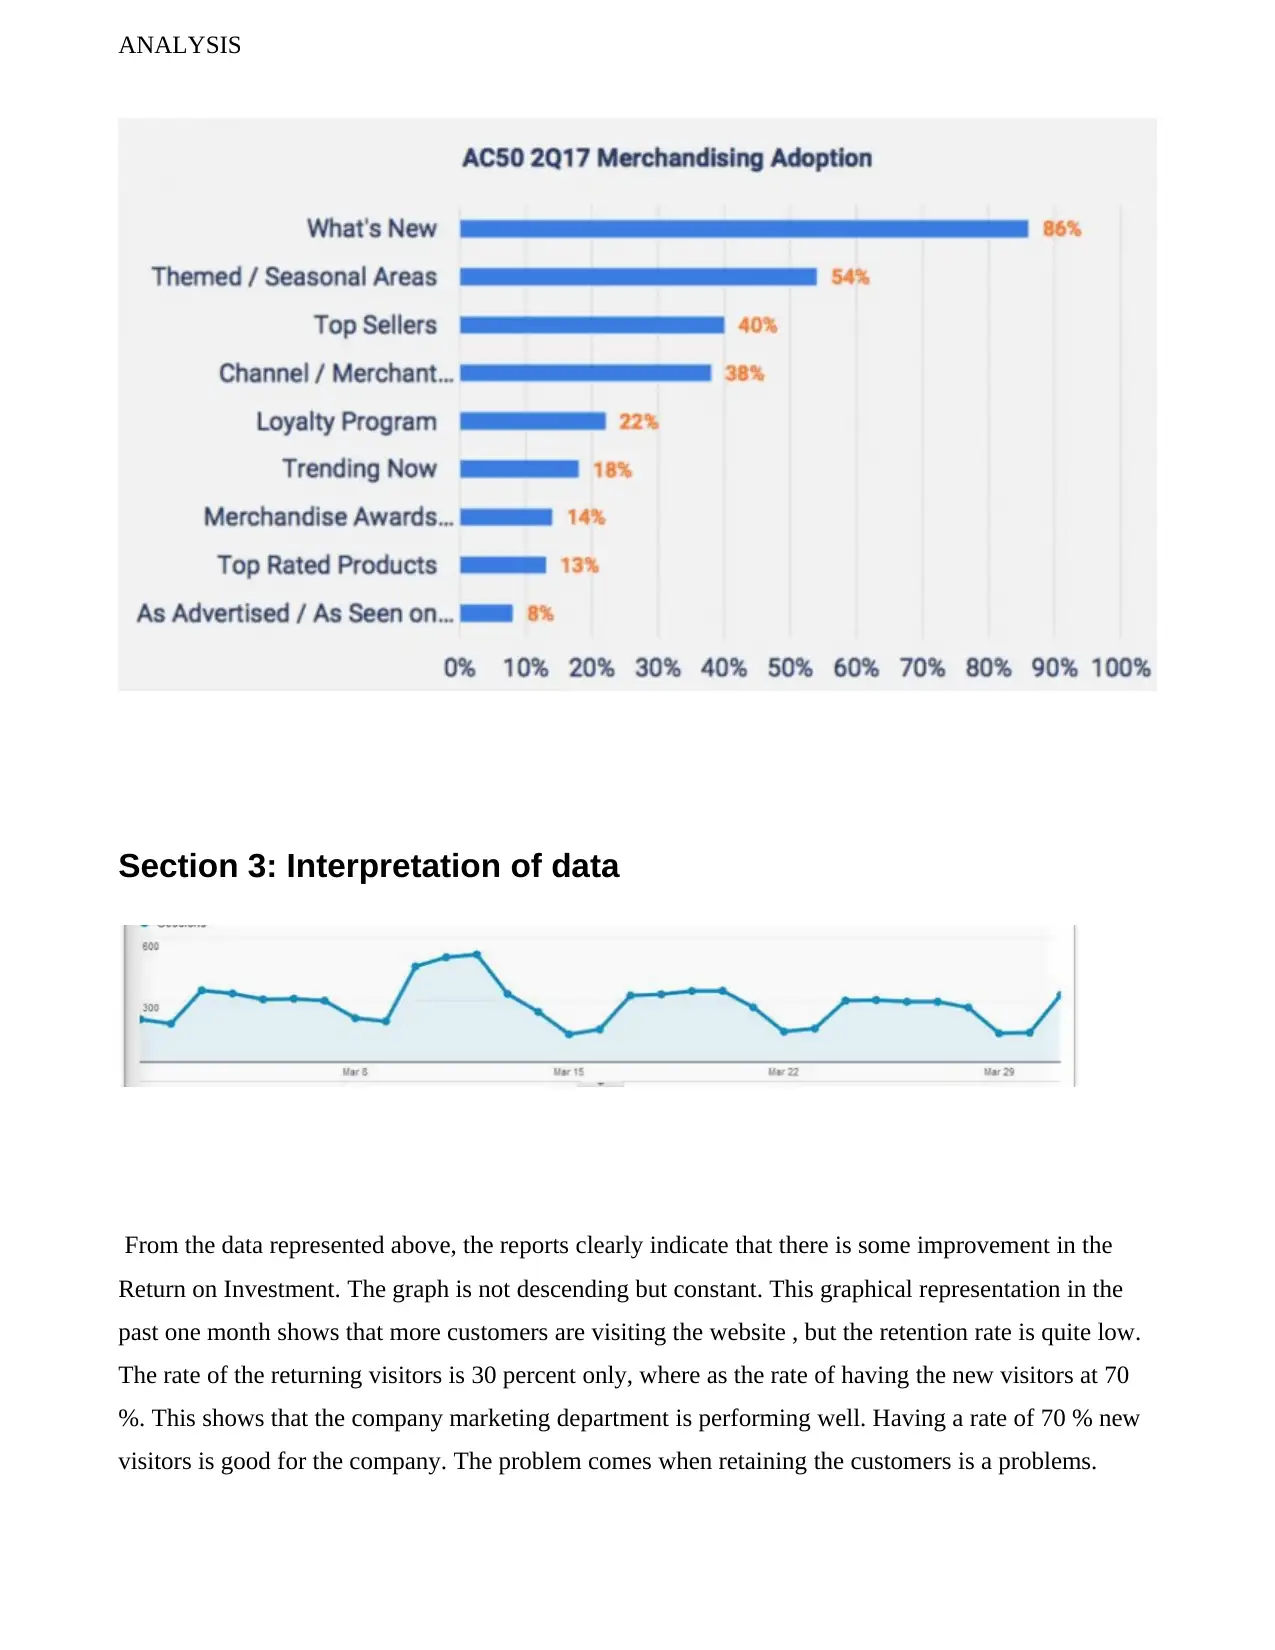
From a look at the data reported by the Keyword Planner, it has enabled the website to be ranked on the
top two pages up searching for any of the key words on the website search engine tool optimizer. The
key words include: ‘what,s new’, ‘seasonal areas’, ‘ seller, trending now’, ‘top rated products’, ‘as
advertised’, ‘loyalty program’ and many more keywords.
The are factors that could be making the customers unhappy. These factors could be, poor customer
relation management in the company, high prices on commodities. Lack of great content on the website
could also be a reason. The website should be appealing to the customers. All the products in the
website should have the right description. Some of the website’s visitors have no idea about a product
that they may using. Failure to keep up with the customer expectation, leads to a decline in the
customer loyalty. Usually, the customer go for the companies where they get the best service. Another
reason why the customer retention is failing, is failing in the loyalty program. The company does not
offer loyalty cards. Today , the world is transparent. A customer can view a variety of products and
pick the best and the cheapest price. Customer end to compare the prices from similar companies. Due
to the high prices that have been set, retaining a customer is a bit difficult. Failing to focus on the
customer experience may lead to losing the customers. Having customer history is necessary. The
history can be used in granting the customers coupons.
The website has a total of 50,136 sessions out of these sessions only 8337 sessions made tried to
navigate to more than one page. The rest of the sessions included visitors who just open the website
and were not interested. This is the reason the bounce rate is too high. Such visitors make the data
analytics look more irrelevant. The session without transaction, may involve the customers who are in
need of comparing the pricing. Once they find that the prices are too high, the end the session. Also
lack of instant responses to the customer’s inquiry, may lead to the sessions without any transactions.
The sessions with the transaction are the sessions that really matter in the company. It is from this
sessions that the actual Return on Investment is calculated (Jin & Kim, 2018).
The Bounce rates on the websites is also very high at 55.8 percent. The traffic flow is high but the
bounce rate is raising too. There could be a wrong target on the digital marketing ("Marketing
Intelligence & Planning", 2013). The marketing should consider the gender, age or the industry that is
meant to get the adverts. If this is not followed then most people will be reached by the product advert,
but the advert will be meaningless. This is a reason the bounce rate is to high. The Investment on the
marketing will be meaningless if the target customer is not well addressed (Sally, 2017). Also, the
social media marketing is expensive but the Return on Investment is low. Only the Google plus
marketing that has a high Return on Investment.
From a look at the data reported by the Keyword Planner, it has enabled the website to be ranked on the
top two pages up searching for any of the key words on the website search engine tool optimizer. The
key words include: ‘what,s new’, ‘seasonal areas’, ‘ seller, trending now’, ‘top rated products’, ‘as
advertised’, ‘loyalty program’ and many more keywords.
Paraphrase This Document
Need a fresh take? Get an instant paraphrase of this document with our AI Paraphraser
ANALYSIS
Section 4:Recommendation
According to the report from the Google Analytics Tool, there are a number of factors that I will
recommend the company to consider in order to meet the objectives.
1. Develop a marketing plan
Before the implementation of Google Analytics Tool on the website, the company is recommended
have a clear marketing plan. The marketing plan is required have well laid out strategies on the
situation analysis (Doyle, 2012). The company should perform a SWOT situation analysis. The
marketing plan should also include clear marketing objectives , the marketing strategy and a clear
financial plan should be developed. The company should understand the market need and should make
their products and services meet the market needs. The company should develop and socialize a global
marketing plan early (Freeman, 2013). The campaigns should be managed and communication should
be enhanced at all levels. This includes the business to customer level and department to department
level. The marketing strategies should include clarifying what is driven globally and what is manage
locally.
2. Use Google Analytic Frequently
Then, the company should frequently use the Google Analytic tool. The tool is free and data analyzed
from the website will enable the company to identify the business flaws and make valid decisions in
solving the business issues (Zineldin, 2010).
3. Identify the target market
There are quite a number of factor the company did not consider before the implementing the
marketing of the products. The company should have a clear plan on the customer they intend to reach.
A target market profile is necessary (Chung, 2014). The target market profile will include the
demographic portrait, estimated demand and purchase motivation. As the company’s objective is to
reach 10% new customers monthly, currently the rate of new visitors is at 70% . All the visitors on the
site are not actually depicting the right number. Random marketing will only increase the traffic in the
website but the bounce rate will keep on increasing. Also the number of visitor could not be interested
in the products.
4. Use Keyword Planner Frequently
The Keyword Planner is a strong tool that will help the company reach more customers compared to
the competitors. The company should ensure before posting any content on the website about various
products, they should use the Keyword planner.
ANALYSIS
Once these factors are considered the company, will get valid data that can be used in decision making
to improve on the Return On Investment. The company will have data that can be referenced in the
future.
Once these factors are considered the company, will get valid data that can be used in decision making
to improve on the Return On Investment. The company will have data that can be referenced in the
future.
⊘ This is a preview!⊘
Do you want full access?
Subscribe today to unlock all pages.
Trusted by 1+ million students worldwide
1 out of 14
Related Documents


Your All-in-One AI-Powered Toolkit for Academic Success.
+13062052269
info@desklib.com
Available 24*7 on WhatsApp / Email
![[object Object]](/_next/static/media/star-bottom.7253800d.svg)
Unlock your academic potential
Copyright © 2020–2026 A2Z Services. All Rights Reserved. Developed and managed by ZUCOL.