AMN425 Digital Strategy and Analytics: Google Merchandise Store Report
VerifiedAdded on 2022/10/10
|18
|3078
|43
Report
AI Summary
This report analyzes the Google Merchandise Store's digital strategy, focusing on increasing website traffic, boosting sales, and improving customer engagement within six months. The analysis utilizes Google Analytics data to evaluate key performance indicators (KPIs) such as website traffic sources (direct, organic, paid), sales funnel conversion rates, channel performance, site search effectiveness, and page load times. The report identifies areas for improvement, including the need for optimized SEO and paid search campaigns to drive traffic, streamlining the checkout process to reduce drop-off rates, and enhancing site content and speed to improve user experience and sales of men's t-shirts. Recommendations include implementing SEO strategies, improving website speed, and focusing on paid search campaigns to achieve the business objectives.
Running head: DIGITAL ANALYTICS REPORT 1
Google merchandise store analytics report
Student
Tutor
Institutional Affiliations
Date
Google merchandise store analytics report
Student
Tutor
Institutional Affiliations
Date
Paraphrase This Document
Need a fresh take? Get an instant paraphrase of this document with our AI Paraphraser
DIGITAL ANALYTICS REPORT 2
Google Analytics report
Introduction
In this report, we analyze reports using google analytics application to help google merchandise
review and develop their digital strategies for their online merchandise store. The e-commerce
can only achieve this by increasing their website traffic which would consequently increase their
sales. For this reason, we analyze various reports and offer recommendations that would help the
business achieve its objectives.
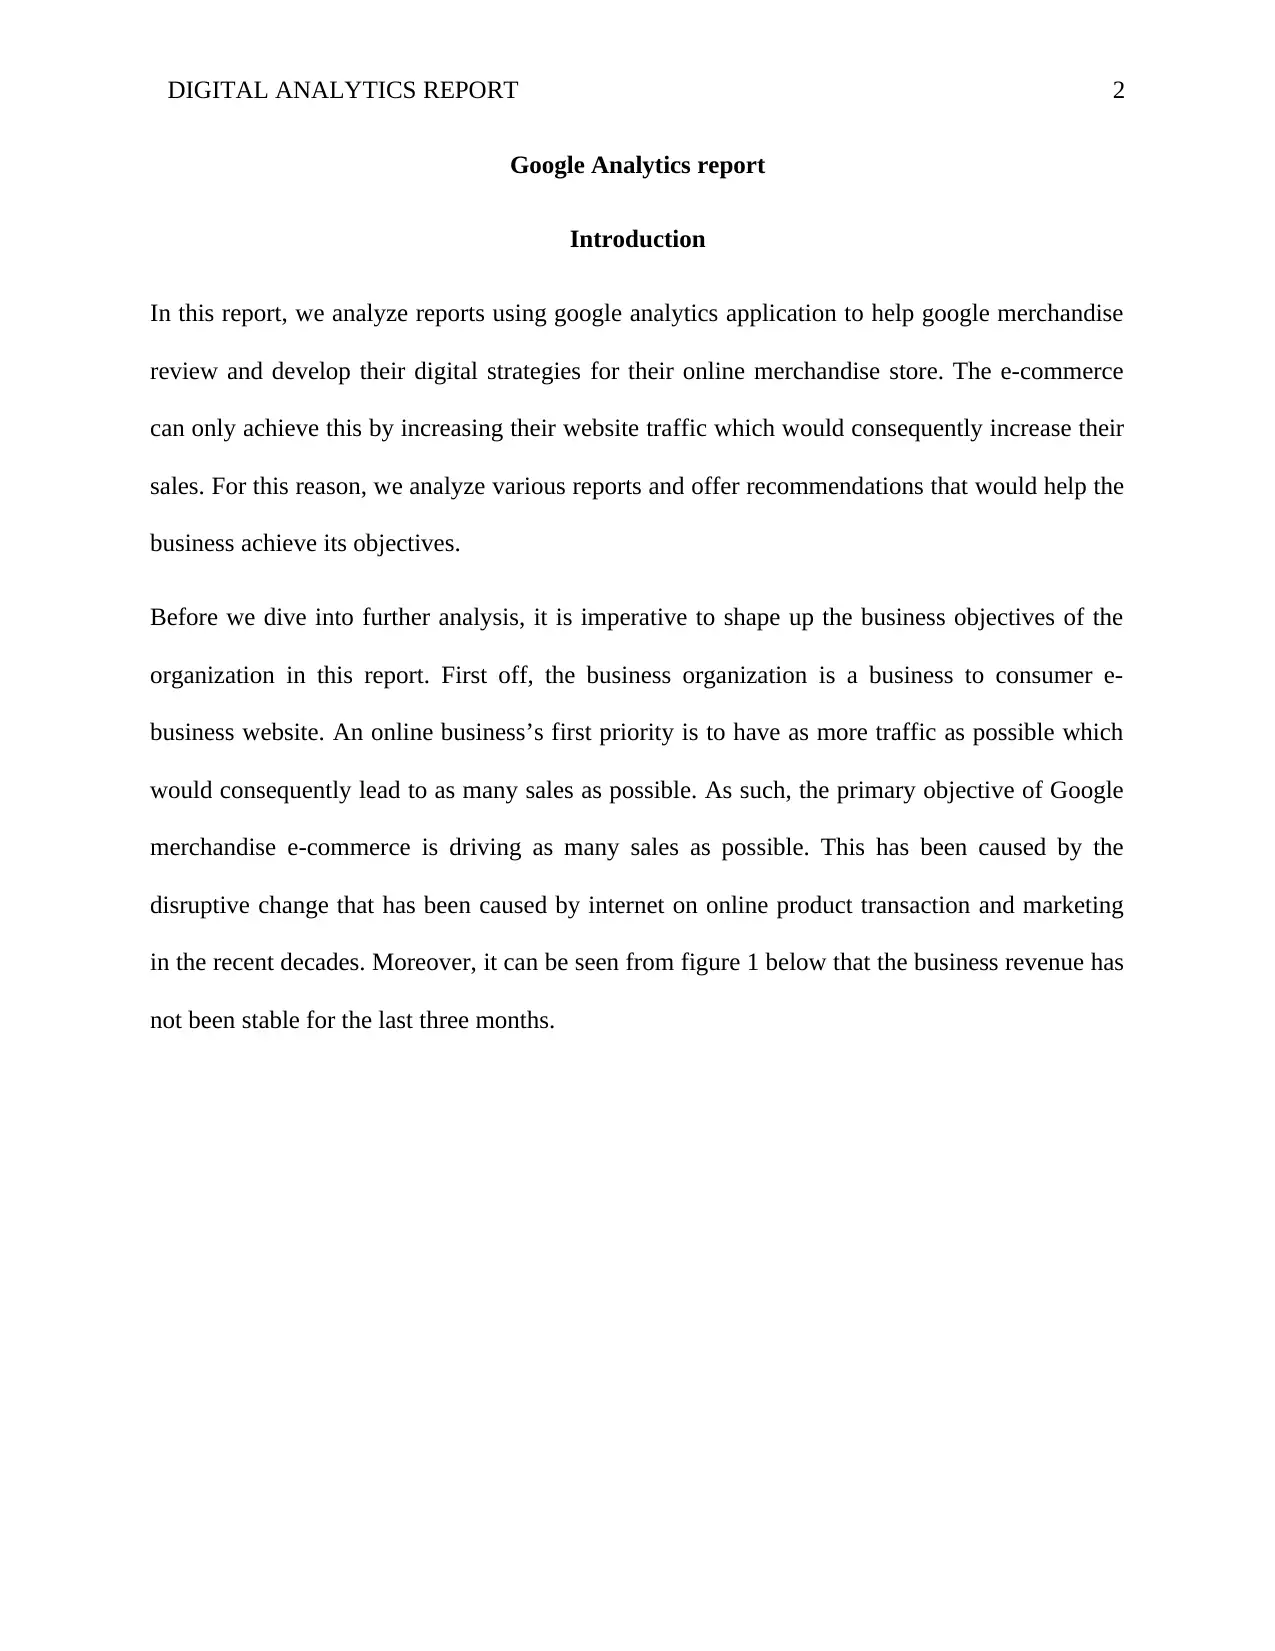
Before we dive into further analysis, it is imperative to shape up the business objectives of the
organization in this report. First off, the business organization is a business to consumer e-
business website. An online business’s first priority is to have as more traffic as possible which
would consequently lead to as many sales as possible. As such, the primary objective of Google
merchandise e-commerce is driving as many sales as possible. This has been caused by the
disruptive change that has been caused by internet on online product transaction and marketing
in the recent decades. Moreover, it can be seen from figure 1 below that the business revenue has
not been stable for the last three months.
Google Analytics report
Introduction
In this report, we analyze reports using google analytics application to help google merchandise
review and develop their digital strategies for their online merchandise store. The e-commerce
can only achieve this by increasing their website traffic which would consequently increase their
sales. For this reason, we analyze various reports and offer recommendations that would help the
business achieve its objectives.
Before we dive into further analysis, it is imperative to shape up the business objectives of the
organization in this report. First off, the business organization is a business to consumer e-
business website. An online business’s first priority is to have as more traffic as possible which
would consequently lead to as many sales as possible. As such, the primary objective of Google
merchandise e-commerce is driving as many sales as possible. This has been caused by the
disruptive change that has been caused by internet on online product transaction and marketing
in the recent decades. Moreover, it can be seen from figure 1 below that the business revenue has
not been stable for the last three months.
DIGITAL ANALYTICS REPORT 3
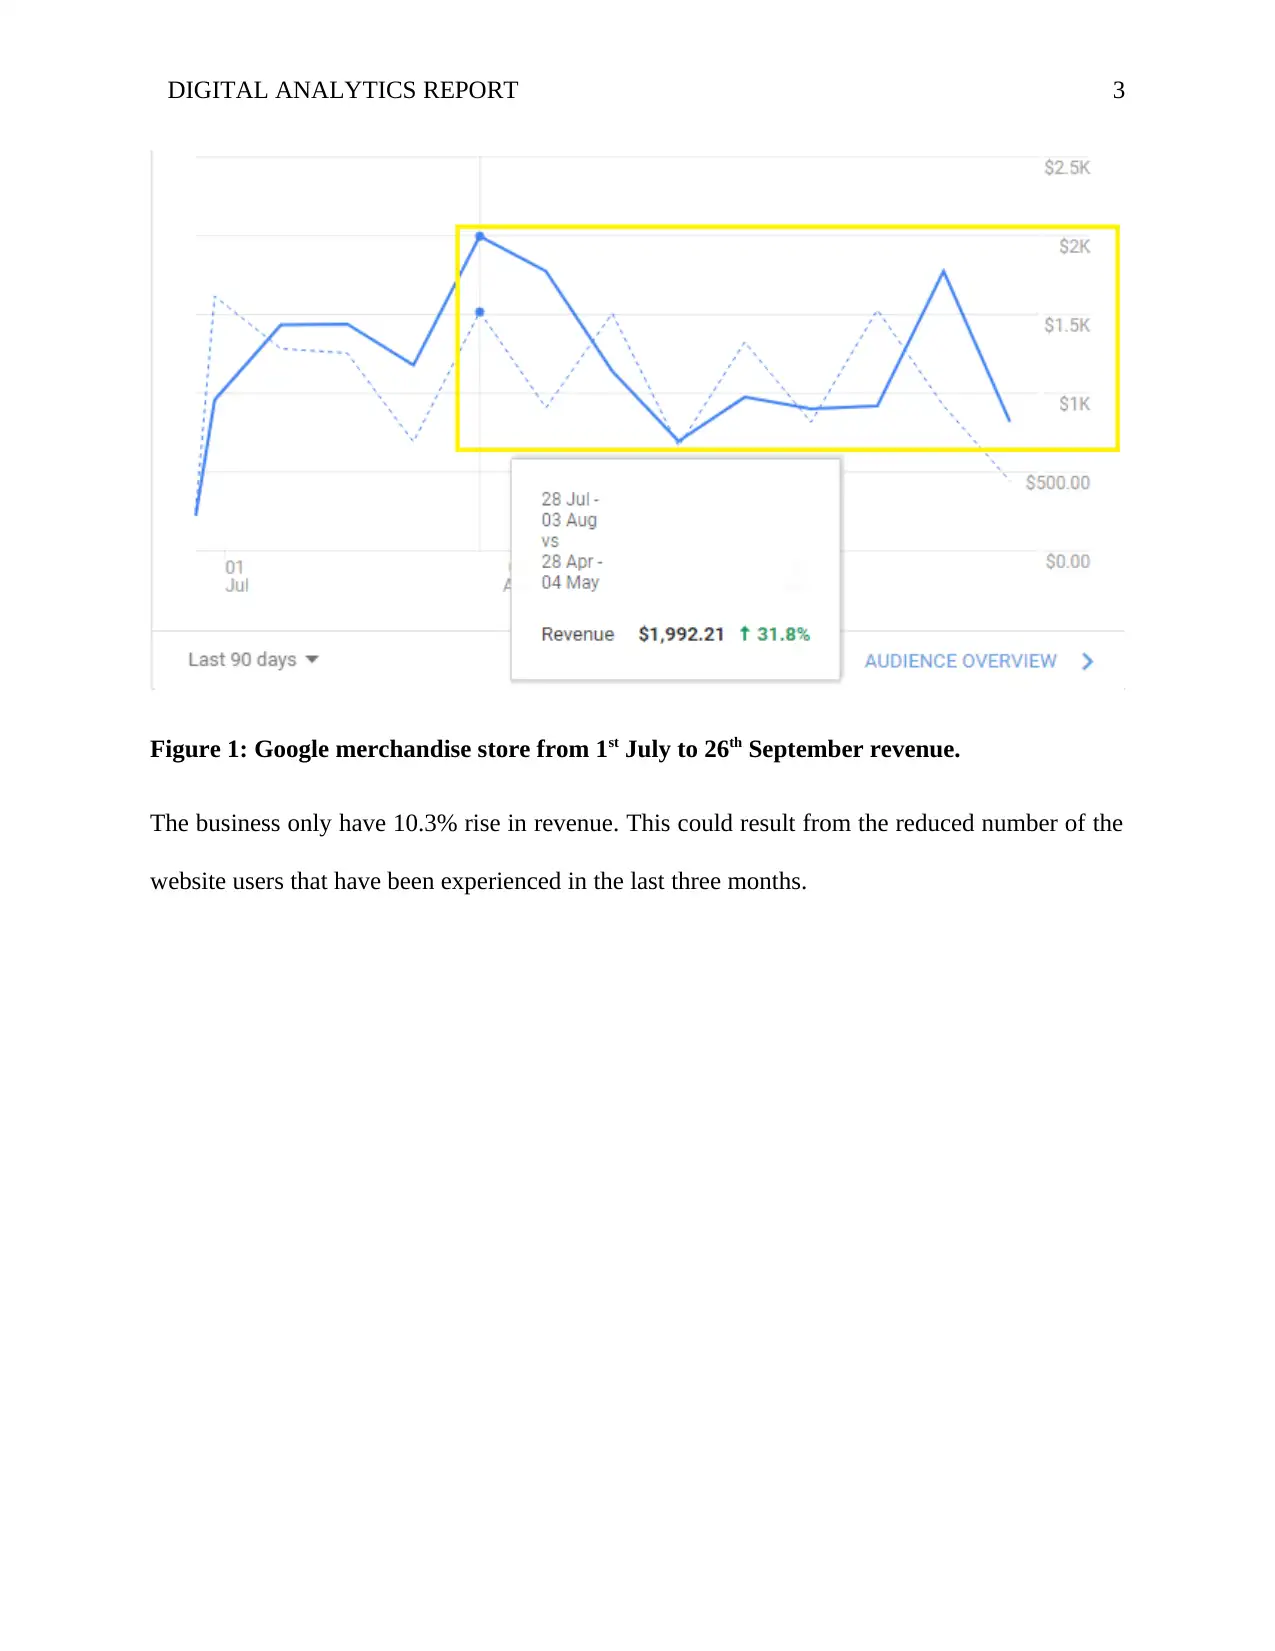
Figure 1: Google merchandise store from 1st July to 26th September revenue.
The business only have 10.3% rise in revenue. This could result from the reduced number of the
website users that have been experienced in the last three months.
Figure 1: Google merchandise store from 1st July to 26th September revenue.
The business only have 10.3% rise in revenue. This could result from the reduced number of the
website users that have been experienced in the last three months.
⊘ This is a preview!⊘
Do you want full access?
Subscribe today to unlock all pages.
Trusted by 1+ million students worldwide
DIGITAL ANALYTICS REPORT 4
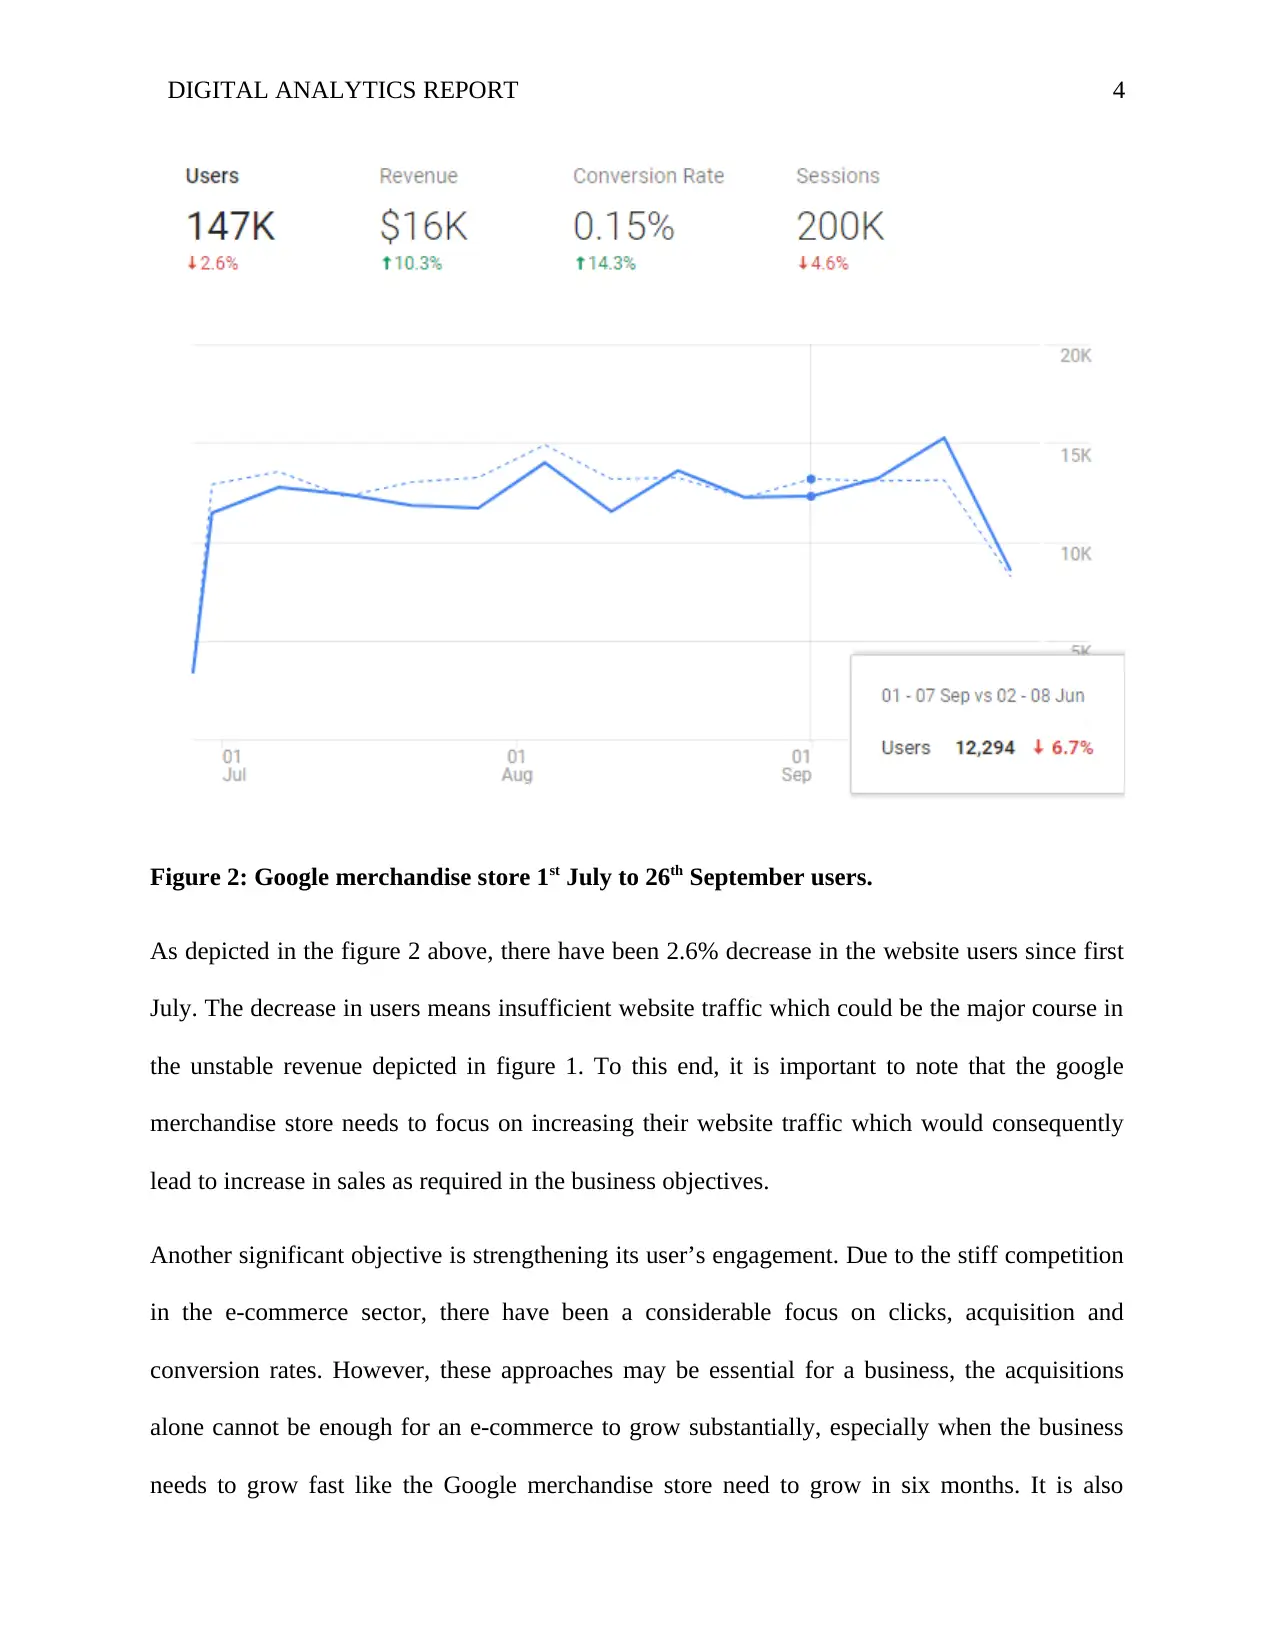
Figure 2: Google merchandise store 1st July to 26th September users.
As depicted in the figure 2 above, there have been 2.6% decrease in the website users since first
July. The decrease in users means insufficient website traffic which could be the major course in
the unstable revenue depicted in figure 1. To this end, it is important to note that the google
merchandise store needs to focus on increasing their website traffic which would consequently
lead to increase in sales as required in the business objectives.
Another significant objective is strengthening its user’s engagement. Due to the stiff competition
in the e-commerce sector, there have been a considerable focus on clicks, acquisition and
conversion rates. However, these approaches may be essential for a business, the acquisitions
alone cannot be enough for an e-commerce to grow substantially, especially when the business
needs to grow fast like the Google merchandise store need to grow in six months. It is also
Paraphrase This Document
Need a fresh take? Get an instant paraphrase of this document with our AI Paraphraser
DIGITAL ANALYTICS REPORT 5
essential for the organization to find some ways through which they can engage their customers
in terms of strengthening customers’ emotions towards the business brands.
This would help the organization to retain its customers they have already have while it also
contribute towards the growth of the business at a substantial rate. This is also supported by a
customer engagement study by Vivek, Beatty and Morgan (2012, pp.122-146) which found that
businesses who improve their customer engagements improve their sales and their growth rates.
With the findings of the study, it must be noted that customer engagement is directly related to
increase in the business sales and growth. As such, an engaging e-commerce website is a
successful asset of an organization. The e-commerce wants to increase the traffic and also
increase the sales of men’s t-shirts within six months. This would only be achieved by achieving
the above stated objectives. In this rationale, the report provide the solution regarding the
achievement of the organizations desired goals in six months-time as it provide the solution to
the objectives mentioned in the previous sections as shown in the following table.
Objectives Metrics Report analysis
Driving many sales Increase website traffic by
30%
Search campaigns (organic
and paid)
Improving customer
engagement
Increase sales by 15% Analysis of sales funnel
Analysis of channels
increase sales of the ‘men’s t-
shirts’ product line by 10%
Analysis of site search
Analysis site speed
DIGITAL ANALYTICS REPORT 6
1. Objective 1: Increase website traffic
a. Search campaigns (organic and paid)
This report is of great significance in addressing the organization’s objectives. Search
campaigns, be it organic or paid are great ways when it comes to driving more traffic to a
website. Its purpose is to display the evidence which show the relevance of both paid as well as
organic searches in boosting the organization traffic by 30% as required.
The organic search is mainly based on the naturally unpaid rankings which are determined by
Search engine optimizer SEO activities. Paid ads on the other hand involves paying for traffic.
These are driven by search engine optimization SEO and pay per click or pay per impression.
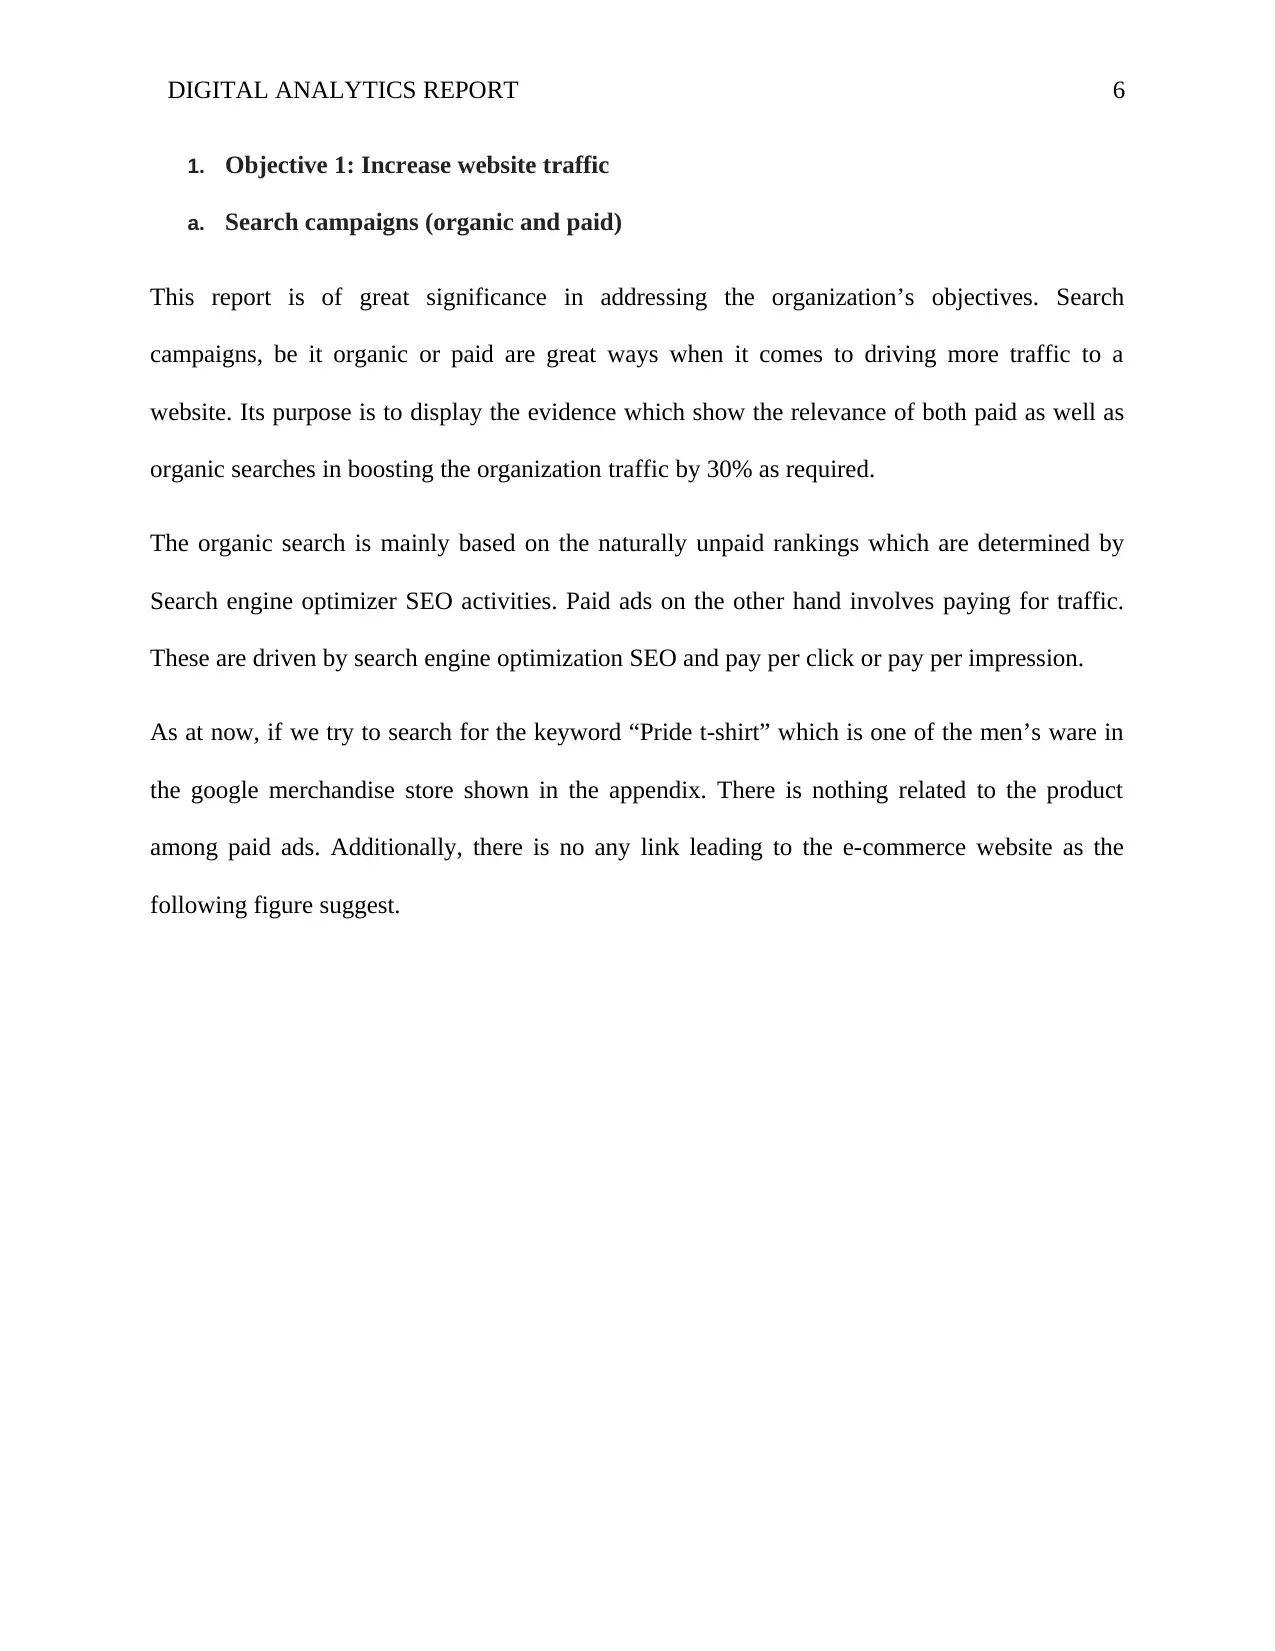
As at now, if we try to search for the keyword “Pride t-shirt” which is one of the men’s ware in
the google merchandise store shown in the appendix. There is nothing related to the product
among paid ads. Additionally, there is no any link leading to the e-commerce website as the
following figure suggest.
1. Objective 1: Increase website traffic
a. Search campaigns (organic and paid)
This report is of great significance in addressing the organization’s objectives. Search
campaigns, be it organic or paid are great ways when it comes to driving more traffic to a
website. Its purpose is to display the evidence which show the relevance of both paid as well as
organic searches in boosting the organization traffic by 30% as required.
The organic search is mainly based on the naturally unpaid rankings which are determined by
Search engine optimizer SEO activities. Paid ads on the other hand involves paying for traffic.
These are driven by search engine optimization SEO and pay per click or pay per impression.
As at now, if we try to search for the keyword “Pride t-shirt” which is one of the men’s ware in
the google merchandise store shown in the appendix. There is nothing related to the product
among paid ads. Additionally, there is no any link leading to the e-commerce website as the
following figure suggest.
⊘ This is a preview!⊘
Do you want full access?
Subscribe today to unlock all pages.
Trusted by 1+ million students worldwide
DIGITAL ANALYTICS REPORT 7
Figure 3: pride t-shirt search results
This is a clear indication that there is no paid search nor effective SEO that could generate traffic
for that particular product. If the SEO were used, a link that would lead to the product would at
least appear in the first page but it did not. Additionally, if there were paid ads for the product, it
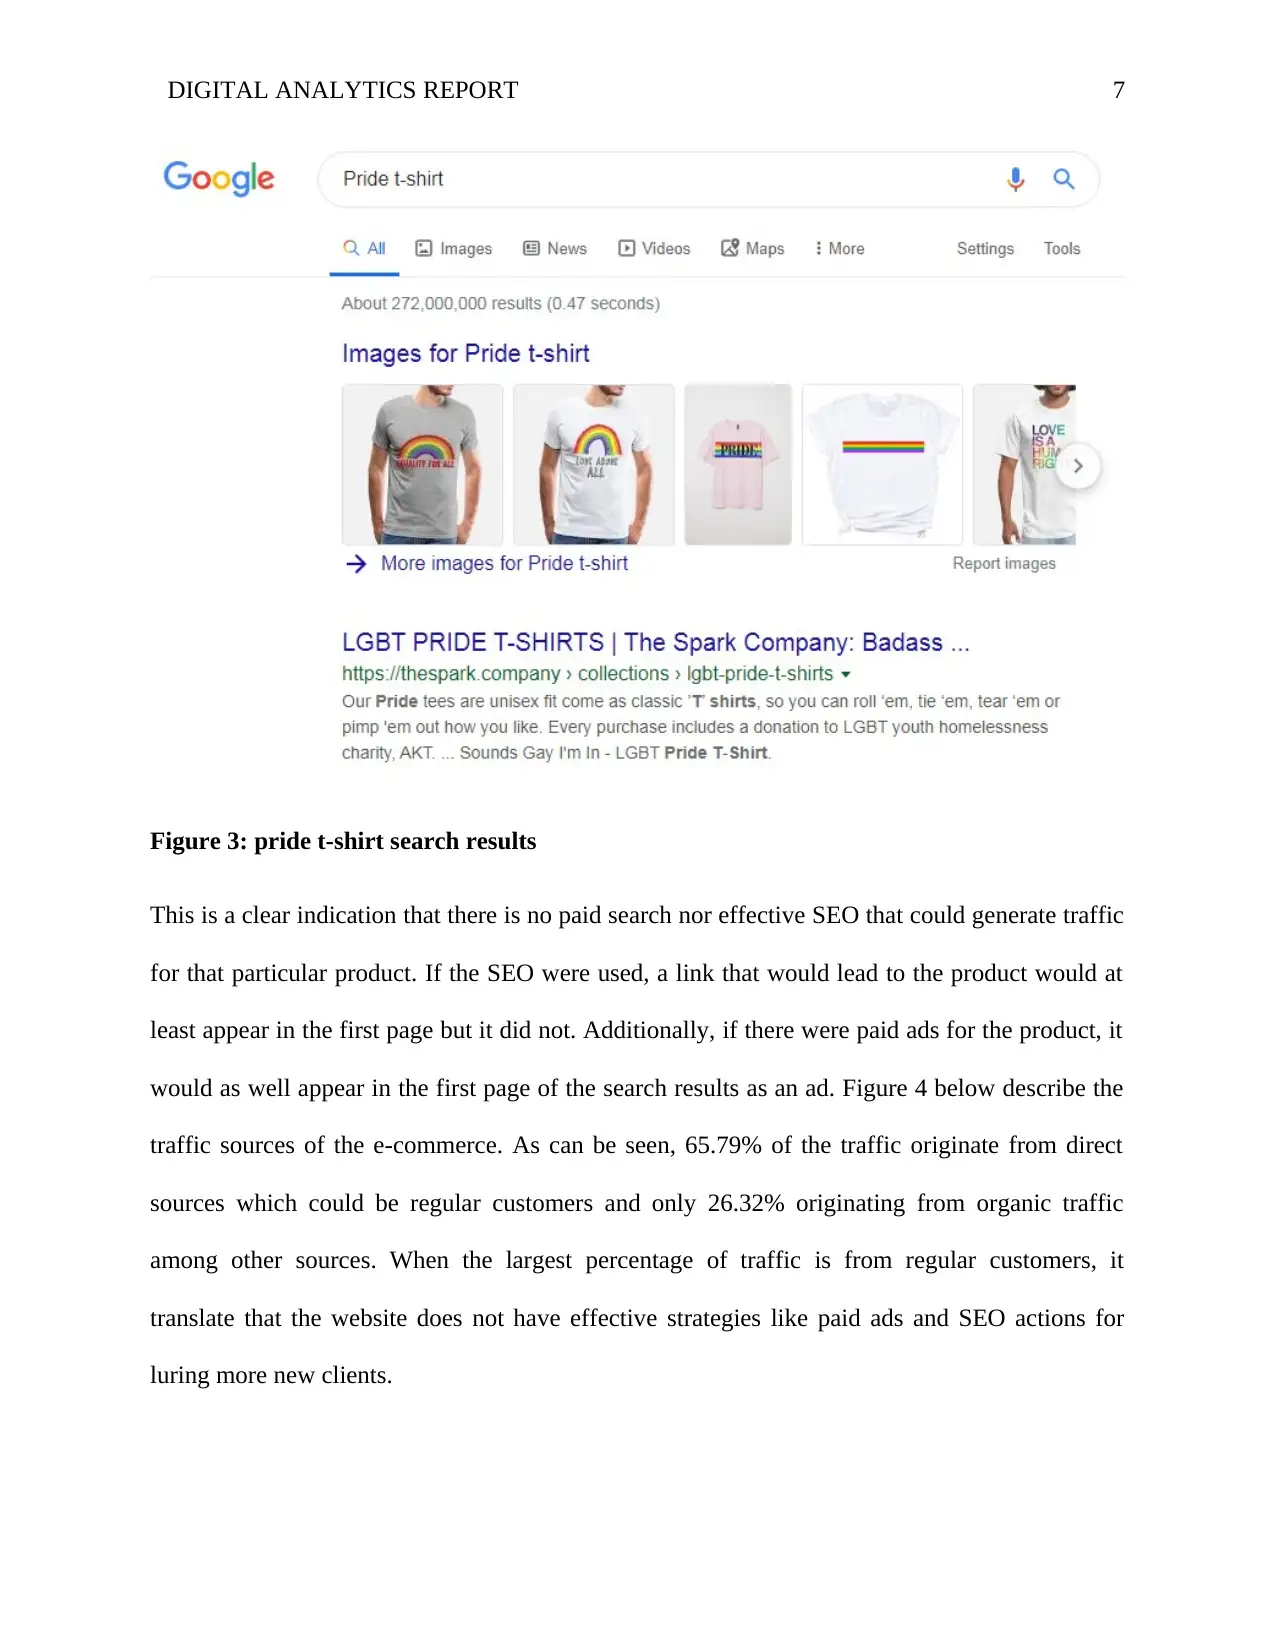
would as well appear in the first page of the search results as an ad. Figure 4 below describe the
traffic sources of the e-commerce. As can be seen, 65.79% of the traffic originate from direct
sources which could be regular customers and only 26.32% originating from organic traffic
among other sources. When the largest percentage of traffic is from regular customers, it
translate that the website does not have effective strategies like paid ads and SEO actions for
luring more new clients.
Figure 3: pride t-shirt search results
This is a clear indication that there is no paid search nor effective SEO that could generate traffic
for that particular product. If the SEO were used, a link that would lead to the product would at
least appear in the first page but it did not. Additionally, if there were paid ads for the product, it
would as well appear in the first page of the search results as an ad. Figure 4 below describe the
traffic sources of the e-commerce. As can be seen, 65.79% of the traffic originate from direct
sources which could be regular customers and only 26.32% originating from organic traffic
among other sources. When the largest percentage of traffic is from regular customers, it
translate that the website does not have effective strategies like paid ads and SEO actions for
luring more new clients.
Paraphrase This Document
Need a fresh take? Get an instant paraphrase of this document with our AI Paraphraser
DIGITAL ANALYTICS REPORT 8
Figure 4: google merchandise organic sources
Thus suggesting that in order for the google merchandise store to increase their traffic as
required, the organization has to consider both paid as well as organic searches. It is therefore
important to note that google merchandise should focus on paid traffic and SEO to boost their
traffic.
2. Objective 2: Increase sales
a. Analysis of sales funnel
In order for the organization to increase the number of sales by 30% in six months, the business
must consider increasing the purchases completed. It is for this reason that the funnel
visualization is of great importance in finding out the stages associated with issues associated
with those involving customers dropping out before making purchases. Additionally, majority of
users with dissatisfactory experience with a website are less likely to complete purchases from
the website. In this rationale, analyzing the sales funnel is important for the business in pointing
DIGITAL ANALYTICS REPORT 9
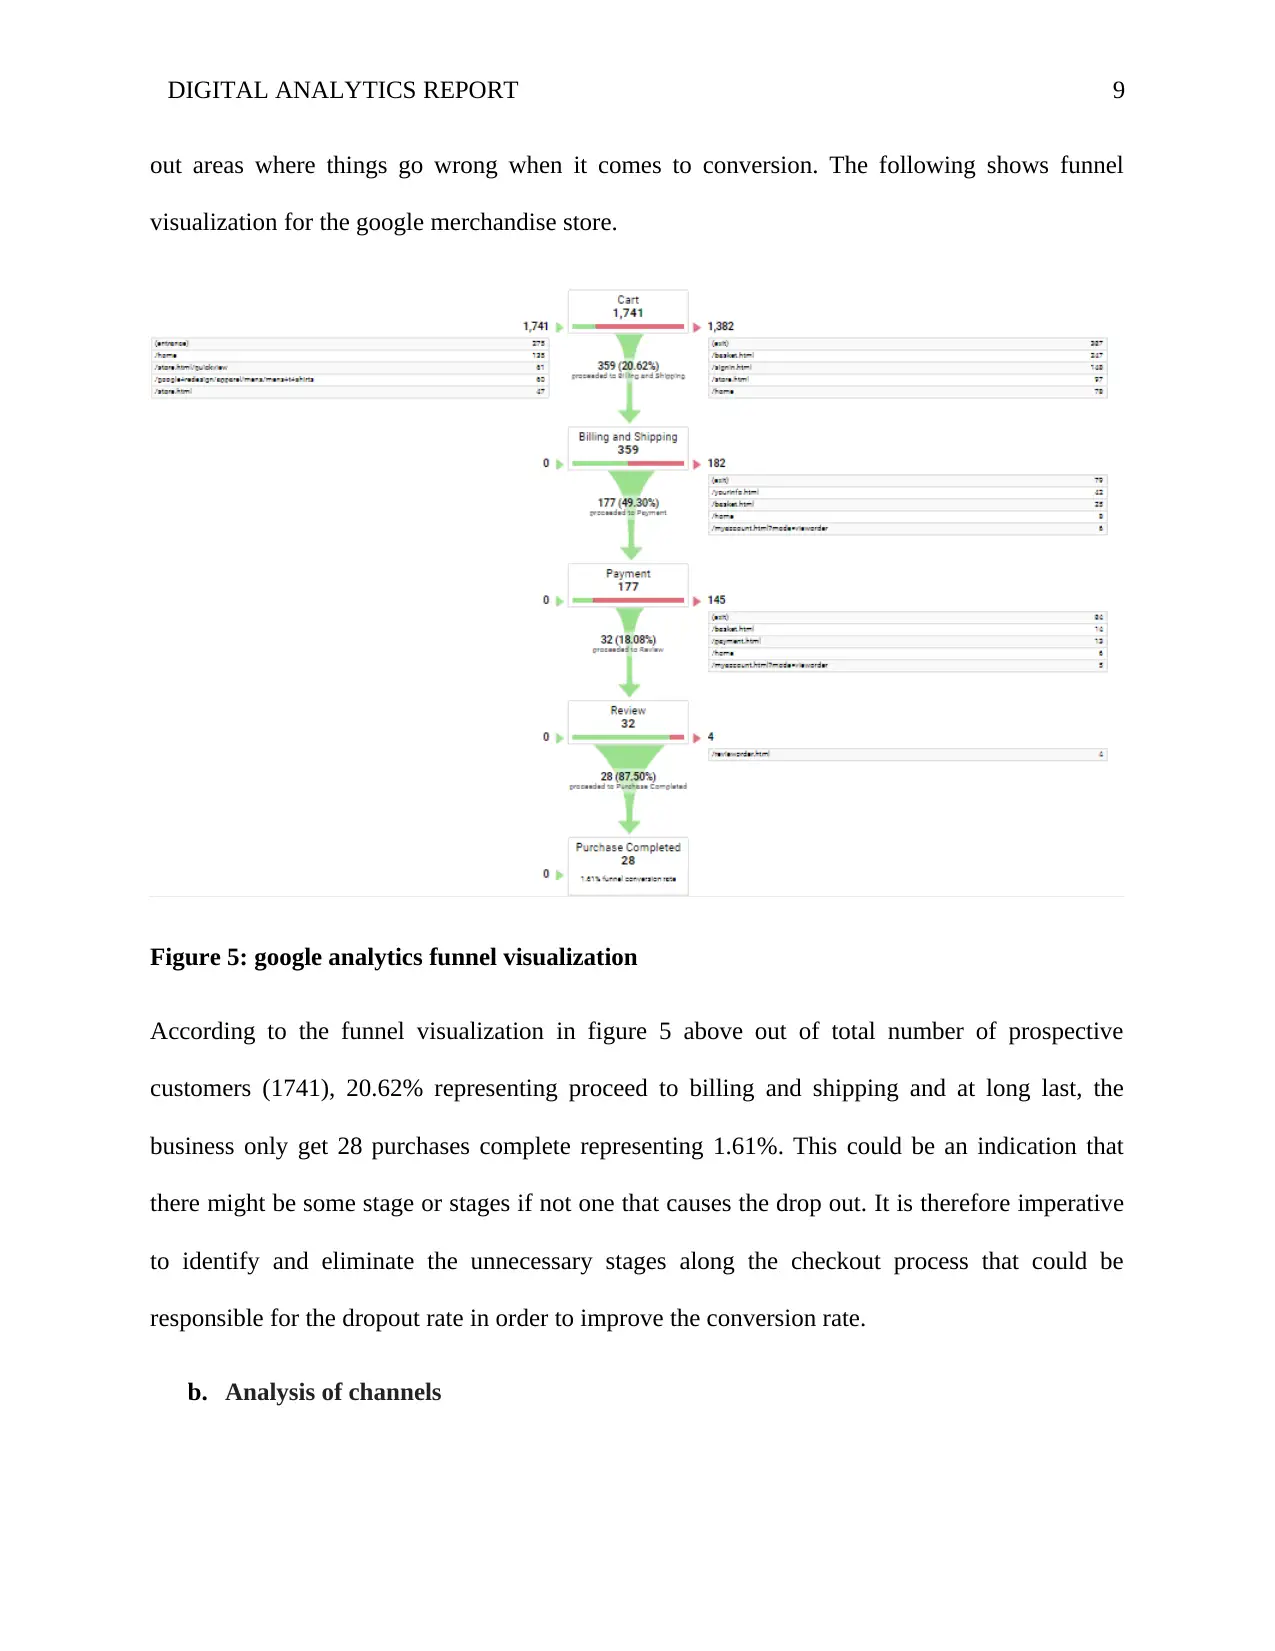
out areas where things go wrong when it comes to conversion. The following shows funnel
visualization for the google merchandise store.
Figure 5: google analytics funnel visualization
According to the funnel visualization in figure 5 above out of total number of prospective
customers (1741), 20.62% representing proceed to billing and shipping and at long last, the
business only get 28 purchases complete representing 1.61%. This could be an indication that
there might be some stage or stages if not one that causes the drop out. It is therefore imperative
to identify and eliminate the unnecessary stages along the checkout process that could be
responsible for the dropout rate in order to improve the conversion rate.
b. Analysis of channels
⊘ This is a preview!⊘
Do you want full access?
Subscribe today to unlock all pages.
Trusted by 1+ million students worldwide
DIGITAL ANALYTICS REPORT 10
It is essential for the google merchandise store to have an understanding of how exactly their
customers access their online store in digital marketing in order to find ways to improve in sales.
This approach is more relevant especially when doing an analysis from channel reports in the
google analytics. This way, the business will be cognizant of the efficiencies as far as the amount
and quality of traffic are concerned in a bid to work towards increasing sales as required within
six months.
As such, knowing which channels performs best when it comes to the number of completed sales
can help the organization to concentrate on the right marketing strategies that would
consequently generate more traffic and improve the percentage of sales made by the business.
This also translate that the google merchandise store will most likely gain more sales and hit the
target of increasing sales by 15% within six months. The following shows a channel report
under acquisition funnel of the google merchandise store.
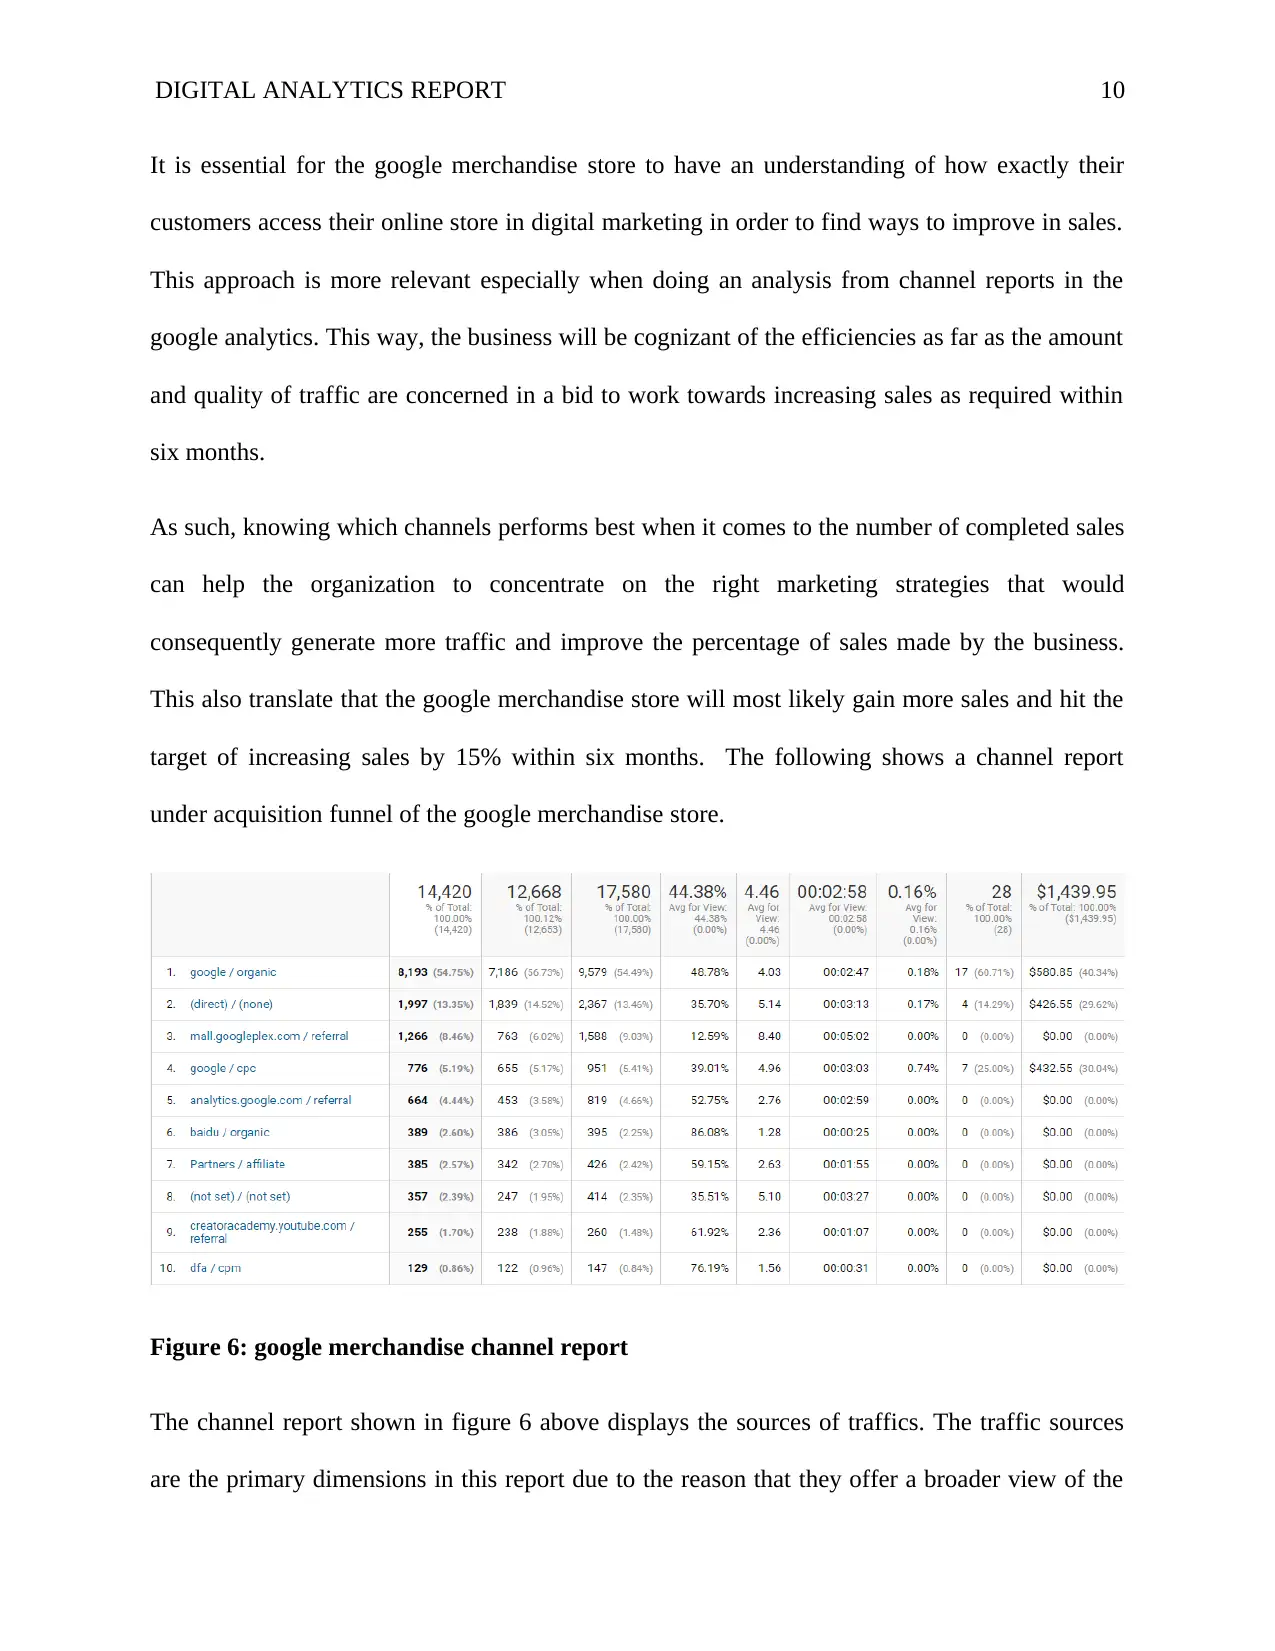
Figure 6: google merchandise channel report
The channel report shown in figure 6 above displays the sources of traffics. The traffic sources
are the primary dimensions in this report due to the reason that they offer a broader view of the
It is essential for the google merchandise store to have an understanding of how exactly their
customers access their online store in digital marketing in order to find ways to improve in sales.
This approach is more relevant especially when doing an analysis from channel reports in the
google analytics. This way, the business will be cognizant of the efficiencies as far as the amount
and quality of traffic are concerned in a bid to work towards increasing sales as required within
six months.
As such, knowing which channels performs best when it comes to the number of completed sales
can help the organization to concentrate on the right marketing strategies that would
consequently generate more traffic and improve the percentage of sales made by the business.
This also translate that the google merchandise store will most likely gain more sales and hit the
target of increasing sales by 15% within six months. The following shows a channel report
under acquisition funnel of the google merchandise store.
Figure 6: google merchandise channel report
The channel report shown in figure 6 above displays the sources of traffics. The traffic sources
are the primary dimensions in this report due to the reason that they offer a broader view of the
Paraphrase This Document
Need a fresh take? Get an instant paraphrase of this document with our AI Paraphraser
DIGITAL ANALYTICS REPORT 11
channels of the google merchandise store. As shown by the report, google organic search holds
the largest percentage (40.34%) of the total revenue made by the google merchandise followed
by direct google cpc (30.04%) then direct sources (29.62%) among others. This could translate
that google merchandise find more traffic from organic, direct and google cpc. Most importantly,
it could be noted that the traffic from the google cpc is mainly referral meaning that users get
referred to the merchandise online store upon clicking an ad.
3. Objective 3: increase sales of the ‘men’s t-shirts’ product line
a. Analysis of site search
In this analysis, we examine site search in order to analyze the data collected from the report on
men’s ware. The data from the report is essential for the google merchandise store to better their
content in relation to men’s ware according to the data from users as well as their behavior in the
site. Hubspot statistics suggest that more than 70% of consumers get frustrated due to poor
quality site content. A poor quality content means the content that does not offer pertinent data
for the customer. This may not only affect the search ranking of the business but also frustrates
its customers which may consequently compromise sales. Contents are not ranked on search
engines depending on the amount of the content but rather the quality of the content. In this
sense, if search engine detect that users are having difficulty in using a site, this may work
against the business. It is for this reason that this report will be of great importance for the
business.
Most importantly, the quality of the contact enable business to connect well with its clients. It is
through this that the google merchandise store finds insights regarding the best content that
would work towards increasing the sales of men’s ware and improve on them as well as their
web design.
DIGITAL ANALYTICS REPORT 12
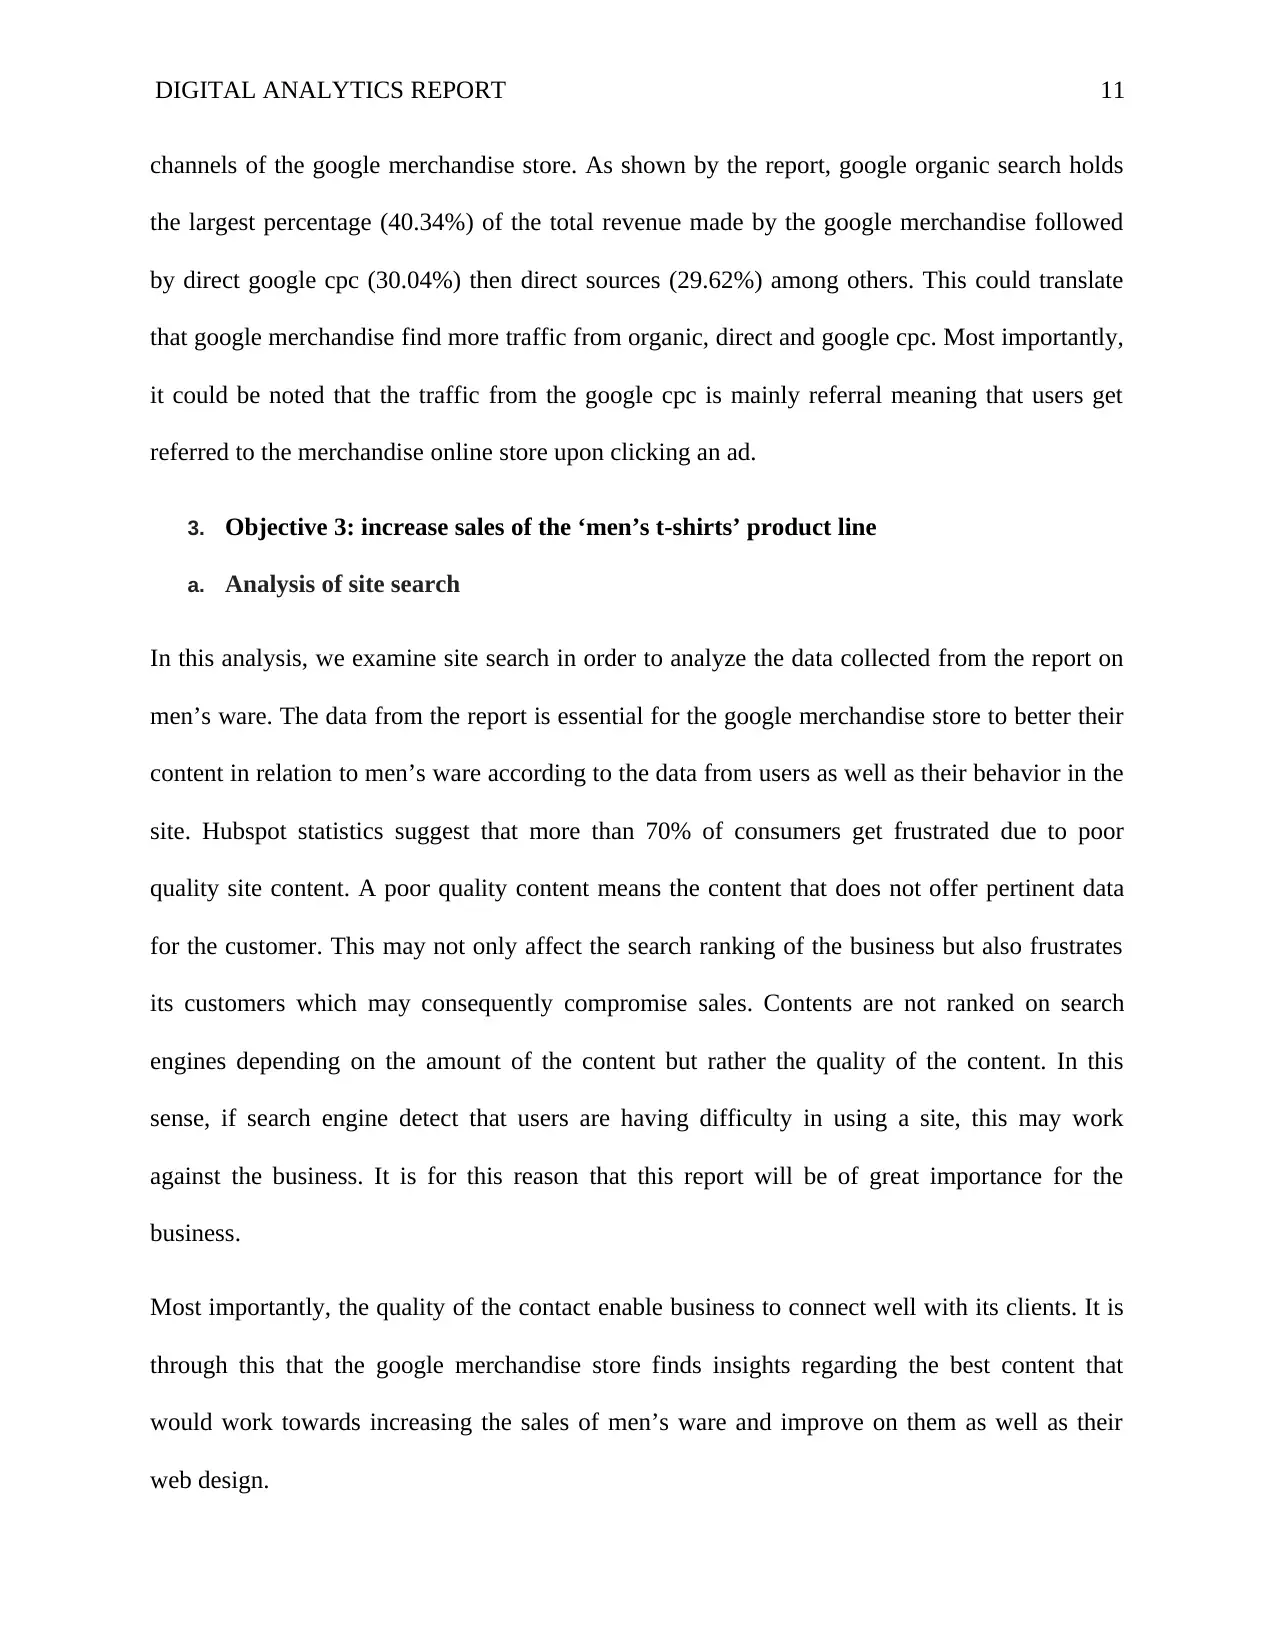
Figure 7: google merchandise store search status
It is revealed from the search status above that people spend an average of 00:2:58 hours in
finding the items they want. Also, a considerable number drops out when they find what they
never expect. The figure also depict a bounce rate of 44.38%. Thus suggesting that the quality of
the site content is a determinant when it comes to site search.
b. Analysis site speed
The speed of a page is a factor of fundamental relevance. It is essential in contributing towards
the customer experience in an e-commerce website. Ensuring a positive customer experience can
promise a considerable ramification for a business in terms of a competitive advantage for the
organization.
Moreover, research show that a page abandonment is more likely to occur if there is difficulty in
page loading and just a delay by a second or two seconds leads to customer dissatisfaction.
⊘ This is a preview!⊘
Do you want full access?
Subscribe today to unlock all pages.
Trusted by 1+ million students worldwide
1 out of 18
Related Documents


Your All-in-One AI-Powered Toolkit for Academic Success.
+13062052269
info@desklib.com
Available 24*7 on WhatsApp / Email
![[object Object]](/_next/static/media/star-bottom.7253800d.svg)
Unlock your academic potential
Copyright © 2020–2026 A2Z Services. All Rights Reserved. Developed and managed by ZUCOL.