Digital Analytics in Modern Digital Marketing: A Comprehensive Study
VerifiedAdded on 2021/01/28
|14
|3334
|26
Report
AI Summary
This report provides a comprehensive overview of digital analytics within the realm of digital marketing. It begins by highlighting the significance of digital analytics in today's internet-driven world, emphasizing its role in understanding customer behavior and customizing experiences. The report delves into the importance of digital analytics, including understanding target audiences through data, making predictions, and optimizing marketing results. It explains the practical application of Google Analytics, including setting up the tool, focusing on target goals, analyzing bounce rates, and performing user flow analysis. The report also outlines the importance of annual content audits and provides five key performance indicators (KPIs) essential for business success, such as revenue growth, income sources, revenue concentration, profitability, and effective working capital management. The study underscores the value of data-driven decision-making for business growth and sustained success.

Digital Analytics
Date:
Institute:
Course:
Lecturer/Supervisor:
1 | P a g e
Date:
Institute:
Course:
Lecturer/Supervisor:
1 | P a g e
Paraphrase This Document
Need a fresh take? Get an instant paraphrase of this document with our AI Paraphraser

Abstract
This study aims to discuss the role and responsibilities of digital analytics in the field of Digital
Marketing. This study will provide you in-depth analysis of the digital business, so how could
you grow your business with digital analytics. There are various factors of the digital analytics
discussed in this study to get the right understanding of the analytics. Besides this, the
importance of digital analytics uses of digital analytics, key performance indicators of a business,
and the customer's ABC report's critical pattern is also explained in the study. Digital analytics is
used for the improvement of digital business. Without it, you can't grow your business.
2 | P a g e
Introduction:
Today nearly 4,000 billion people use the Internet, which accounts for about 55% of the world's
population. It is essential to have an excellent online presence to reach your target audience.
Brands can't ignore the importance of digital marketing. It would help if you recognized the
importance of analytics in digital marketing to achieve this presence. While the number of
internets and social media users is growing, digital marketing data is also increasing. Social
media platforms and digital marketing tools help you make sense of these results. This data is
essential because it will allow you to understand all your customer's needs. The modern
consumer needs to have a customized experience, and without knowing it, you cannot offer it.
That is why it is incredibly essential for you to have access to your public data. Let's try to
understand the value of analytics in digital marketing and how you can use it to create a
customer experience.
Importance of Digital Analytics
Here are some most important factors of digital analytics.
Understanding
Data is vital for your target audience to understand. Data from their conduct and demographics
will help you know what your consumers are doing and how they are ultimately converted.
Demographic details will provide you with a clear image of the person you want to purchase,
including their ages, locations and interests. These data are incredibly useful for your business
because they will help you determine what steps you have to take to customize your goods.
Make Predictions
You can see patterns and do a predictive analysis while evaluating your data, allowing you to
make more complex data-driven decisions. You would be well prepared to find out what you
need to sell and when. Such analytics will help you to decide whether your product is most
demanded. Data will also allow you to forecast future developments in your industry. You can
use these data to quickly adapt your approach to trends and take advantage of your digital
marketing campaigns.
Optimize Results
If you can better understand your clients, you can improve your marketing methods for them.
You should examine the data behind all of your promotions and determine the connection
3 | P a g e
⊘ This is a preview!⊘
Do you want full access?
Subscribe today to unlock all pages.
Trusted by 1+ million students worldwide
between your audience and your content. This research will help enhance campaigns by altering
texts, platforms, frequencies, etc. For example, the data will show you if your marketing
strategies worked better in social media or emails. Based on this detail, you can decide where to
spend more to make higher returns. Let us now look at the underlying concepts of digital
marketing research as you understand the value of digital marketing analytics.
Use of Google Analytics:
Google Analytics is the market's most robust tracking tool. It gives you specific details about
visitors to your website and their actions. After clicking an email, you send them, and beyond,
you will see what people are doing on your website. Using Google Analytics effectively, you
will avoid making blind guesses and begin to make marketing decisions based on data to
improve your profitability. If you want to get a start this year on developing your website, we'll
help you determine how to use Google Analytics to make data-driven decisions.
Add Google Analytics to your site:
You must ensure that Google Analytics is correctly set up on your website before jumping in to
access the data. False tracking can distort the tracking data and lead to wrong decisions. You
need to build an account for Google Analytics, link your website to Analytics and add a snippet
of tracking code to your site (head). If you are on WordPress, you can use this quick guide for
setting up Google Analytics. It can take several hours before you start collecting your website
data. Let's look at some ways of using Google Analytics to enhance the website.
• Focus on Your Target
To make informed decisions, you need to concentrate explicitly on your goals and determine
how to reach them by developing plans. For example, if you want to carry out more blog
conversions, it is crucial to know the type of content that best resonates with your public. One
way to check your content is via your Google Analytics pages study. You can classify the blog
posts and pages that most conversions push. Your time might not be worth focusing on content
that drives loads of traffic without modification. Now that doesn't mean that every blog post has
conversions to drive. Any piece of content you create should instead achieve your goals. For
example, if you use AdSense to monetize your blog, you may want to follow AdSense's clicks on
your blog post to find the type of content that produces the most Revenue. This will helps you to
create more related content on your blog that will make more profits. Once the content form,
which produces positive results, has been found, come up with more content ideas for your blog
and add them to your publishing calendar.
• Bounce Rate Analysis
One of the most critical metrics for tracking is the rate of bounce. The bounce rate is essentially
the percentage of visits to your site on a single page. It tells you whether your guests stick or
4 | P a g e
Paraphrase This Document
Need a fresh take? Get an instant paraphrase of this document with our AI Paraphraser
leave after their first visit to your website. In general, the lower bounce rate will make your site
more attractive, and it's incredibly beneficial for your business. If a large number of visitors
navigate your site after just visiting a single page, you need to refine your content or make better
calls for action that intrigue visitors into your bid.
Here are some methods to improve your bounce rate:
1. Encourage and consume the content in a short period.
2. Reduce the loading time of your website and visually attract your landing pages.
3. Build a pop-up to show visitors another valuable resource on your web. With OptinMonster,
you can view targeted pop-up campaigns on your website when your visitors are about to leave.
• Analysis of Study Behavior
In addition to showing you useful stats, Google Analytics helps you perform user flow analysis
to understand how your customers explore your web and take steps you see as worthwhile. You
can see leaky spots in your sales funnel by analyzing your users' actions flow. Once these areas
are established, you can reduce the decrease and increase Revenue and sales. For conversions to
track, make sure that you first set Google Analytics goals. And to track sales and revenues, you
must allow Google Analytics to track e-commerce.
• Annual Audit of Content
If you invest in content marketing, you'll need to concentrate on a couple of different metrics to
assess your ROI. Calculation of your ROI content marketing helps you to evaluate if your
investment in content marketing pays off. The primary aim of content marketing for most
websites is to attract and transform quality goods into customers. However, you cannot expect
every visitor to your website to be converted into customers. Other main metrics, including lead
quality, traffic and on-site interaction, are also needed in addition to conversions. When you
perform an annual content audit on your site, you need to remember a few points below.
1. Find the most traffic-finding keywords on your website. Understand your organic
visitors' purpose and see if your articles offer what your visitors want.
2. Recognize your past content marketing pieces with the best traffic and interaction results.
Make sure you apply similar ideas to your publishing schedule.
3. Delete material that doesn't represent your organization anymore.
Five Key Performance Indicators (KPI) of a Business:
5 | P a g e
Financial KPIs vary from one company to another, depending on the objectives. But we've listed
five of the most significant and popular ones to track to ensure your organization is on the right
path.
1. Growth of Revenue:
Sales growth is one of the most critical barometers for any business' success. You can estimate
the revenue growth in three simple steps: track your revenues (and compile your chosen
accounting software income reports) from one time to another.
Subtract income from the present period for the previous period.
Divide this amount by the overall sales of the last Revenue. You're going to get sales growth as a
percentage. The goal is to achieve positive change. Negative growth signals you that something
is wrong and that corrective action is required. For example, it can happen that customers don't
want to purchase your product or need to adjust the way you get customers.
2. Sources of Income:
You can also evaluate the income streams: consumer income and operation. This review helps
you:
• Determine profitable markets and clients. Think you are a copywriter, for instance,
and would find that the bulk of your income is from writing ebooks.
• Make informed choices to help you develop your company. If you know that ebook
writing is lucrative, you can look more actively at selling it if you are not).
3. The concentration of Revenue:
Revenue concentration is closely related to revenue sources. The aim is to ensure that much of
your sales do not come from one or two customers. If so, you can immediately take steps to
diversify your consumer portfolio to protect yourself. Why? If you lose this customer, your
monthly Revenue will be huge, and you will have additional customers. For example, I examined
my own company and found that over 80% of my income is from one customer. I began to
market myself even more to see more buyers to cope with this situation. With a few necessary
calculations, you can easily do this research yourself. Divide the profits per customer by the
overall income and by 100 times. Think, for example, of a gross income of $32,400 and
distributed through five customers:
Customer 1: $3,400.
Customer 2: $2,300.
6 | P a g e
⊘ This is a preview!⊘
Do you want full access?
Subscribe today to unlock all pages.
Trusted by 1+ million students worldwide
Customer 3: $19,500.
Customer 4: $3,0000
Customer 5: $4,200
The concentration of your sales will be (rounded to the second decimal):
Customer 1: ($3,400/$32,400)*100 = 10,49%;
Customer 2: ($2,300/$ 32,400)*100 = 7.01%)
Customer 3: ($19,500/$32,400)*100=60.19%
Customer 4: ($3,0000/$32,400) *100 = 9.26%;
Customer 5: ($4,200/$32,400)*100 = 12.96%
4. Profitability with Period:
You will need to review your expenses to see if your financial resources are draining. You can
then generate profit and loss reports (by deducting income expenses) to measure your company's
success over a period by monitoring your costs and sales. You can then make crucial decisions
like:
• Do you have to reduce the costs? Check the prices and see where your money goes.
• How much do you cut? You probably have some overpayment expenditures. You can
cut these costs and reduce them in a few easy ways to save money for your small
business instantly.
• Should you raise your net profit margin by raising your prices? The net profit margin
is the profit that you can reinvest in your business.
• Do you want more customers? You will not be paying what you value with current
customers. Therefore, find better people who are prepared to pay you well.
5. Working Wisely:
Part of thinking like a CEO means looking ahead, so you can use significant opportunities when
the time comes. If you had a dream customer ever knocked on but couldn't benefit from the
opportunity because you don't have enough cash to invest in the project, then it's time to tabs on
your working capital. Working capital is the money you earn from a bank loan or family and
friends to help support your daily life. You can also use it as a hedge when consumers are
7 | P a g e
Paraphrase This Document
Need a fresh take? Get an instant paraphrase of this document with our AI Paraphraser
eternally going to pay you and capitalize on the significant ventures that drive your company
around the board.
Key Patterns of Customer's ABC:
As the business evolves, everything cannot be held under control. You can't control it all
yourself. Of course, it is a responsibility of a sales representative to keep an eye on their
customers. But do they have the time to do that? And are they operating as thoroughly as you
were? One day you could wake up and notice that one of your main customers is buying less
than he used to buy. Your rival gave him a commodity at a lower price, and finally, they
overtook him. It was a long process, and you even didn't know it. Or you underestimated the
potential of a customer and did not care the way he deserved. Your business doesn't expand the
way you expected because of this. And here, the analyses of ABC will help!
• ABC Analysis
ABC research divides consumers into three groups: A-B-C. Each customer receives a letter
according to how important it is to you.
8 | P a g e
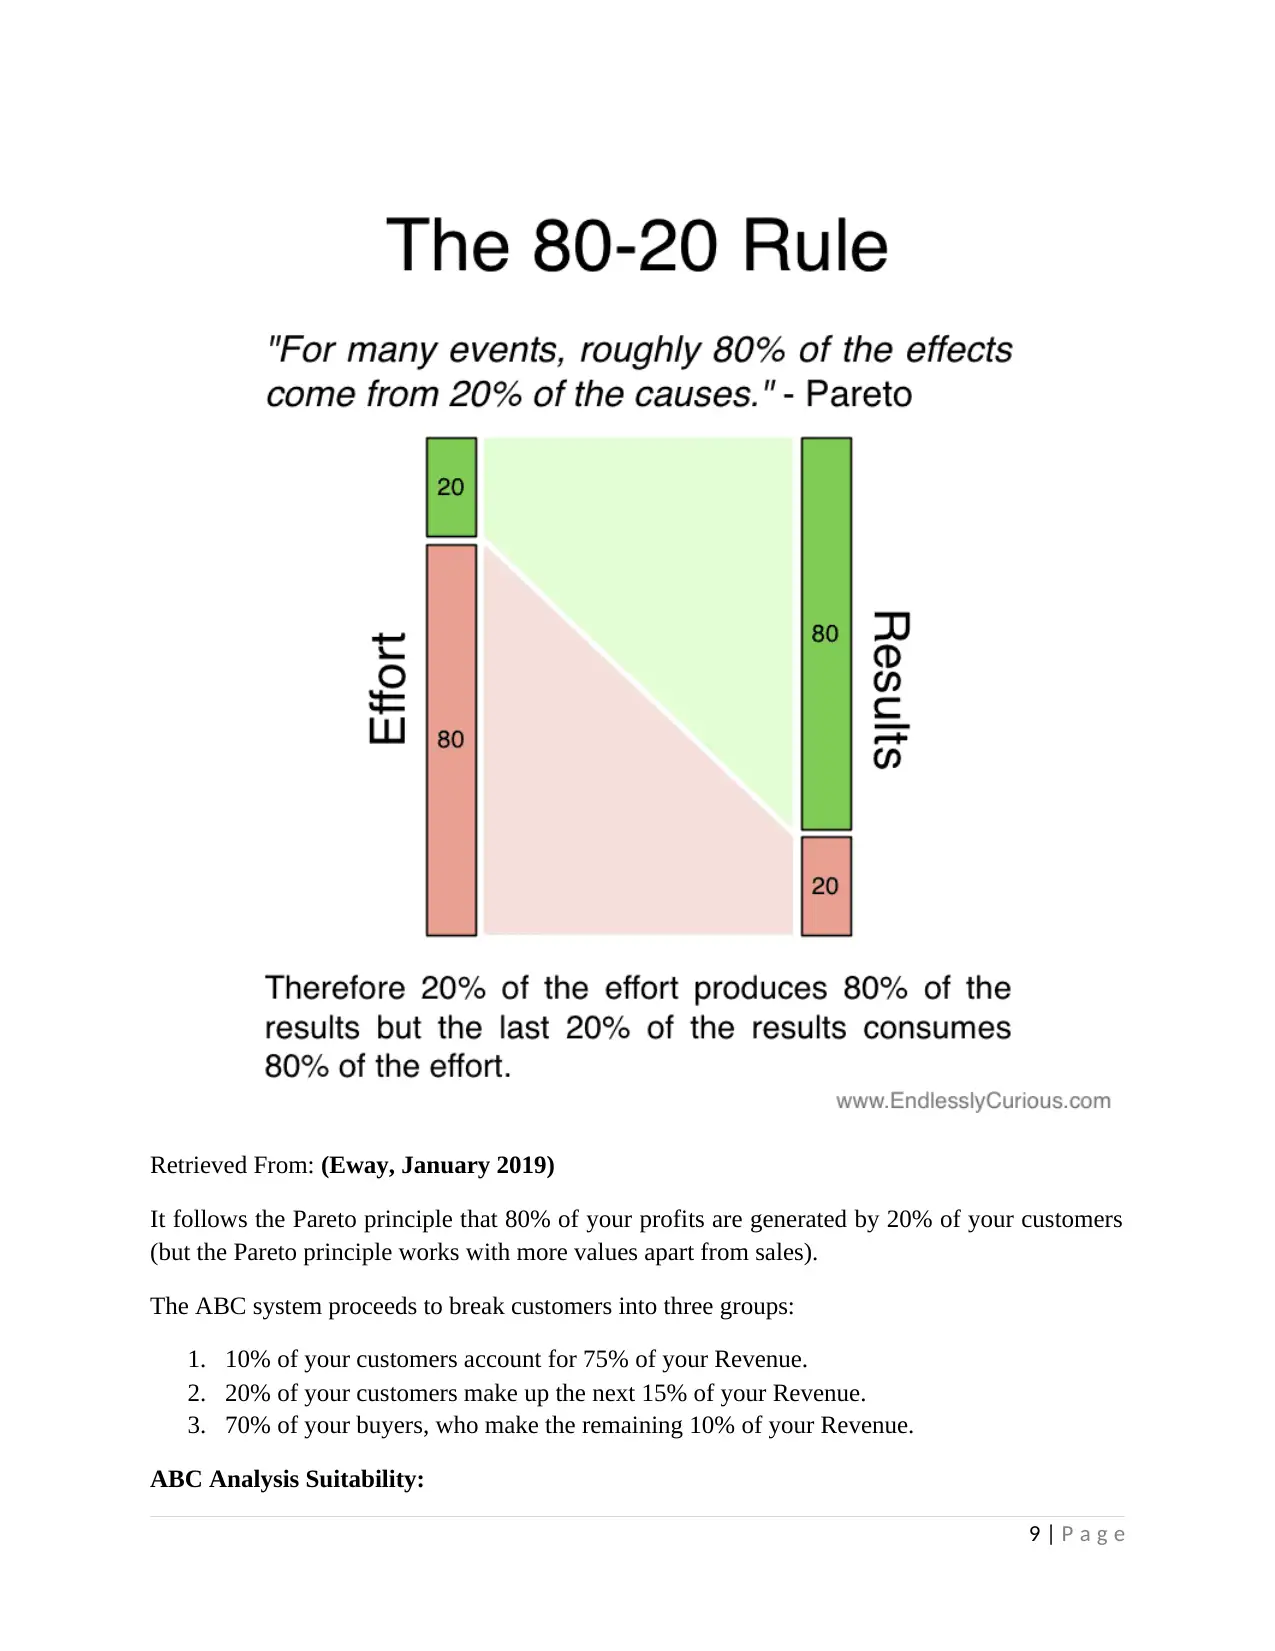
Retrieved From: (Eway, January 2019)
It follows the Pareto principle that 80% of your profits are generated by 20% of your customers
(but the Pareto principle works with more values apart from sales).
The ABC system proceeds to break customers into three groups:
1. 10% of your customers account for 75% of your Revenue.
2. 20% of your customers make up the next 15% of your Revenue.
3. 70% of your buyers, who make the remaining 10% of your Revenue.
ABC Analysis Suitability:
9 | P a g e
⊘ This is a preview!⊘
Do you want full access?
Subscribe today to unlock all pages.
Trusted by 1+ million students worldwide
ABC research can be extended to all businesses whose consumers frequently shop. It is hard to
use for consumers who invest a great deal of money, but only once. You get better results with a
greater frequency of purchase.
How does it work?
The steps are quick. Come and try it with your customers and their turnover last year.
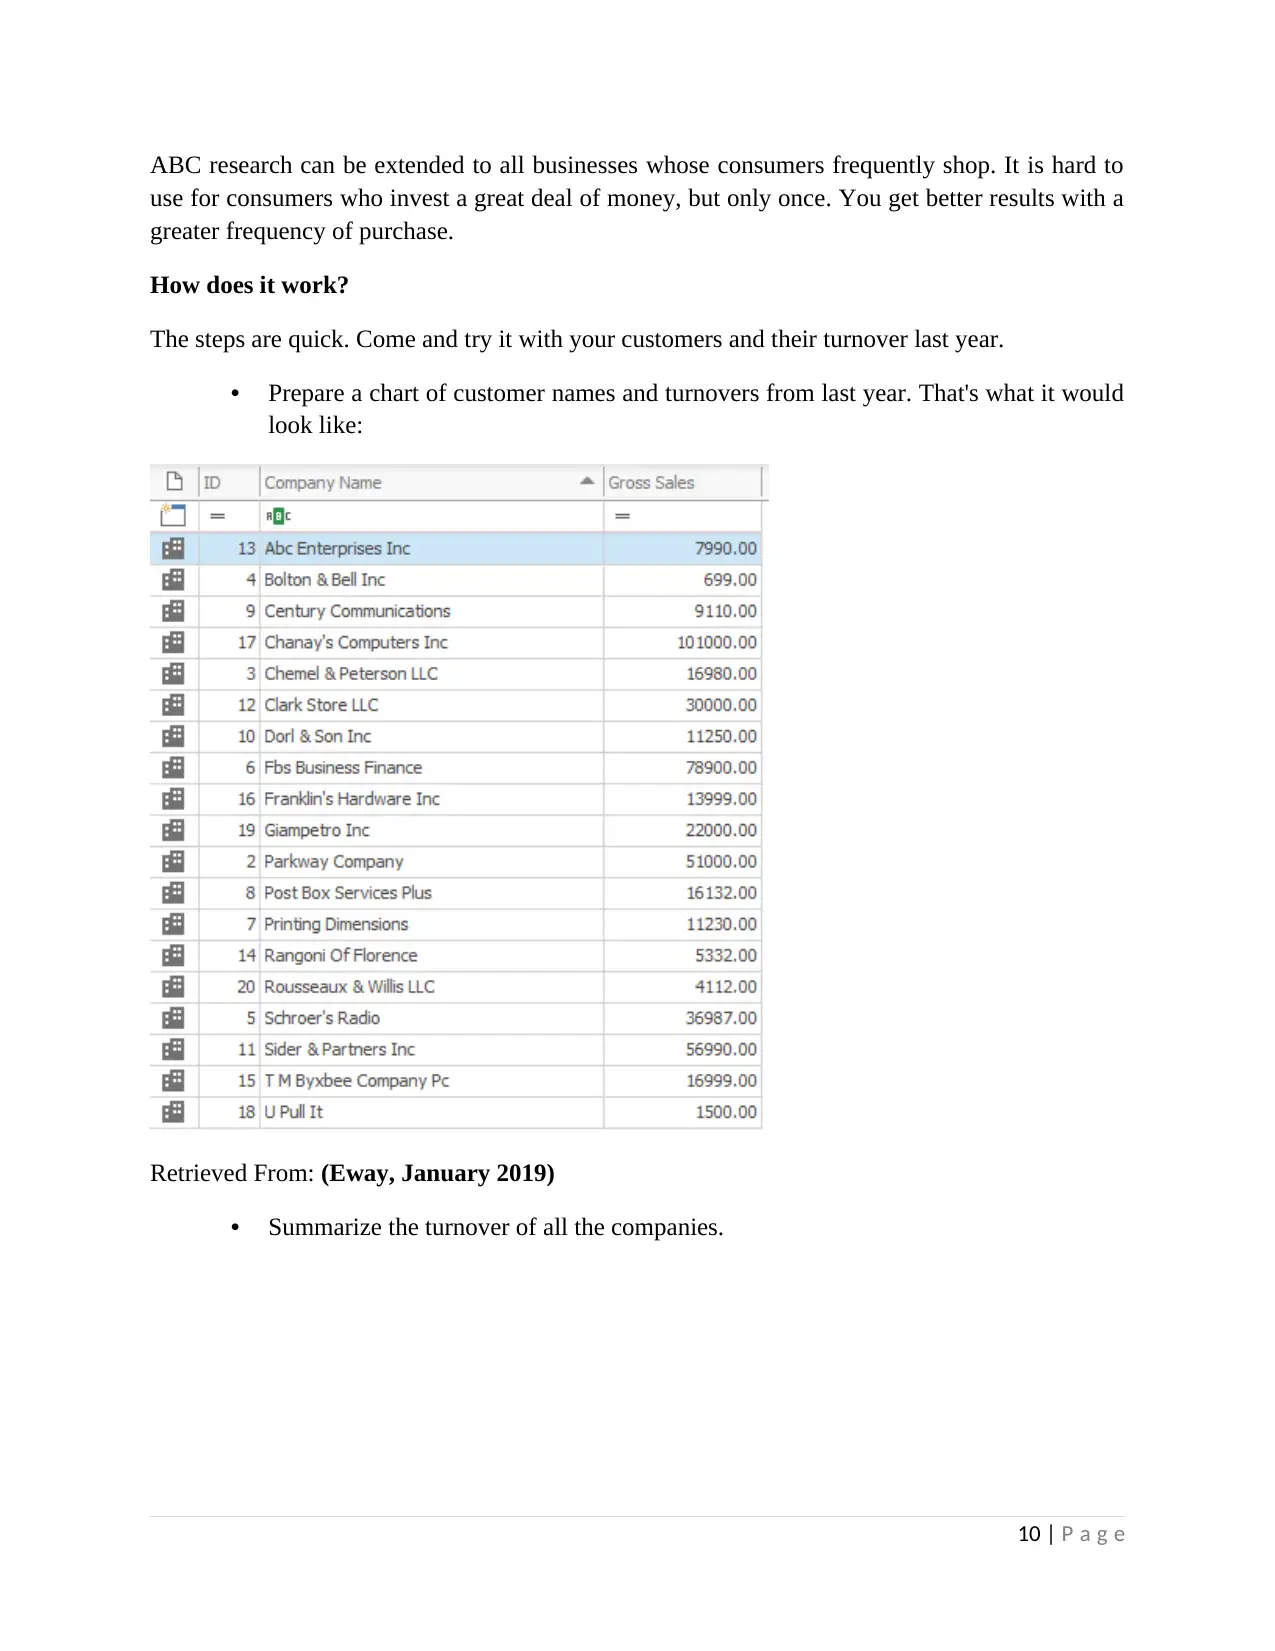
• Prepare a chart of customer names and turnovers from last year. That's what it would
look like:
Retrieved From: (Eway, January 2019)
• Summarize the turnover of all the companies.
10 | P a g e
use for consumers who invest a great deal of money, but only once. You get better results with a
greater frequency of purchase.
How does it work?
The steps are quick. Come and try it with your customers and their turnover last year.
• Prepare a chart of customer names and turnovers from last year. That's what it would
look like:
Retrieved From: (Eway, January 2019)
• Summarize the turnover of all the companies.
10 | P a g e
Paraphrase This Document
Need a fresh take? Get an instant paraphrase of this document with our AI Paraphraser
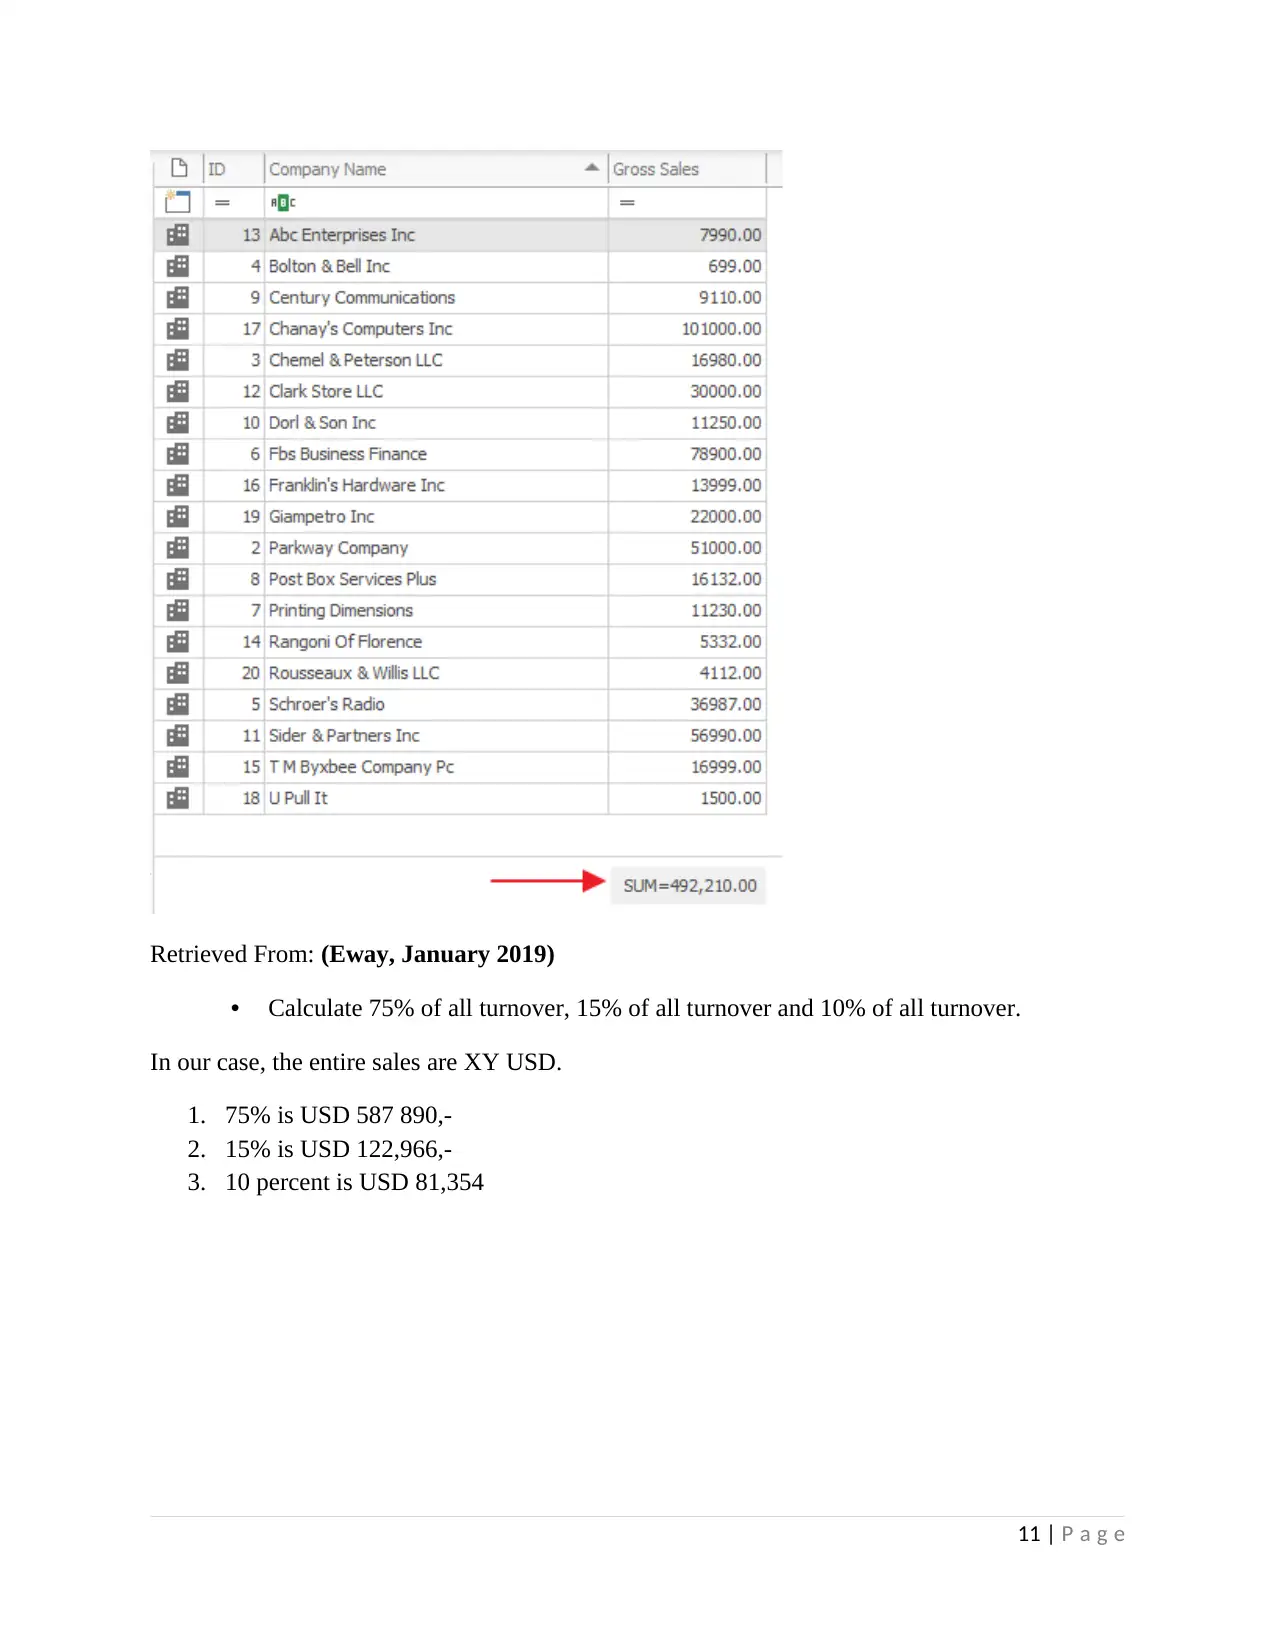
Retrieved From: (Eway, January 2019)
• Calculate 75% of all turnover, 15% of all turnover and 10% of all turnover.
In our case, the entire sales are XY USD.
1. 75% is USD 587 890,-
2. 15% is USD 122,966,-
3. 10 percent is USD 81,354
11 | P a g e
• Calculate 75% of all turnover, 15% of all turnover and 10% of all turnover.
In our case, the entire sales are XY USD.
1. 75% is USD 587 890,-
2. 15% is USD 122,966,-
3. 10 percent is USD 81,354
11 | P a g e
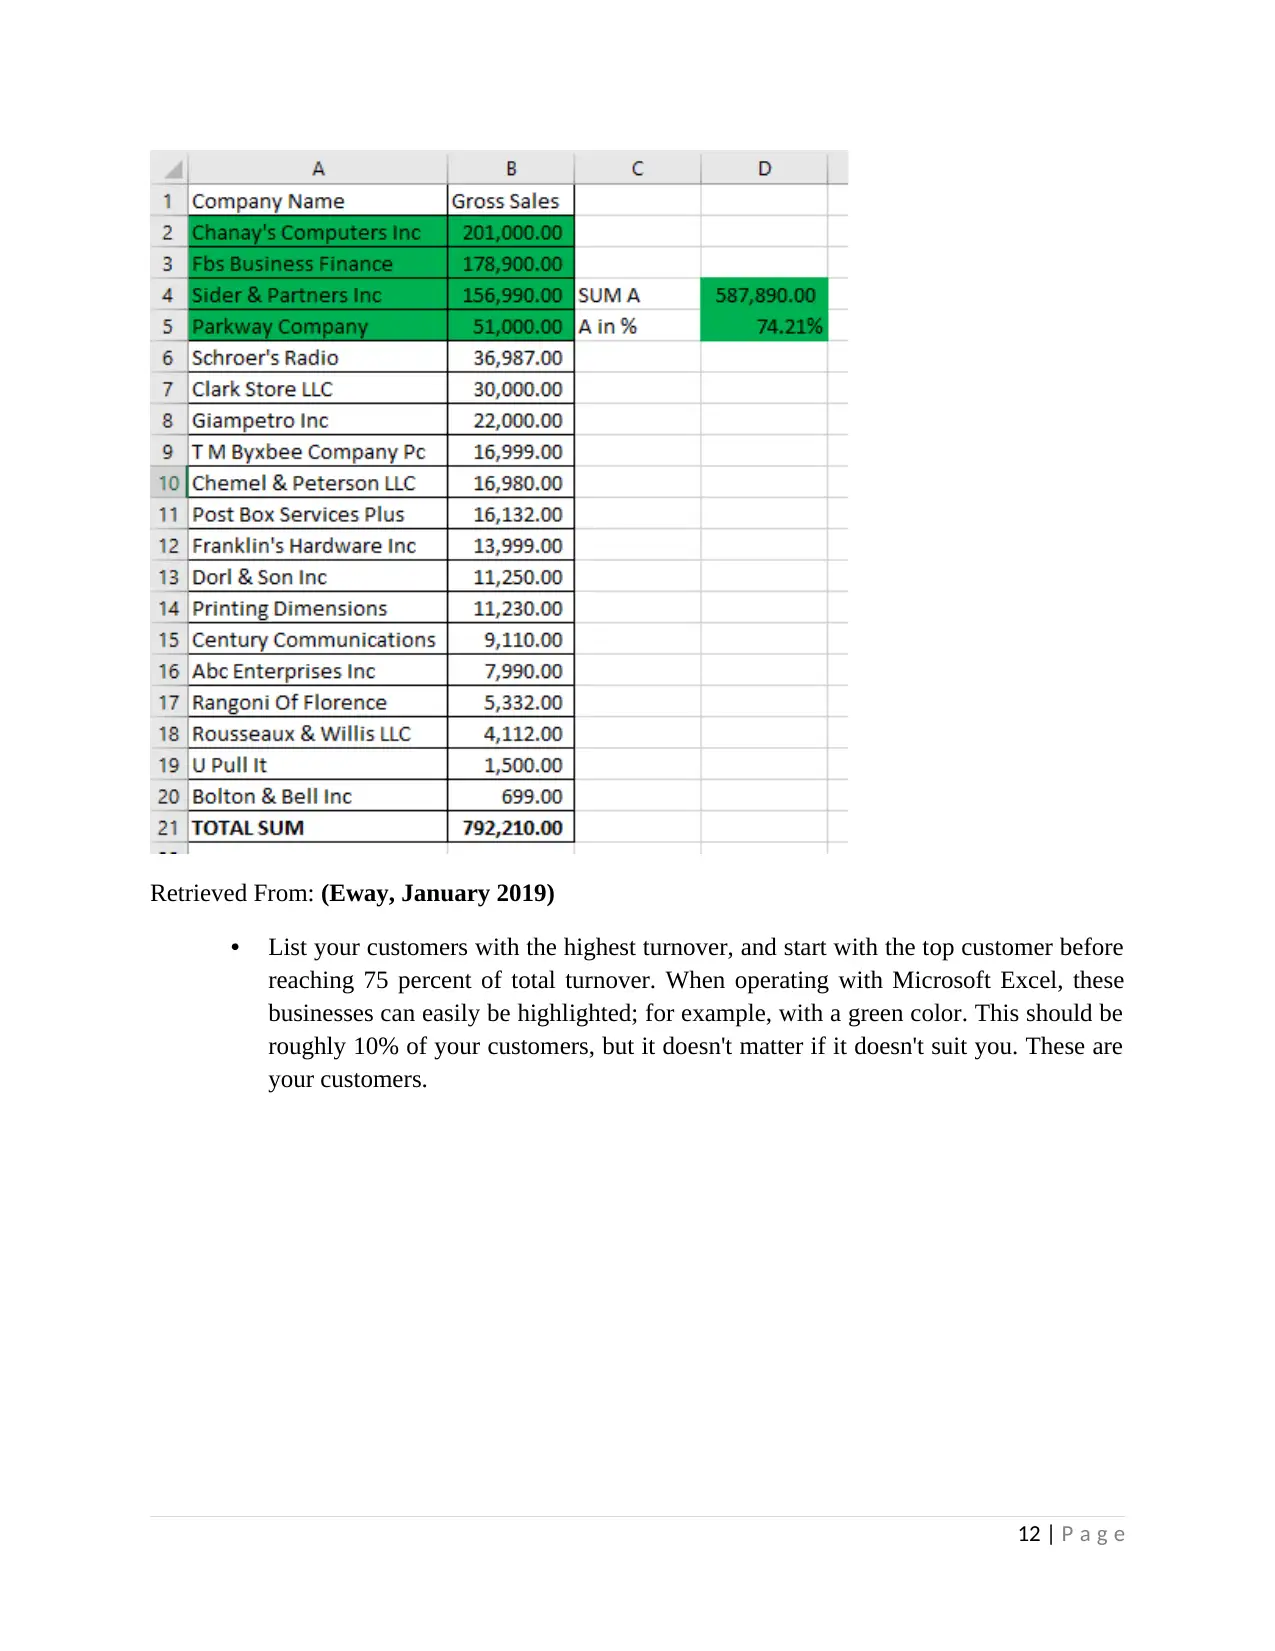
Retrieved From: (Eway, January 2019)
• List your customers with the highest turnover, and start with the top customer before
reaching 75 percent of total turnover. When operating with Microsoft Excel, these
businesses can easily be highlighted; for example, with a green color. This should be
roughly 10% of your customers, but it doesn't matter if it doesn't suit you. These are
your customers.
12 | P a g e
⊘ This is a preview!⊘
Do you want full access?
Subscribe today to unlock all pages.
Trusted by 1+ million students worldwide
1 out of 14
Related Documents


Your All-in-One AI-Powered Toolkit for Academic Success.
+13062052269
info@desklib.com
Available 24*7 on WhatsApp / Email
![[object Object]](/_next/static/media/star-bottom.7253800d.svg)
Unlock your academic potential
Copyright © 2020–2026 A2Z Services. All Rights Reserved. Developed and managed by ZUCOL.