Digital Marketing Analytics and Strategy Report: User Behavior

Verified

Added on  2022/12/26

|10
|1920
|84
Report
AI Summary
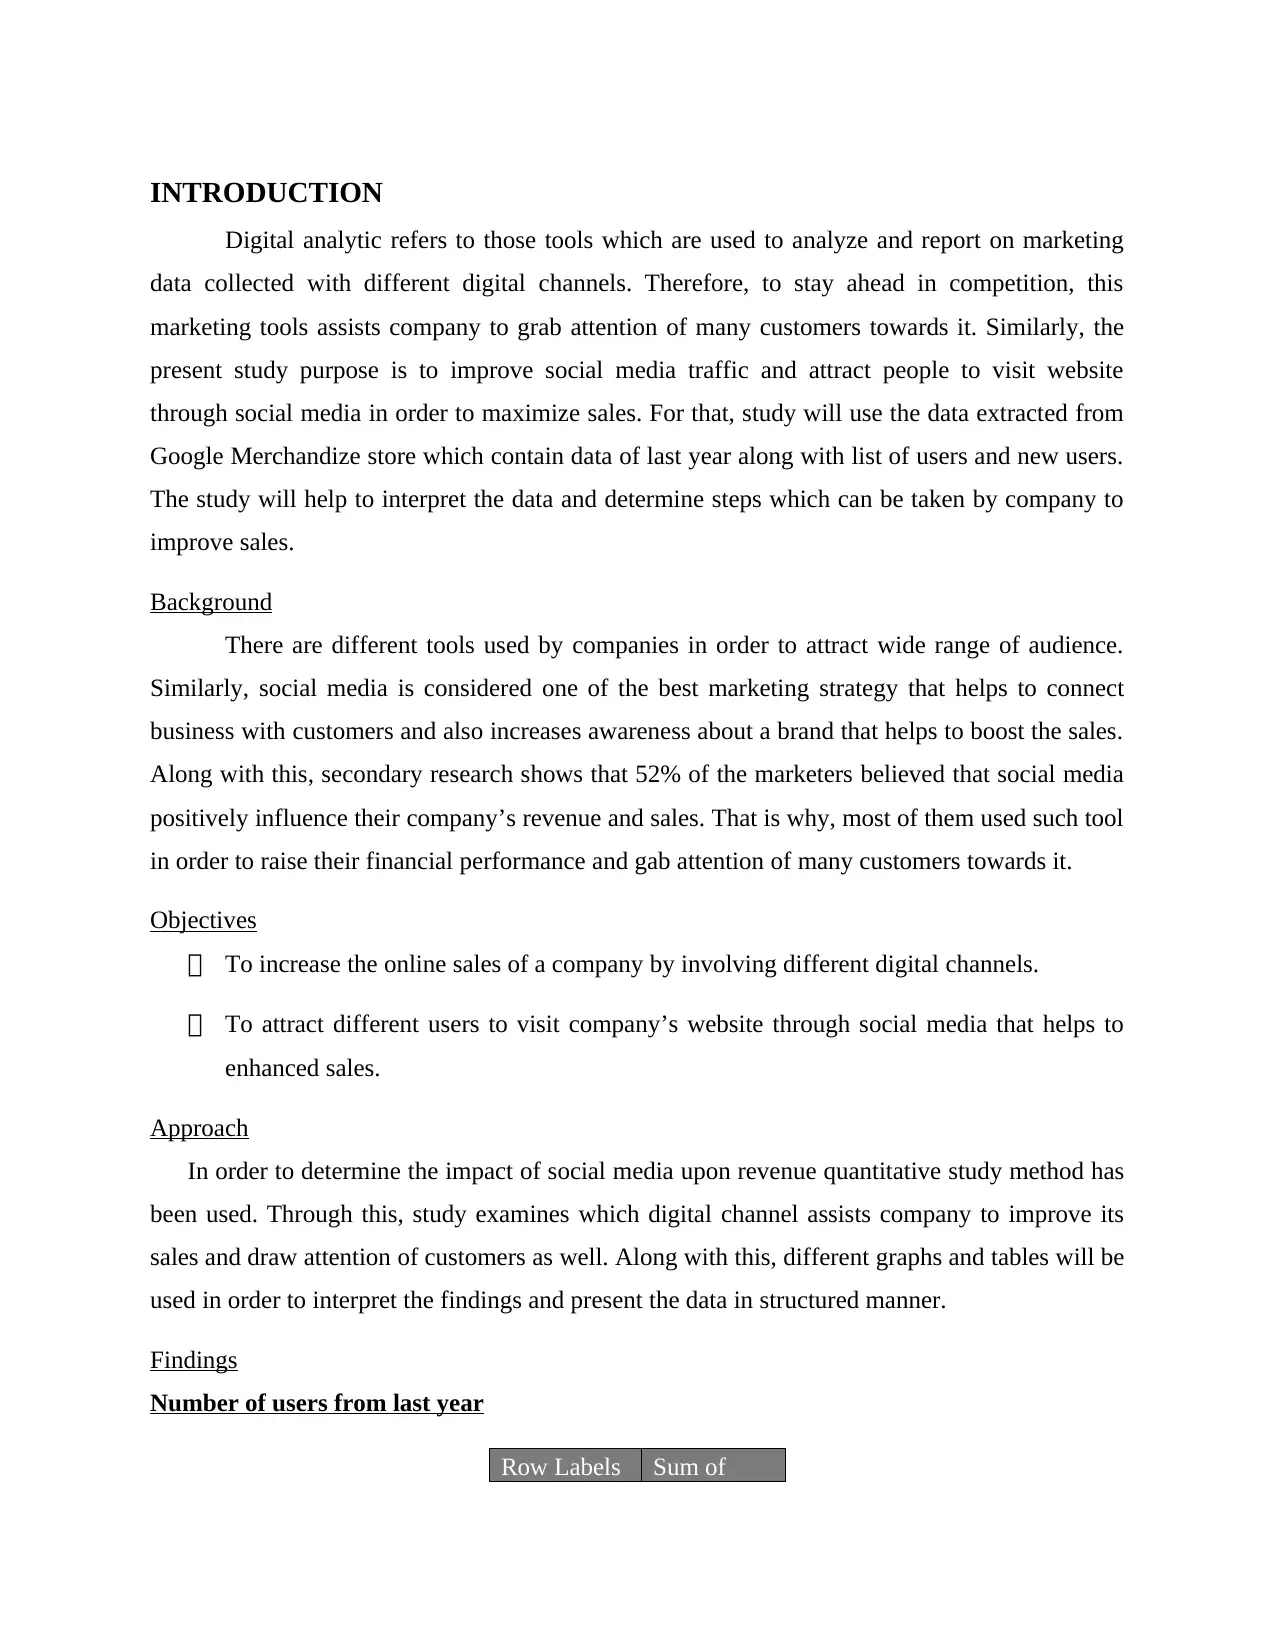
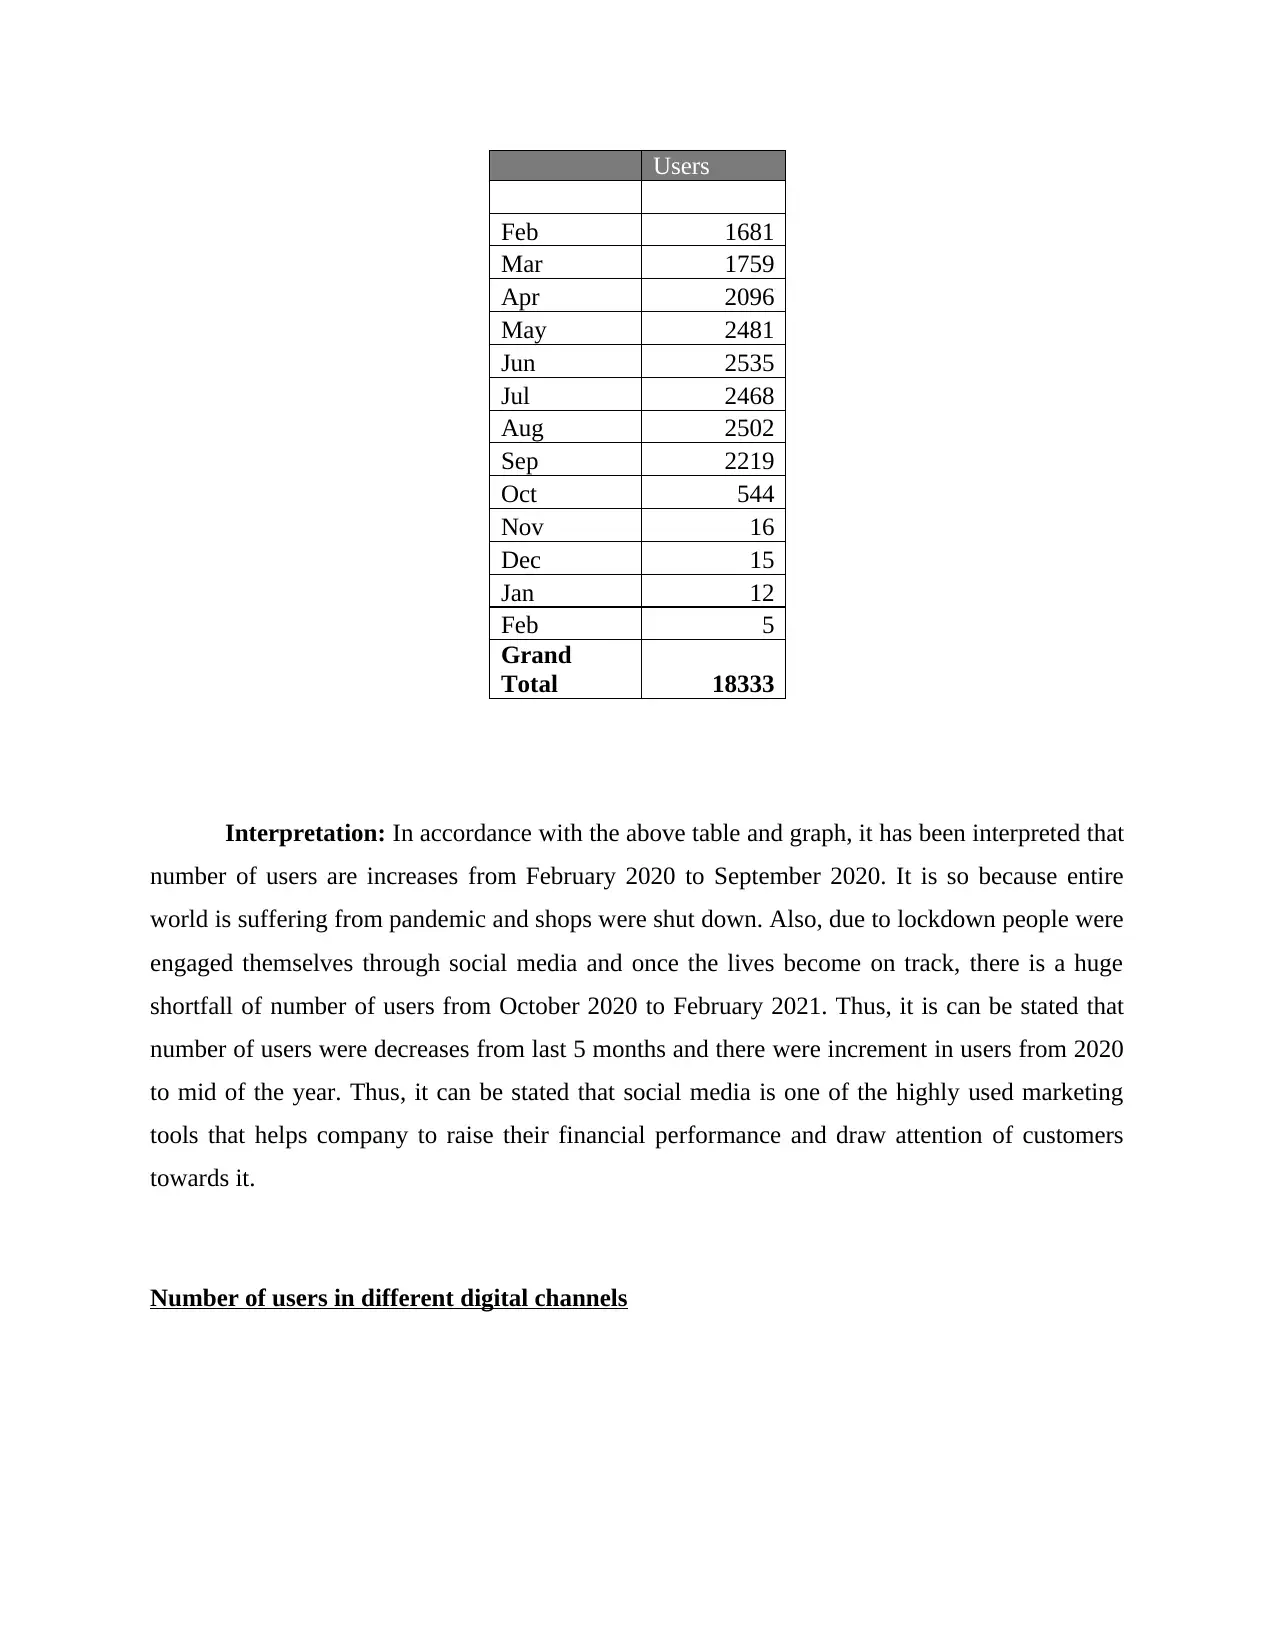
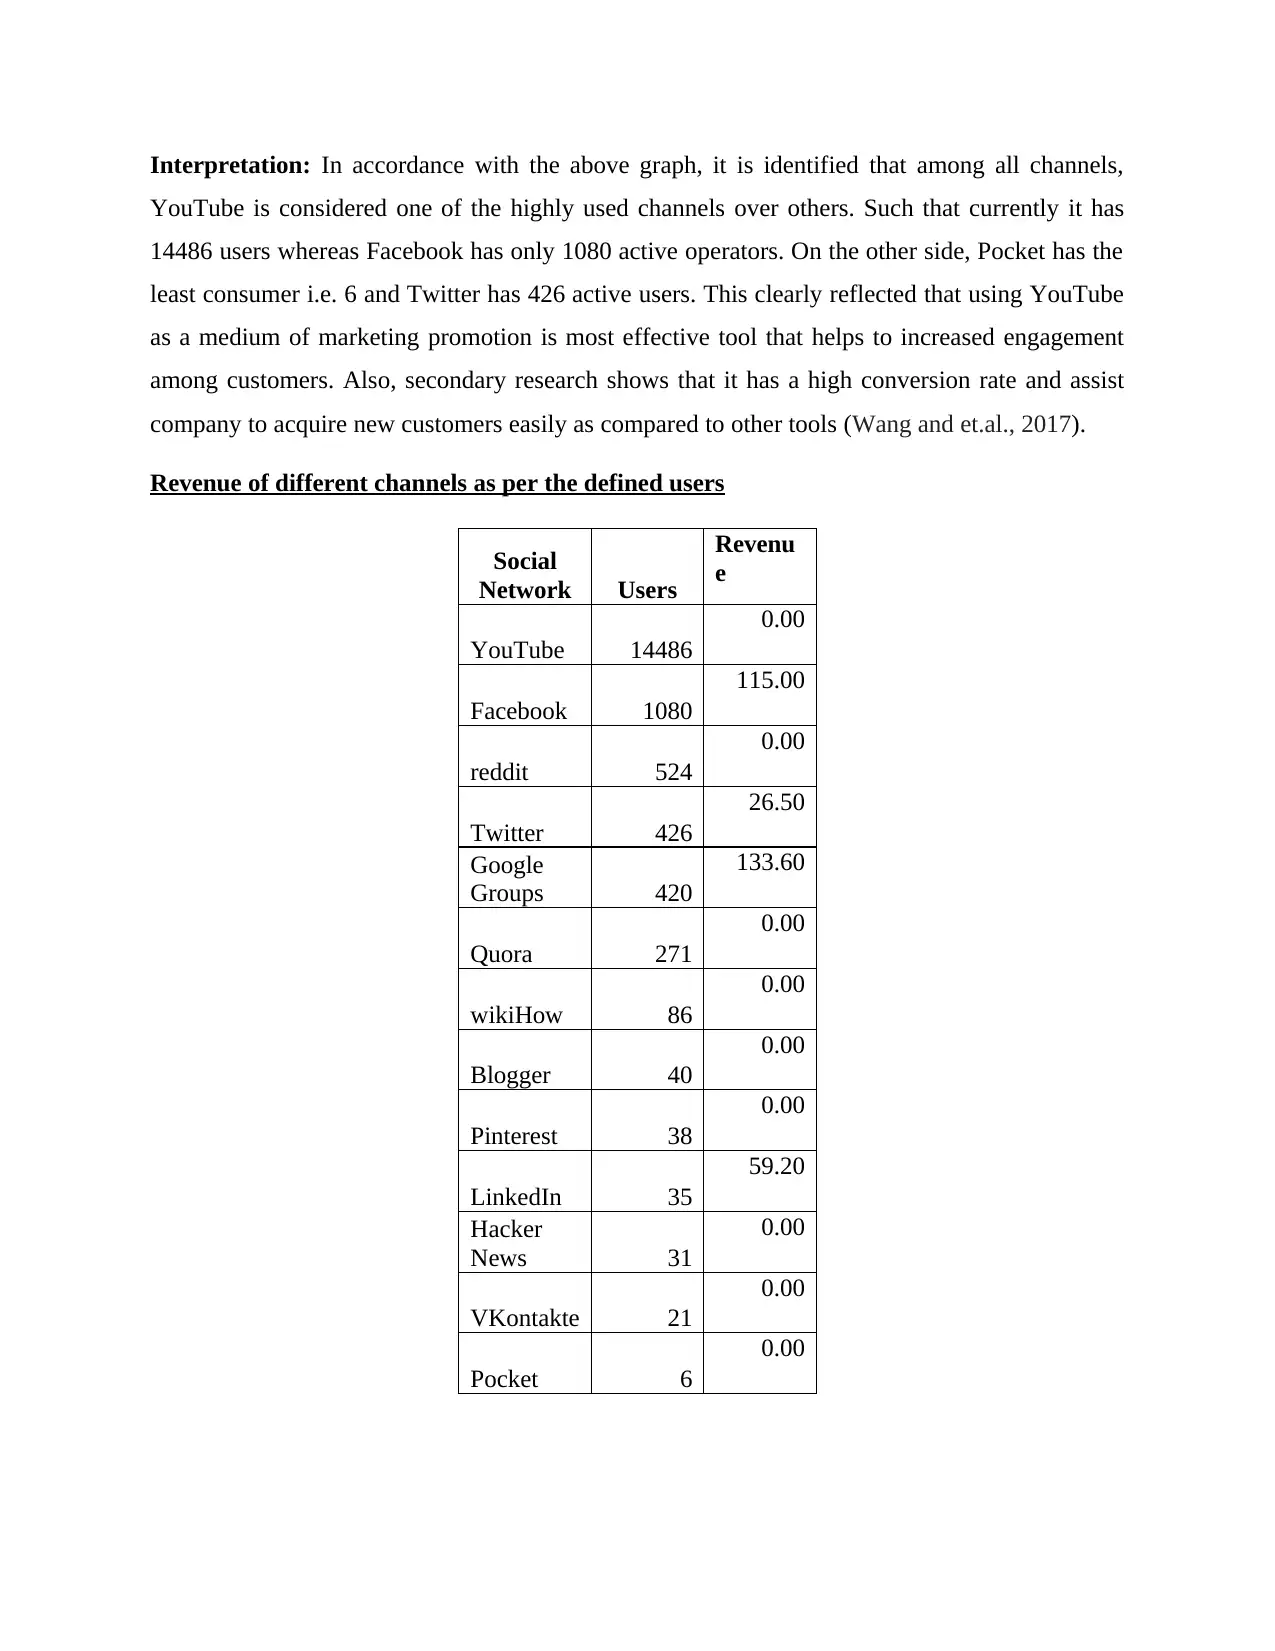
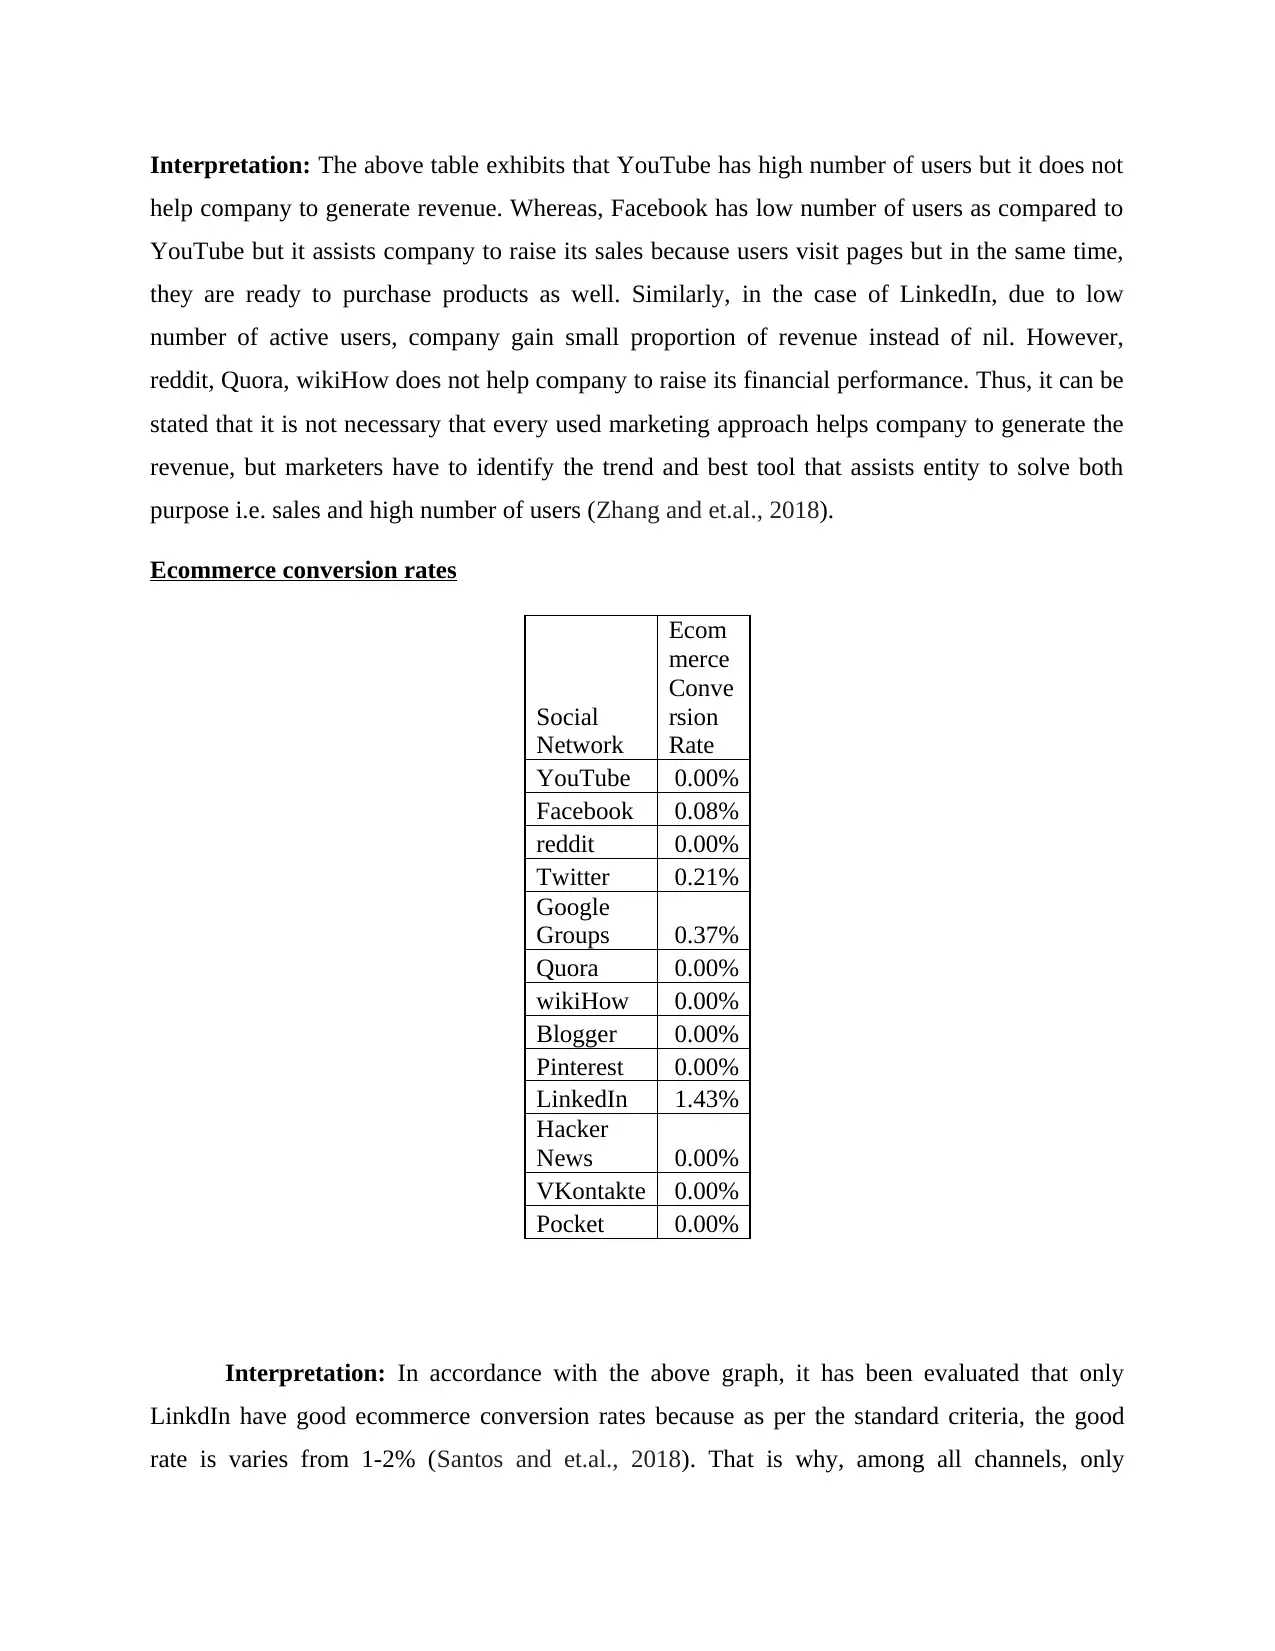
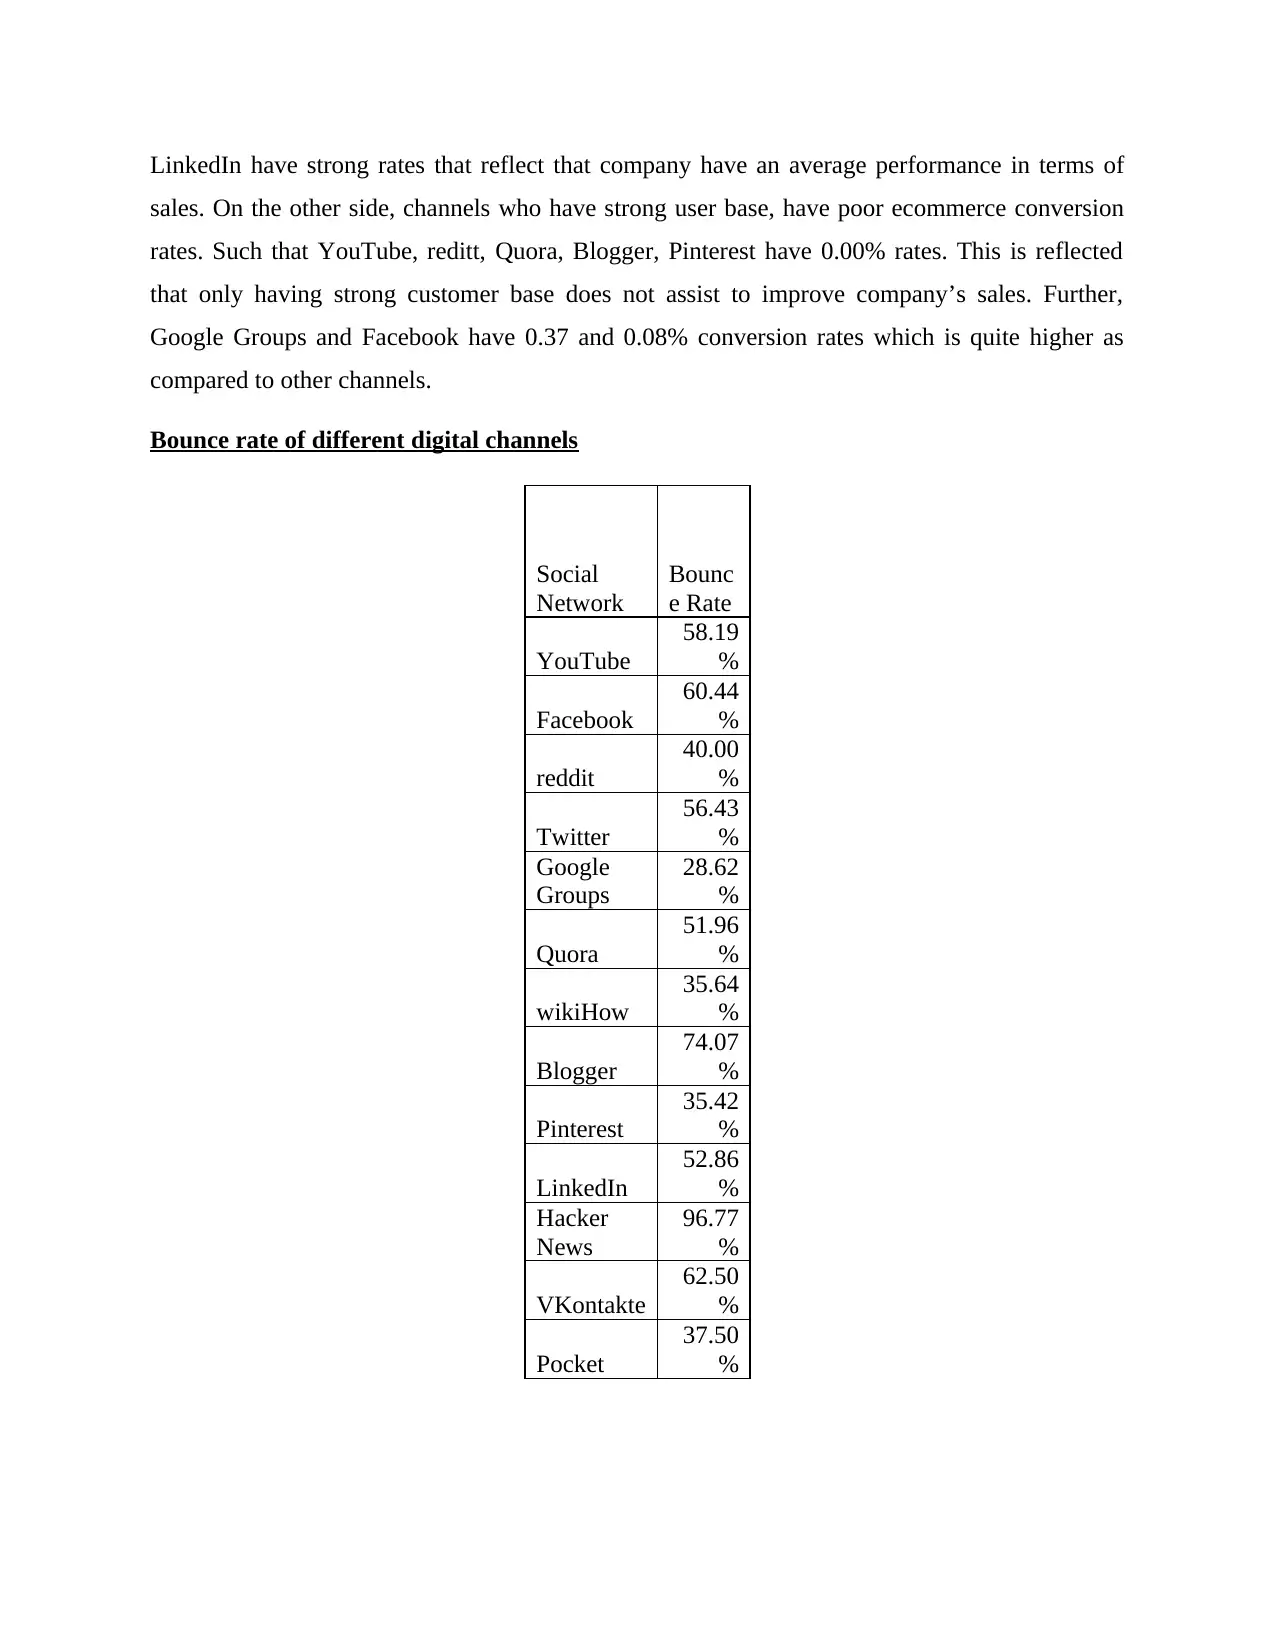
This report provides a detailed analysis of digital marketing data, focusing on sales, website traffic, and user behavior across various social media channels. The study examines data from Google Merchandize store, analyzing user trends from February 2020 to February 2021, revealing insights into the impact of the pandemic and lockdown on social media engagement. The findings highlight the dominance of YouTube in terms of user base, while also evaluating the revenue generation and ecommerce conversion rates of different channels like Facebook, LinkedIn, Reddit, and Twitter. The report further investigates bounce rates to assess the effectiveness of each channel in attracting and retaining users. Based on these findings, the report recommends strategies to improve YouTube content, optimize conversion rates through limited-time offers, enhance content shareability, leverage SEO, and improve site speed to boost sales and social media traffic. The conclusion emphasizes the importance of creative content, visuals, and SEO to attract customers and increase online sales.
Document Page
Digital Marketing Analytics
& Strategy
tabler-icon-diamond-filled.svg

Paraphrase This Document

Need a fresh take? Get an instant paraphrase of this document with our AI Paraphraser
Document Page
TABLE OF CONTENTS
INTRODUCTION...........................................................................................................................3
Background..................................................................................................................................3
Objectives....................................................................................................................................3
Approach......................................................................................................................................3
Findings........................................................................................................................................3
Recommendation.........................................................................................................................8
CONCLUSION................................................................................................................................9
REFERENCES..............................................................................................................................10
Document Page
INTRODUCTION
Digital analytic refers to those tools which are used to analyze and report on marketing
data collected with different digital channels. Therefore, to stay ahead in competition, this
marketing tools assists company to grab attention of many customers towards it. Similarly, the
present study purpose is to improve social media traffic and attract people to visit website
through social media in order to maximize sales. For that, study will use the data extracted from
Google Merchandize store which contain data of last year along with list of users and new users.
The study will help to interpret the data and determine steps which can be taken by company to
improve sales.
Background
There are different tools used by companies in order to attract wide range of audience.
Similarly, social media is considered one of the best marketing strategy that helps to connect
business with customers and also increases awareness about a brand that helps to boost the sales.
Along with this, secondary research shows that 52% of the marketers believed that social media
positively influence their company’s revenue and sales. That is why, most of them used such tool
in order to raise their financial performance and gab attention of many customers towards it.
Objectives
To increase the online sales of a company by involving different digital channels.
To attract different users to visit company’s website through social media that helps to
enhanced sales.
Approach
In order to determine the impact of social media upon revenue quantitative study method has
been used. Through this, study examines which digital channel assists company to improve its
sales and draw attention of customers as well. Along with this, different graphs and tables will be
used in order to interpret the findings and present the data in structured manner.
Findings
Number of users from last year
Row Labels Sum of
Document Page
Users
Feb 1681
Mar 1759
Apr 2096
May 2481
Jun 2535
Jul 2468
Aug 2502
Sep 2219
Oct 544
Nov 16
Dec 15
Jan 12
Feb 5
Grand
Total 18333
Interpretation: In accordance with the above table and graph, it has been interpreted that
number of users are increases from February 2020 to September 2020. It is so because entire
world is suffering from pandemic and shops were shut down. Also, due to lockdown people were
engaged themselves through social media and once the lives become on track, there is a huge
shortfall of number of users from October 2020 to February 2021. Thus, it is can be stated that
number of users were decreases from last 5 months and there were increment in users from 2020
to mid of the year. Thus, it can be stated that social media is one of the highly used marketing
tools that helps company to raise their financial performance and draw attention of customers
towards it.
Number of users in different digital channels
tabler-icon-diamond-filled.svg

Paraphrase This Document

Need a fresh take? Get an instant paraphrase of this document with our AI Paraphraser
Document Page
Interpretation: In accordance with the above graph, it is identified that among all channels,
YouTube is considered one of the highly used channels over others. Such that currently it has
14486 users whereas Facebook has only 1080 active operators. On the other side, Pocket has the
least consumer i.e. 6 and Twitter has 426 active users. This clearly reflected that using YouTube
as a medium of marketing promotion is most effective tool that helps to increased engagement
among customers. Also, secondary research shows that it has a high conversion rate and assist
company to acquire new customers easily as compared to other tools (Wang and et.al., 2017).
Revenue of different channels as per the defined users
Social
Network Users
Revenu
e
YouTube 14486
0.00
Facebook 1080
115.00
reddit 524
0.00
Twitter 426
26.50
Google
Groups 420
133.60
Quora 271
0.00
wikiHow 86
0.00
Blogger 40
0.00
Pinterest 38
0.00
LinkedIn 35
59.20
Hacker
News 31
0.00
VKontakte 21
0.00
Pocket 6
0.00
Document Page
Interpretation: The above table exhibits that YouTube has high number of users but it does not
help company to generate revenue. Whereas, Facebook has low number of users as compared to
YouTube but it assists company to raise its sales because users visit pages but in the same time,
they are ready to purchase products as well. Similarly, in the case of LinkedIn, due to low
number of active users, company gain small proportion of revenue instead of nil. However,
reddit, Quora, wikiHow does not help company to raise its financial performance. Thus, it can be
stated that it is not necessary that every used marketing approach helps company to generate the
revenue, but marketers have to identify the trend and best tool that assists entity to solve both
purpose i.e. sales and high number of users (Zhang and et.al., 2018).
Ecommerce conversion rates
Social
Network
Ecom
merce
Conve
rsion
Rate
YouTube 0.00%
Facebook 0.08%
reddit 0.00%
Twitter 0.21%
Google
Groups 0.37%
Quora 0.00%
wikiHow 0.00%
Blogger 0.00%
Pinterest 0.00%
LinkedIn 1.43%
Hacker
News 0.00%
VKontakte 0.00%
Pocket 0.00%
Interpretation: In accordance with the above graph, it has been evaluated that only
LinkdIn have good ecommerce conversion rates because as per the standard criteria, the good
rate is varies from 1-2% (Santos and et.al., 2018). That is why, among all channels, only
Document Page
LinkedIn have strong rates that reflect that company have an average performance in terms of
sales. On the other side, channels who have strong user base, have poor ecommerce conversion
rates. Such that YouTube, reditt, Quora, Blogger, Pinterest have 0.00% rates. This is reflected
that only having strong customer base does not assist to improve company’s sales. Further,
Google Groups and Facebook have 0.37 and 0.08% conversion rates which is quite higher as
compared to other channels.
Bounce rate of different digital channels
Social
Network
Bounc
e Rate
YouTube
58.19
%
Facebook
60.44
%
reddit
40.00
%
Twitter
56.43
%
Google
Groups
28.62
%
Quora
51.96
%
wikiHow
35.64
%
Blogger
74.07
%
Pinterest
35.42
%
LinkedIn
52.86
%
Hacker
News
96.77
%
VKontakte
62.50
%
Pocket
37.50
%
tabler-icon-diamond-filled.svg

Paraphrase This Document

Need a fresh take? Get an instant paraphrase of this document with our AI Paraphraser
Document Page
Interpretation: From the above diagram, it has been interpreted that having lower number of
bounce rate means company have a strong presence in the online market and it assists to attract
range of customers towards it. Therefore, among all channels, only reddit, Google Group,
wikiHow, Pinterest and Pocket have strong bounce rate i.e. 40, 28.62, 35.64, 35.42, 37.50%
respectively. Whereas, YouTube and Facebook have around 60% rate which means company
needs improvement in the terms of strategy used to attract customers towards social sites. Hence,
it can be stated that there is a need to focus upon its bounce rate so that it will help a business to
improve the sales.
Recommendation
It is analyzed that company use YouTube, but it does not help them to generate revenue.
That is why, it is recommended to the companies to use the effective layout and eye-
catchy content in which brief description of the offers will be defined (Nallaperuma and
et.al., 2019). Also, this assists company to raise the sales and also helps to generate the
valid outcomes.
Through the above data analytics it is analyzed that many digital channels have low
ecommerce conversion rates. So, to improve the same, it is recommended to provide
limited time coupon codes in which customer have to redeem the same within limited
time frame. This in turn helps to increase the web traffic and gain attention of many
customers as well.
Further to increase social media traffic, it is also suggested to companies that they make
their content easily shareable and accessible to the customers so that they visit the link
again (6 ways to immediately boost your social media traffic, 2021). Also, companies
should tie up with SEO who improve the online visibility so that it assists to generate
more sales. The strategy further assists business entity to develop brand image at
international level.
Along with this, it is also suggested that the content should be attractive and provide
long-lasting impression to customers by providing visual. It is so because most of the
customers prefer to visit website that provide impressive visuals and these also assists to
make sure that their purchasing decision are valid. Also, customers are read to pay by
Document Page
comparing product’s prices and quality through other’s reviews. This in turn aid business
to improve their online sales which directly boost social media web traffic as well.
In order to improve bounce rates within different channels, it is recommended to improve
the site’s speed by using different tools which includes Pingdom and Google page speed.
This strategy assists company to use visual images and provide creative content that
assists to foster sales.
CONCLUSION
By summing up above report, it has been concluded that there are range of digital
platforms through which company is able to promote their products and among all, data reflected
that YouTube is considered one of the highly used channels. Also, study evaluated that if
channel have strong users that does not mean it helps to generate revenue and have strong
bounce rate. Therefore, to improve such company must focused upon to use creative content,
visual images, improve its SEO that assists business to attract range of customers and increase
social media web traffic as well.
Document Page
REFERENCES
Books and Journals
Nallaperuma, D. and et.al., 2019. Online incremental machine learning platform for big data-
driven smart traffic management. IEEE Transactions on Intelligent Transportation
Systems. 20(12). pp.4679-4690.
Santos, B. P. and et.al., 2018, June. Enriching traffic information with a spatiotemporal model
based on social media. In 2018 IEEE Symposium on Computers and Communications
(ISCC) (pp. 00464-00469). IEEE.
Wang, S. and et.al., 2017. Computing urban traffic congestions by incorporating sparse GPS
probe data and social media data. ACM Transactions on Information Systems
(TOIS). 35(4). pp.1-30.
Zhang, Z. and et.al., 2018. A deep learning approach for detecting traffic accidents from social
media data. Transportation research part C: emerging technologies. 86. pp.580-596.
Online
6 ways to immediately boost your social media traffic. 2021. [Online]. Available through: <
https://sproutsocial.com/insights/social-media-traffic/>.
chevron_up_icon
1 out of 10
circle_padding
hide_on_mobile
zoom_out_icon
[object Object]