Analysis of Digital Marketing Analytics and Strategy for Google
VerifiedAdded on 2022/12/26
|18
|3874
|26
Report
AI Summary
This report provides a detailed analysis of digital marketing strategies and consumer engagement for the Google Merchandise Store. The study utilizes data from January 1, 2020, to December 31, 2021, examining metrics such as bounce rate, revenue, and number of users across different countries. The objective is to assess consumer engagement levels and identify areas for improvement. The report employs SPSS for data analysis, including regression and correlation analyses to determine relationships between variables like average session duration, bounce rate, revenue, and transactions. Findings reveal a negative correlation between bounce rate and session duration, suggesting that customer engagement is not directly influenced by these factors. The analysis also identifies the US, Canada, and the UK as the most effective countries in terms of revenue and transactions, and recommends strategies to increase customer base through digital campaigns. The study concludes that digital marketing campaigns are crucial for driving customer engagement and expanding the merchandise store's reach.

Digital marketing Analytics
and Strategy
1
and Strategy
1
Paraphrase This Document
Need a fresh take? Get an instant paraphrase of this document with our AI Paraphraser
Table of Contents
INTRODUCTION ..........................................................................................................................3
Objectives ...................................................................................................................................3
To examine consumers' engagement with website in different countries...................................3
Frequencies..................................................................................................................................6
CONCLUSION .............................................................................................................................16
REFERENCES..............................................................................................................................17
2
INTRODUCTION
A way or process via which companies promote its brand in order to connect with potential
customers and when this process is being done with internet then it is known as digital marketing
(Kannan, 2017). All marketing functions such as researching about customers, markets,
attraction of customers, promotion of brand and providing products with internet is counted in
digital marketing. The reason of making use of digital marketing to the great extent via some
platforms such as Facebook, pinterest and others is global reach, providing value to customers
and measuring effectiveness. It helps companies in knowing all those that customers exactly
wants.
This present study is based on Google Merchandise store that wants to identify level of
customers' engagement in different countries. One of the main reasons of knowing engagement
level of customers all around the world is to know that which country is effective and highly
engaged. It will further also discuss some areas where companies of less engaged with customers
require more focus with the help of Google merchandise store. On the basis of interpretation of
data, better decision can be made. Objective of conducting this research is:
Objectives
To examine consumers' engagement with website in different countries
For analysing consumers' engagement rate, it is important to have appropriate data of
different countries and via websites, authenticate data have been gathered. Dataset that is
available on Google merchandise store of 1 year from 1st Jan 2020 to 31st Dec 2021 will be taken.
For interpretation and better results all appropriate information of each country such as: bounce
rate, revenue, number of users will be used. For data analysing, SPSS tool will be used and will
help out in knowing customers engagement rate and generation of revenue. So, overall it can be
said that data analysis plays a vital role and selection of tools and type of data analysis depend
upon the type of data and topic. Decision will also be taken in the best and effective manner.
Frequencies
Regression analysis
For this regression analysis it is important to identify or select appropriate variables so, as
per the objective, average session duration and bounce rate has been selected. Each average
session duration of country varies this duration is directly associated with bounce rate. Changes
3
⊘ This is a preview!⊘
Do you want full access?
Subscribe today to unlock all pages.
Trusted by 1+ million students worldwide
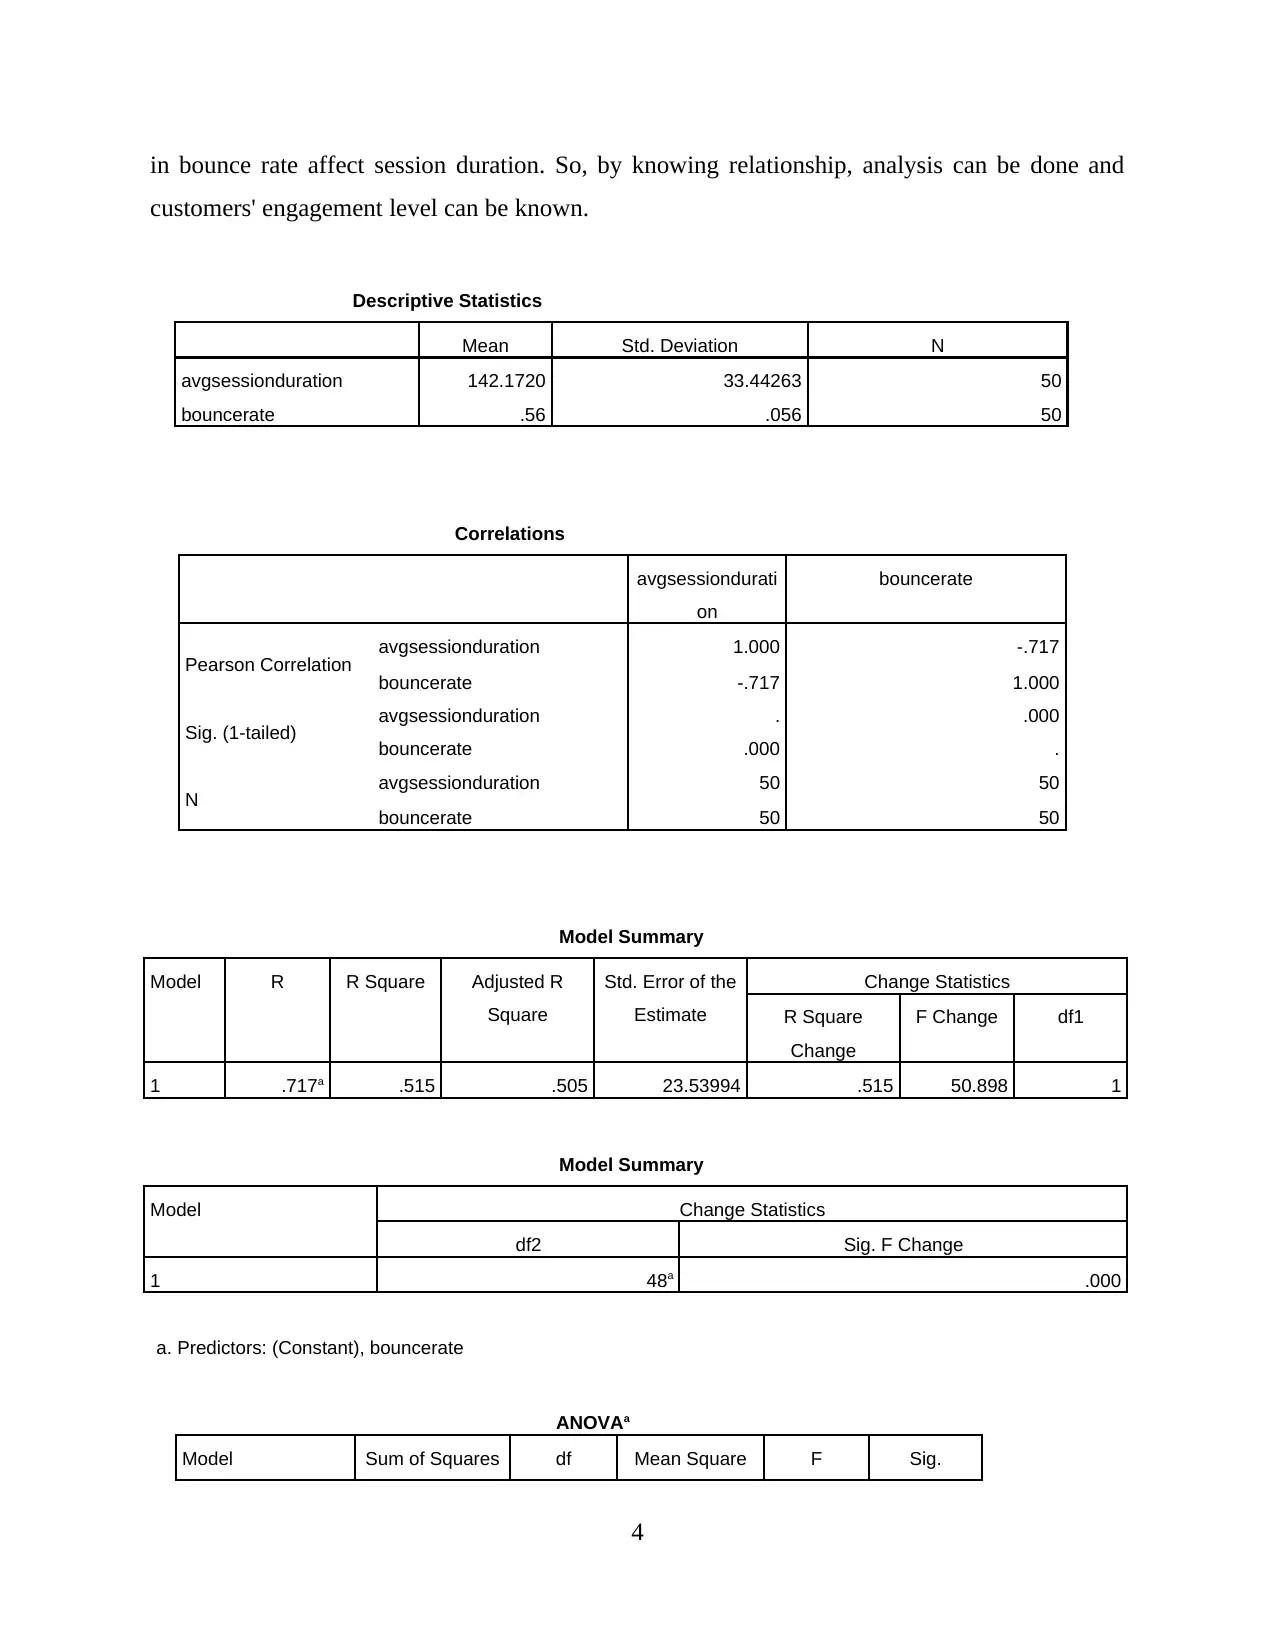
in bounce rate affect session duration. So, by knowing relationship, analysis can be done and
customers' engagement level can be known.
Descriptive Statistics
Mean Std. Deviation N
avgsessionduration 142.1720 33.44263 50
bouncerate .56 .056 50
Correlations
avgsessiondurati
on
bouncerate
Pearson Correlation avgsessionduration 1.000 -.717
bouncerate -.717 1.000
Sig. (1-tailed) avgsessionduration . .000
bouncerate .000 .
N avgsessionduration 50 50
bouncerate 50 50
Model Summary
Model R R Square Adjusted R
Square
Std. Error of the
Estimate
Change Statistics
R Square
Change
F Change df1
1 .717a .515 .505 23.53994 .515 50.898 1
Model Summary
Model Change Statistics
df2 Sig. F Change
1 48a .000
a. Predictors: (Constant), bouncerate
ANOVAa
Model Sum of Squares df Mean Square F Sig.
4
Paraphrase This Document
Need a fresh take? Get an instant paraphrase of this document with our AI Paraphraser
1
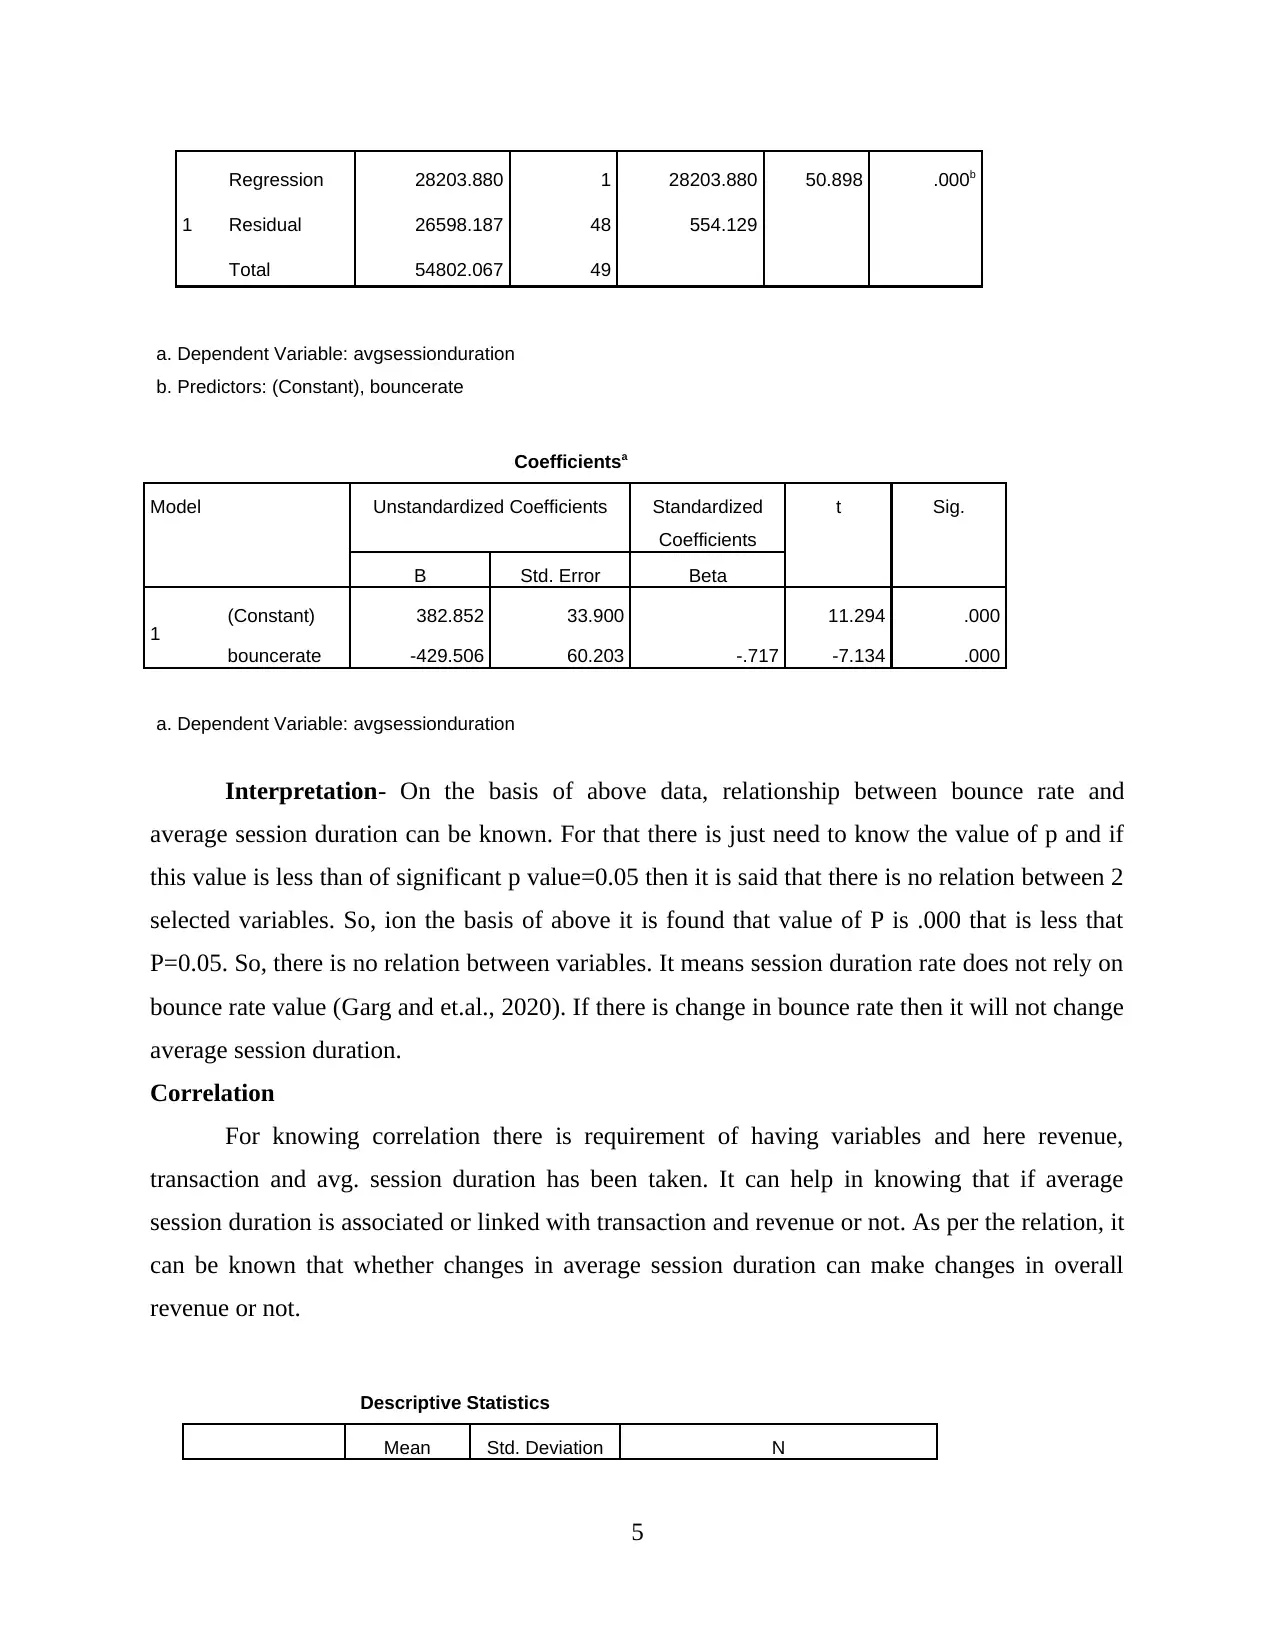
Regression 28203.880 1 28203.880 50.898 .000b
Residual 26598.187 48 554.129
Total 54802.067 49
a. Dependent Variable: avgsessionduration
b. Predictors: (Constant), bouncerate
Coefficientsa
Model Unstandardized Coefficients Standardized
Coefficients
t Sig.
B Std. Error Beta
1 (Constant) 382.852 33.900 11.294 .000
bouncerate -429.506 60.203 -.717 -7.134 .000
a. Dependent Variable: avgsessionduration
Interpretation- On the basis of above data, relationship between bounce rate and
average session duration can be known. For that there is just need to know the value of p and if
this value is less than of significant p value=0.05 then it is said that there is no relation between 2
selected variables. So, ion the basis of above it is found that value of P is .000 that is less that
P=0.05. So, there is no relation between variables. It means session duration rate does not rely on
bounce rate value (Garg and et.al., 2020). If there is change in bounce rate then it will not change
average session duration.
Correlation
For knowing correlation there is requirement of having variables and here revenue,
transaction and avg. session duration has been taken. It can help in knowing that if average
session duration is associated or linked with transaction and revenue or not. As per the relation, it
can be known that whether changes in average session duration can make changes in overall
revenue or not.
Descriptive Statistics
Mean Std. Deviation N
5
avgsessiondurati
on 142.1720 33.44263 50
transaction 42.1400 281.73558 50
revenue 2581.0892 17015.32506 50
Correlations
avgsessiondurati
on
transaction revenue
avgsessiondurati
on
Pearson Correlation 1 .409** .411**
Sig. (2-tailed) .003 .003
N 50 50 50
transaction
Pearson Correlation .409** 1 1.000**
Sig. (2-tailed) .003 .000
N 50 50 50
revenue
Pearson Correlation .411** 1.000** 1
Sig. (2-tailed) .003 .000
N 50 50 50
**. Correlation is significant at the 0.01 level (2-tailed).
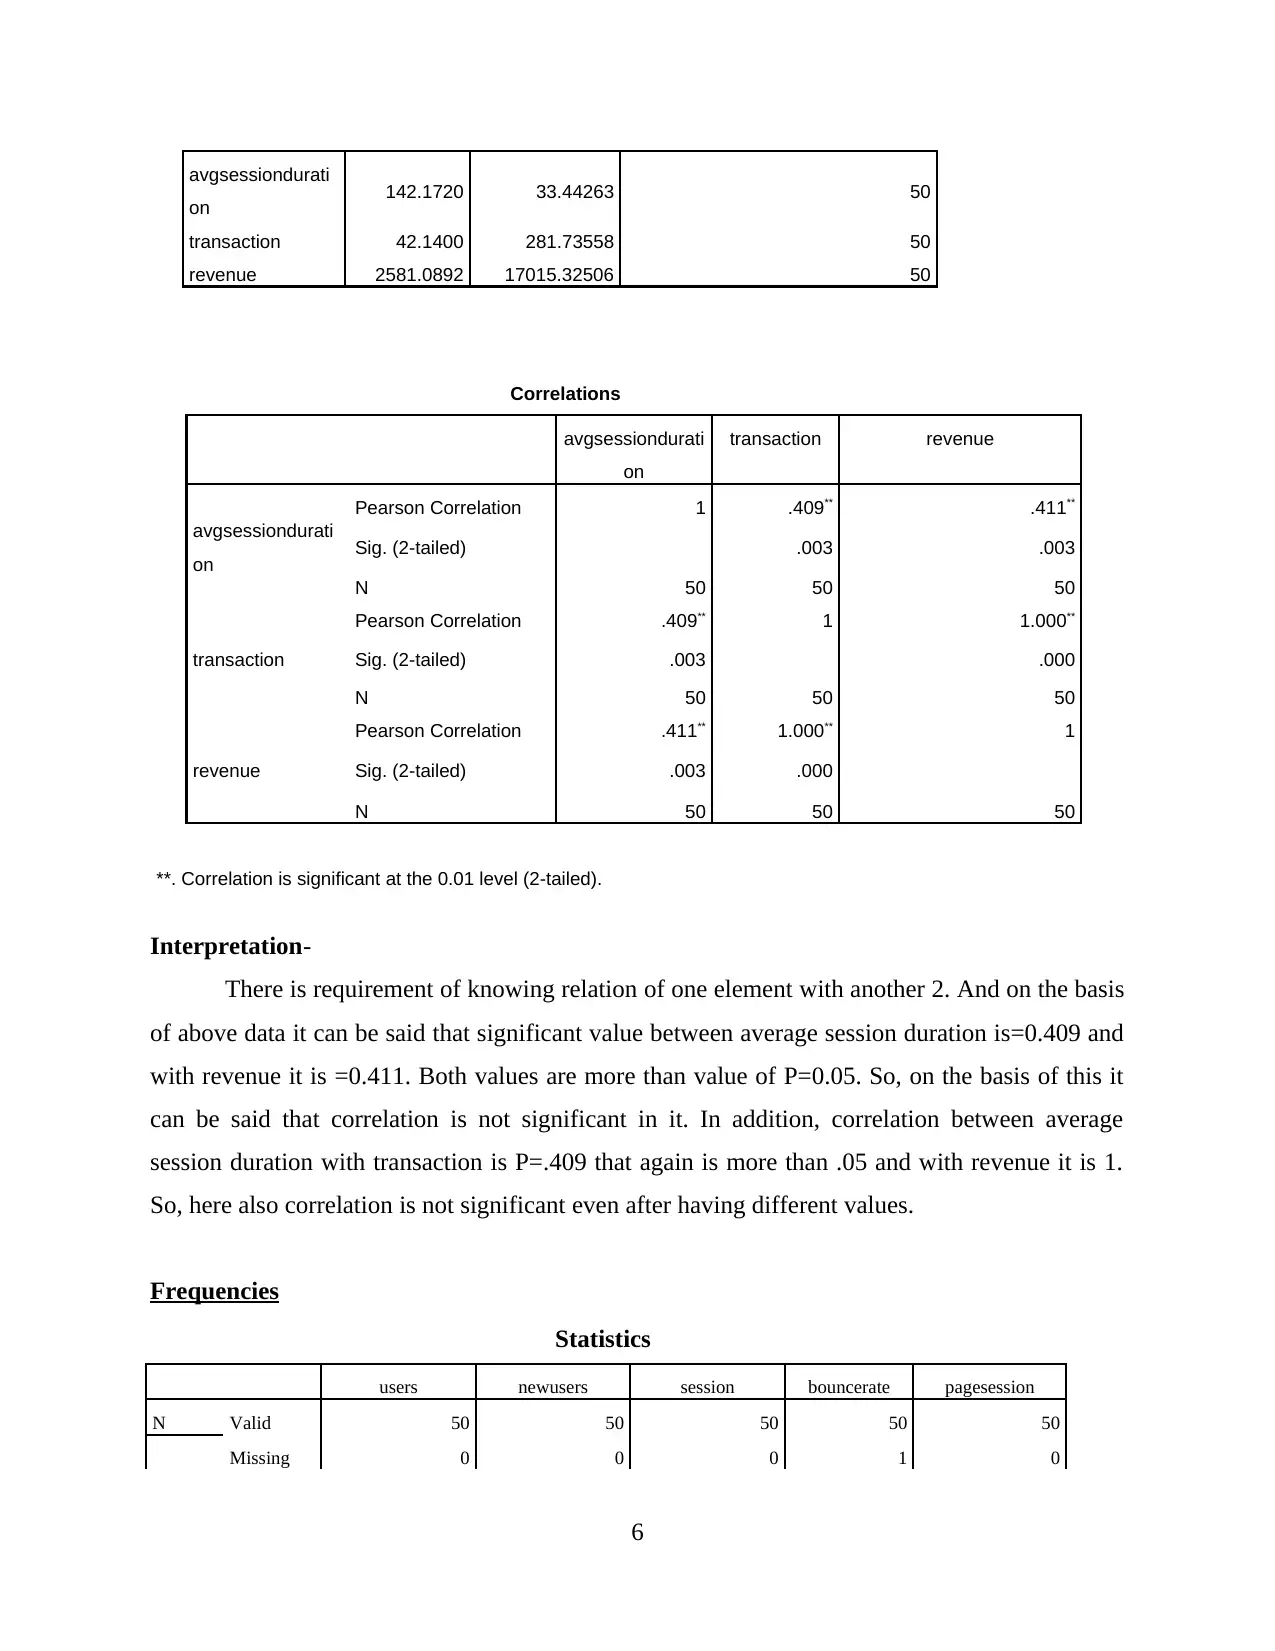
Interpretation-
There is requirement of knowing relation of one element with another 2. And on the basis
of above data it can be said that significant value between average session duration is=0.409 and
with revenue it is =0.411. Both values are more than value of P=0.05. So, on the basis of this it
can be said that correlation is not significant in it. In addition, correlation between average
session duration with transaction is P=.409 that again is more than .05 and with revenue it is 1.
So, here also correlation is not significant even after having different values.
Frequencies
Statistics
users newusers session bouncerate pagesession
N Valid 50 50 50 50 50
Missing 0 0 0 1 0
6
on 142.1720 33.44263 50
transaction 42.1400 281.73558 50
revenue 2581.0892 17015.32506 50
Correlations
avgsessiondurati
on
transaction revenue
avgsessiondurati
on
Pearson Correlation 1 .409** .411**
Sig. (2-tailed) .003 .003
N 50 50 50
transaction
Pearson Correlation .409** 1 1.000**
Sig. (2-tailed) .003 .000
N 50 50 50
revenue
Pearson Correlation .411** 1.000** 1
Sig. (2-tailed) .003 .000
N 50 50 50
**. Correlation is significant at the 0.01 level (2-tailed).
Interpretation-
There is requirement of knowing relation of one element with another 2. And on the basis
of above data it can be said that significant value between average session duration is=0.409 and
with revenue it is =0.411. Both values are more than value of P=0.05. So, on the basis of this it
can be said that correlation is not significant in it. In addition, correlation between average
session duration with transaction is P=.409 that again is more than .05 and with revenue it is 1.
So, here also correlation is not significant even after having different values.
Frequencies
Statistics
users newusers session bouncerate pagesession
N Valid 50 50 50 50 50
Missing 0 0 0 1 0
6
⊘ This is a preview!⊘
Do you want full access?
Subscribe today to unlock all pages.
Trusted by 1+ million students worldwide
Mean 10671.9000 10500.1000 14864.5800 .56 3.3466
Median 3154.5000 3077.5000 4169.5000 .56 3.2350
Std. Deviation 33082.35462 32606.10345 50136.26165 0a .67016
Variance 1094442186.990 1063157982.173 2513644731.800 .056 .449
Statistics
avgsessionduration transaction revenue ecommerceconversionrat
e
N Valid 50 50 50 0
Missing 0 0 0 50
Mean 142.1720 42.1400 2581.0892
Median 140.1700 1.0000 9.1750
Std. Deviation 33.44263 281.73558 17015.32506
Variance 1118.410 79374.939 289521286.750
7
Paraphrase This Document
Need a fresh take? Get an instant paraphrase of this document with our AI Paraphraser
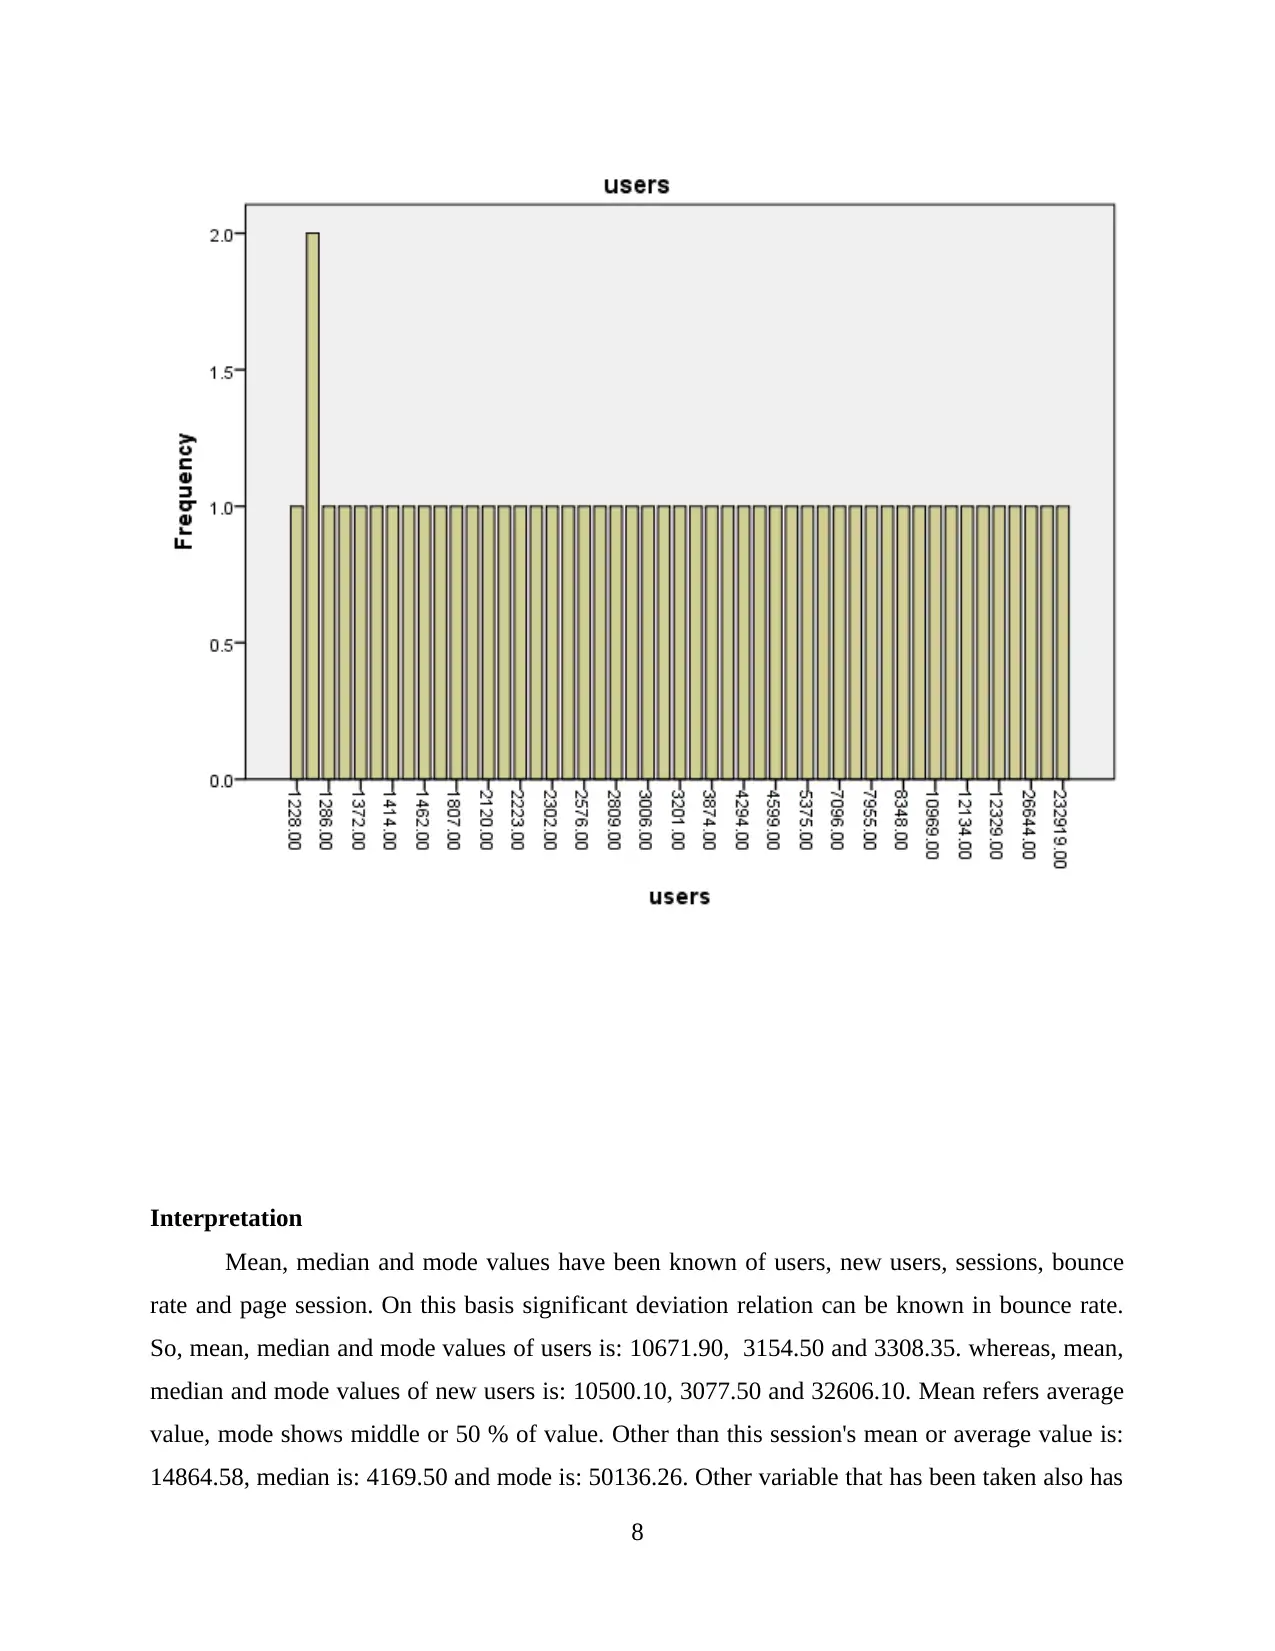
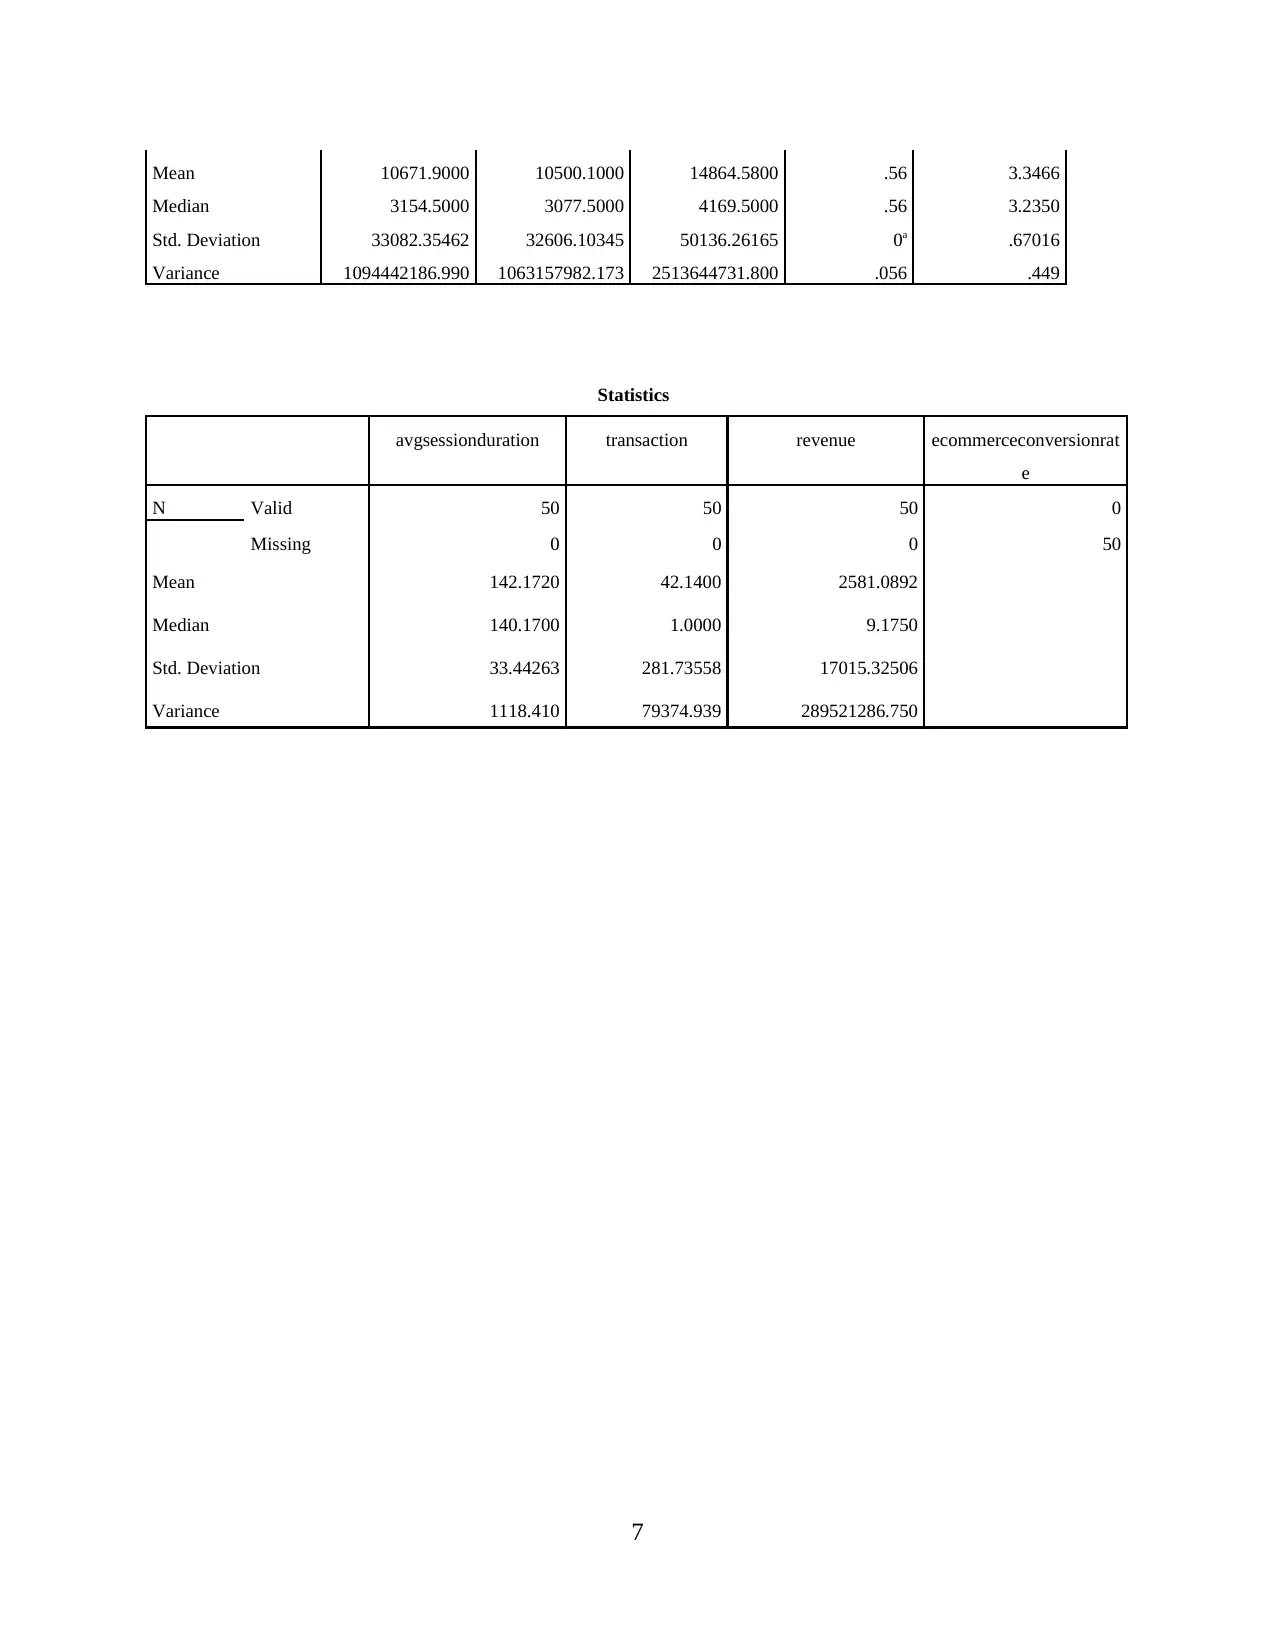
Interpretation
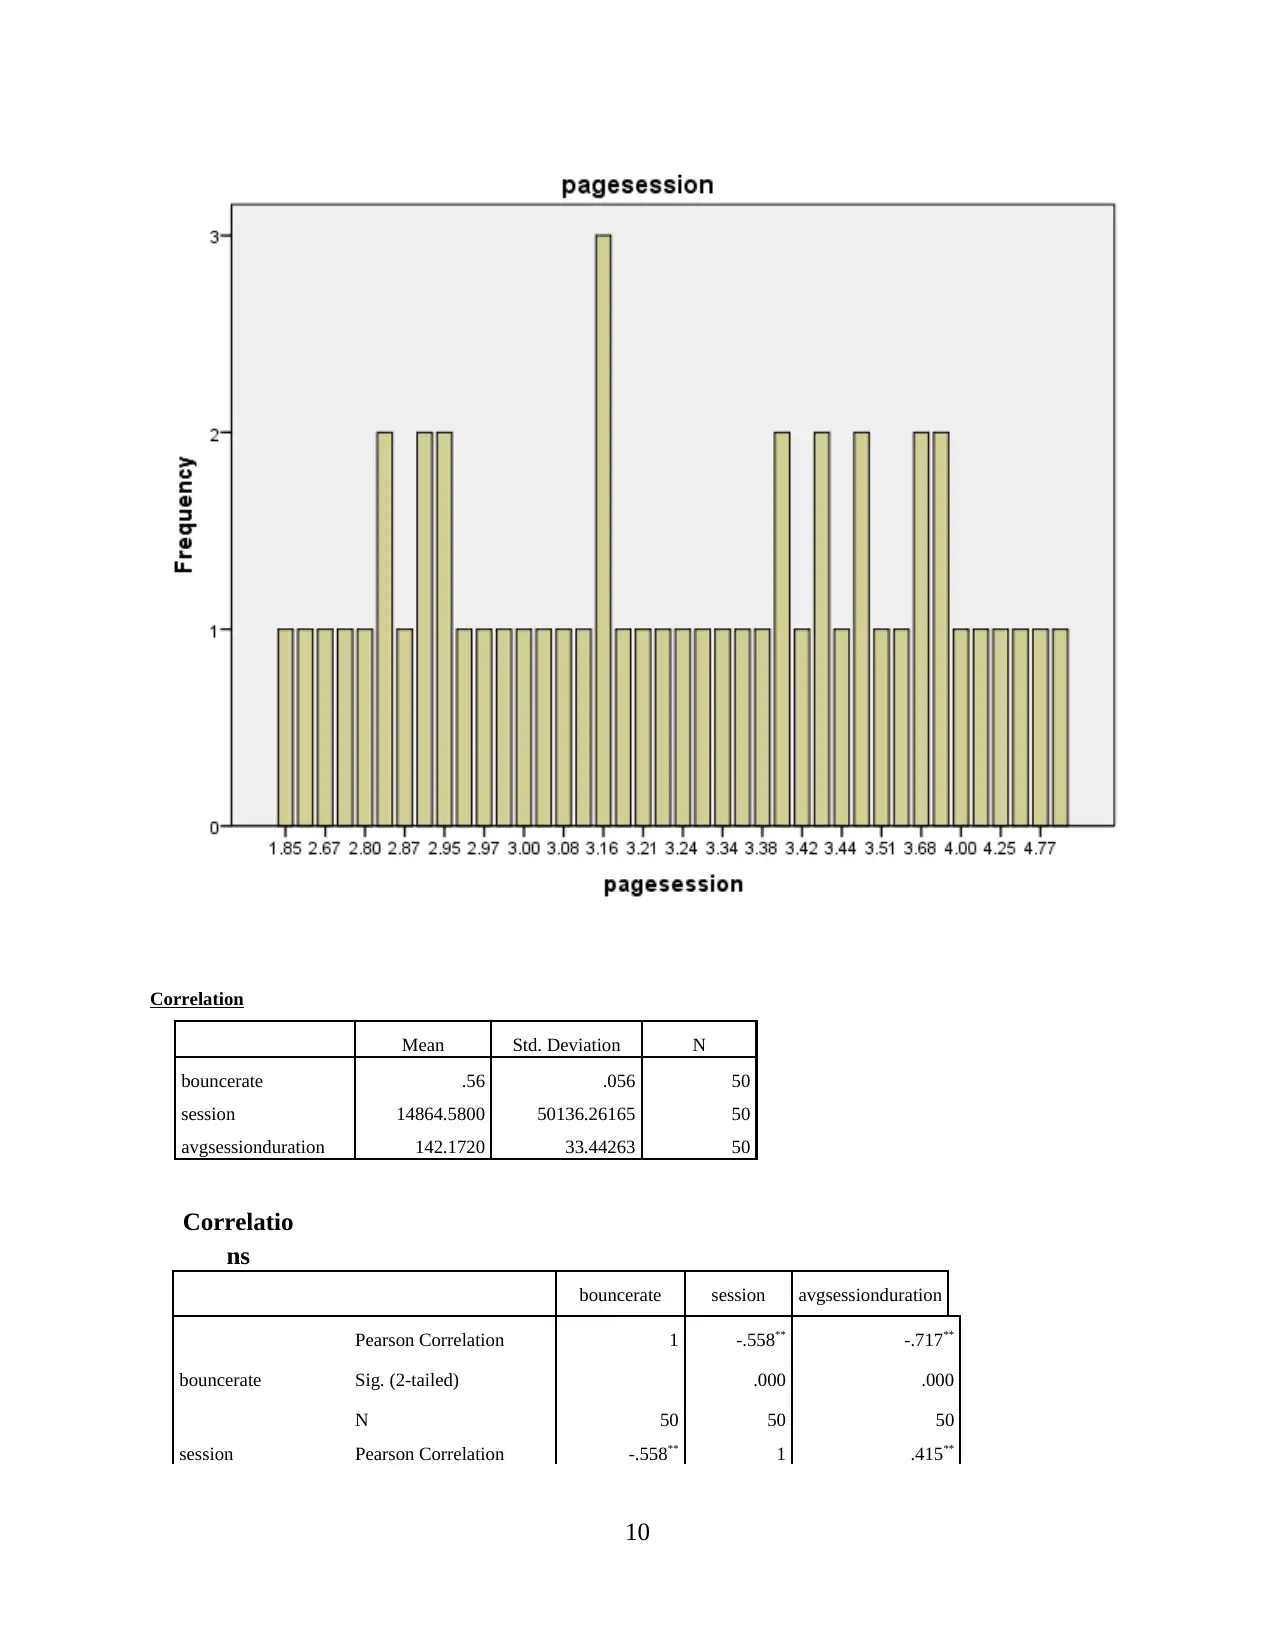
Mean, median and mode values have been known of users, new users, sessions, bounce
rate and page session. On this basis significant deviation relation can be known in bounce rate.
So, mean, median and mode values of users is: 10671.90, 3154.50 and 3308.35. whereas, mean,
median and mode values of new users is: 10500.10, 3077.50 and 32606.10. Mean refers average
value, mode shows middle or 50 % of value. Other than this session's mean or average value is:
14864.58, median is: 4169.50 and mode is: 50136.26. Other variable that has been taken also has
8
all these values and as per this, bounce rate has 0.56 average value, median has: 0.56 and
standard deviation or number from which it can be deviated is 0.056. So, on this basis it can be
said that from the mean value, there is significant deviation in bounce rate (Silva and et.al.,
2019).
From next table also, mean, median and mode values have been known in order to
identify revenue of different countries and their effectiveness in customers' engagement. So,
average value of average session duration is: 142.17, median value is 140.17 with standard
deviation of 33.43. This value can help out in knowing hours spend on merchandise store by
customers. So, ion this basis it can be said that average hours spend by customers on
merchandise store is 142 hours. It is also found that increment in new users is significant in all
different countries. So, on this basis it is found that revenue and traction in all countries are very
low. Transaction variable also has all types of value and average value of this transaction
variable is: 42.14, median is: 1 and standard deviation is 281.73. So, on this basis it can also be
said that from the actual results, average value has significant variant. Revenue also has average
value of 2581.08 with median of 9.71 and standard deviation or value to which it can be deviated
is: 17015.32. So, it also shows and can be stated that there is high deviation in results that got.
On the basis of analysis of data from both tables it can be said that the most effective
country that has or provides the highest revenue as well as transaction is: US. After this country,
Canada and UK comes in the context of effectiveness. So, it can clearly be said that people of all
these countries make the highest and effective use of Google merchandise stores than other
stores. But it can also be suggested that companies of different countries require making their
people aware about ways of making use of new modes in order to recognize brand and
promoting it (Azizi and Hu, 2019). As compared to digital stores and campaign it can be said
that merchandise stores give fewer customers base. So, with digital campaigns, countries can
increase its customers' base 2with more number of users as well as session period.
9
⊘ This is a preview!⊘
Do you want full access?
Subscribe today to unlock all pages.
Trusted by 1+ million students worldwide
Correlation
Mean Std. Deviation N
bouncerate .56 .056 50
session 14864.5800 50136.26165 50
avgsessionduration 142.1720 33.44263 50
Correlatio
ns
bouncerate session avgsessionduration
bouncerate
Pearson Correlation 1 -.558** -.717**
Sig. (2-tailed) .000 .000
N 50 50 50
session Pearson Correlation -.558** 1 .415**
10
Paraphrase This Document
Need a fresh take? Get an instant paraphrase of this document with our AI Paraphraser
Sig. (2-tailed) .000 .003
N 50 50 50
avgsessionduration
Pearson Correlation -.717** .415** 1
Sig. (2-tailed) .000 .003
N 50 50 50
Interpretation
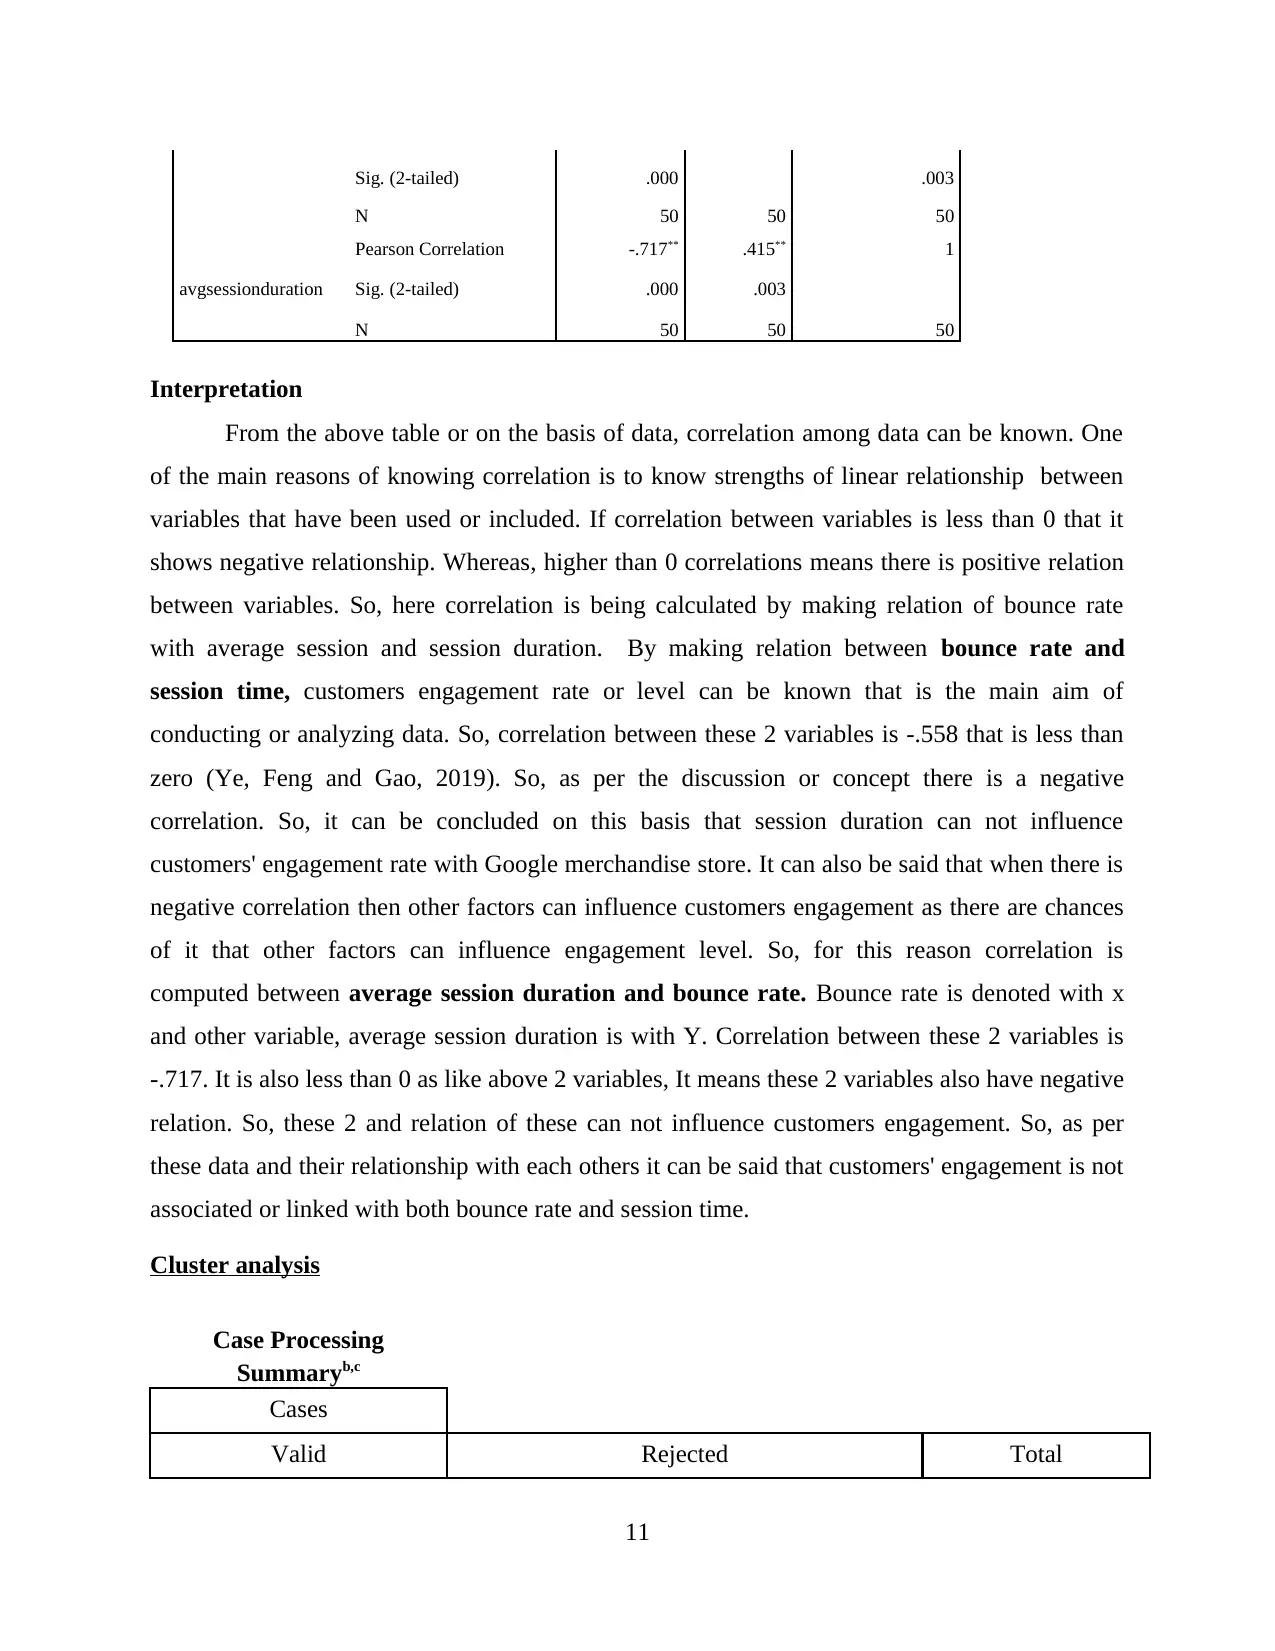
From the above table or on the basis of data, correlation among data can be known. One
of the main reasons of knowing correlation is to know strengths of linear relationship between
variables that have been used or included. If correlation between variables is less than 0 that it
shows negative relationship. Whereas, higher than 0 correlations means there is positive relation
between variables. So, here correlation is being calculated by making relation of bounce rate
with average session and session duration. By making relation between bounce rate and
session time, customers engagement rate or level can be known that is the main aim of
conducting or analyzing data. So, correlation between these 2 variables is -.558 that is less than
zero (Ye, Feng and Gao, 2019). So, as per the discussion or concept there is a negative
correlation. So, it can be concluded on this basis that session duration can not influence
customers' engagement rate with Google merchandise store. It can also be said that when there is
negative correlation then other factors can influence customers engagement as there are chances
of it that other factors can influence engagement level. So, for this reason correlation is
computed between average session duration and bounce rate. Bounce rate is denoted with x
and other variable, average session duration is with Y. Correlation between these 2 variables is
-.717. It is also less than 0 as like above 2 variables, It means these 2 variables also have negative
relation. So, these 2 and relation of these can not influence customers engagement. So, as per
these data and their relationship with each others it can be said that customers' engagement is not
associated or linked with both bounce rate and session time.
Cluster analysis
Case Processing
Summaryb,c
Cases
Valid Rejected Total
11
N 50 50 50
avgsessionduration
Pearson Correlation -.717** .415** 1
Sig. (2-tailed) .000 .003
N 50 50 50
Interpretation
From the above table or on the basis of data, correlation among data can be known. One
of the main reasons of knowing correlation is to know strengths of linear relationship between
variables that have been used or included. If correlation between variables is less than 0 that it
shows negative relationship. Whereas, higher than 0 correlations means there is positive relation
between variables. So, here correlation is being calculated by making relation of bounce rate
with average session and session duration. By making relation between bounce rate and
session time, customers engagement rate or level can be known that is the main aim of
conducting or analyzing data. So, correlation between these 2 variables is -.558 that is less than
zero (Ye, Feng and Gao, 2019). So, as per the discussion or concept there is a negative
correlation. So, it can be concluded on this basis that session duration can not influence
customers' engagement rate with Google merchandise store. It can also be said that when there is
negative correlation then other factors can influence customers engagement as there are chances
of it that other factors can influence engagement level. So, for this reason correlation is
computed between average session duration and bounce rate. Bounce rate is denoted with x
and other variable, average session duration is with Y. Correlation between these 2 variables is
-.717. It is also less than 0 as like above 2 variables, It means these 2 variables also have negative
relation. So, these 2 and relation of these can not influence customers engagement. So, as per
these data and their relationship with each others it can be said that customers' engagement is not
associated or linked with both bounce rate and session time.
Cluster analysis
Case Processing
Summaryb,c
Cases
Valid Rejected Total
11
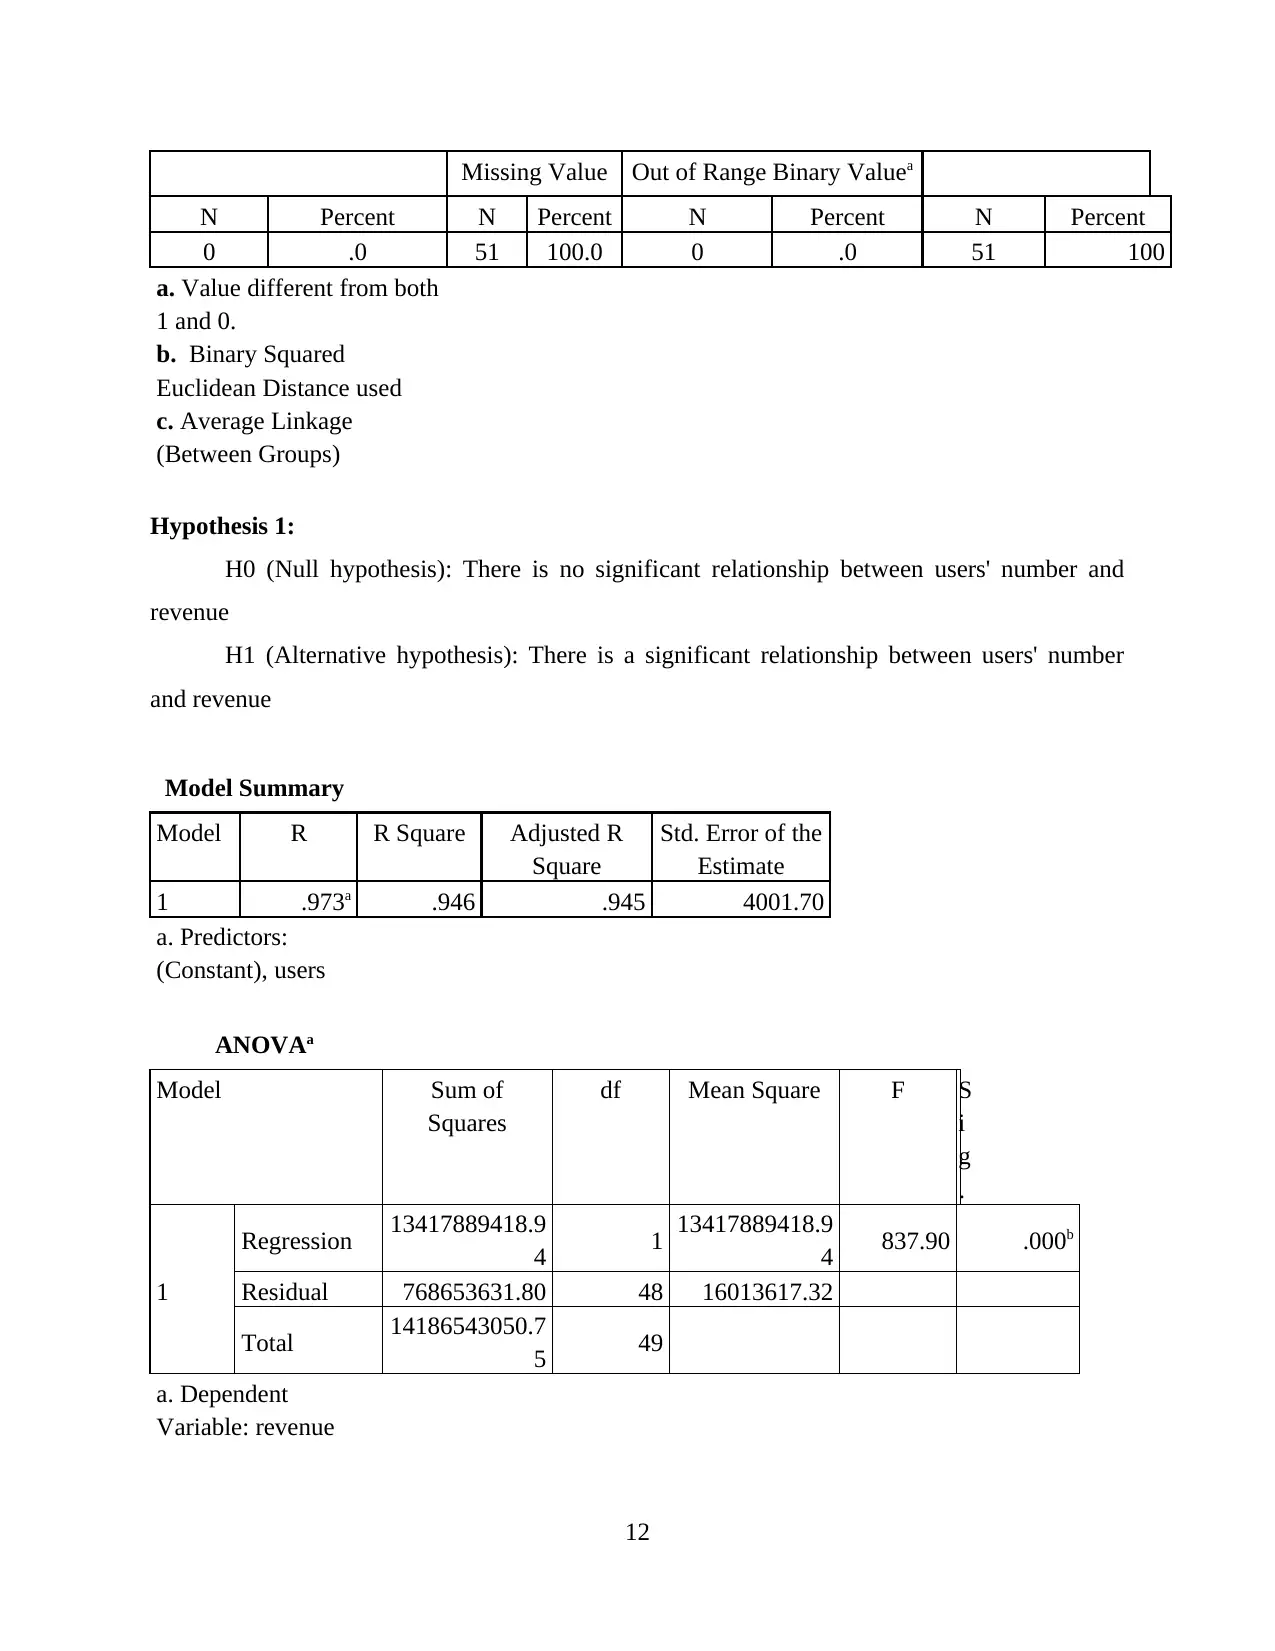
Missing Value Out of Range Binary Valuea
N Percent N Percent N Percent N Percent
0 .0 51 100.0 0 .0 51 100
a. Value different from both
1 and 0.
b. Binary Squared
Euclidean Distance used
c. Average Linkage
(Between Groups)
Hypothesis 1:
H0 (Null hypothesis): There is no significant relationship between users' number and
revenue
H1 (Alternative hypothesis): There is a significant relationship between users' number
and revenue
Model Summary
Model R R Square Adjusted R
Square
Std. Error of the
Estimate
1 .973a .946 .945 4001.70
a. Predictors:
(Constant), users
ANOVAa
Model Sum of
Squares
df Mean Square F S
i
g
.
1
Regression 13417889418.9
4 1 13417889418.9
4 837.90 .000b
Residual 768653631.80 48 16013617.32
Total 14186543050.7
5 49
a. Dependent
Variable: revenue
12
⊘ This is a preview!⊘
Do you want full access?
Subscribe today to unlock all pages.
Trusted by 1+ million students worldwide
1 out of 18

Your All-in-One AI-Powered Toolkit for Academic Success.
+13062052269
info@desklib.com
Available 24*7 on WhatsApp / Email
![[object Object]](/_next/static/media/star-bottom.7253800d.svg)
Unlock your academic potential
Copyright © 2020–2026 A2Z Services. All Rights Reserved. Developed and managed by ZUCOL.