Marketing Assignment: Google Ads, PPC, and Freemium Conversions
VerifiedAdded on 2023/01/19
|11
|3549
|83
Homework Assignment
AI Summary
This assignment delves into various aspects of digital marketing, encompassing the 3C framework (Connect, Continuously Engage, Convert), website metrics analysis, and Google Ads campaign optimization. The student analyzes a website using the 3C framework, identifies areas for improvement, and evaluates campaign performance based on metrics such as CTR and CVR. The assignment also explores the Google Ads bidding model, including ad rank calculation and strategies to improve ad positioning. Furthermore, it examines the freemium conversion model, calculating break-even points and profit margins based on user conversion rates. The student provides recommendations for enhancing website performance and optimizing marketing strategies across different scenarios.
[individual assignmet]
1
2019
Author Name:
University Name:
1
2019
Author Name:
University Name:
Paraphrase This Document
Need a fresh take? Get an instant paraphrase of this document with our AI Paraphraser
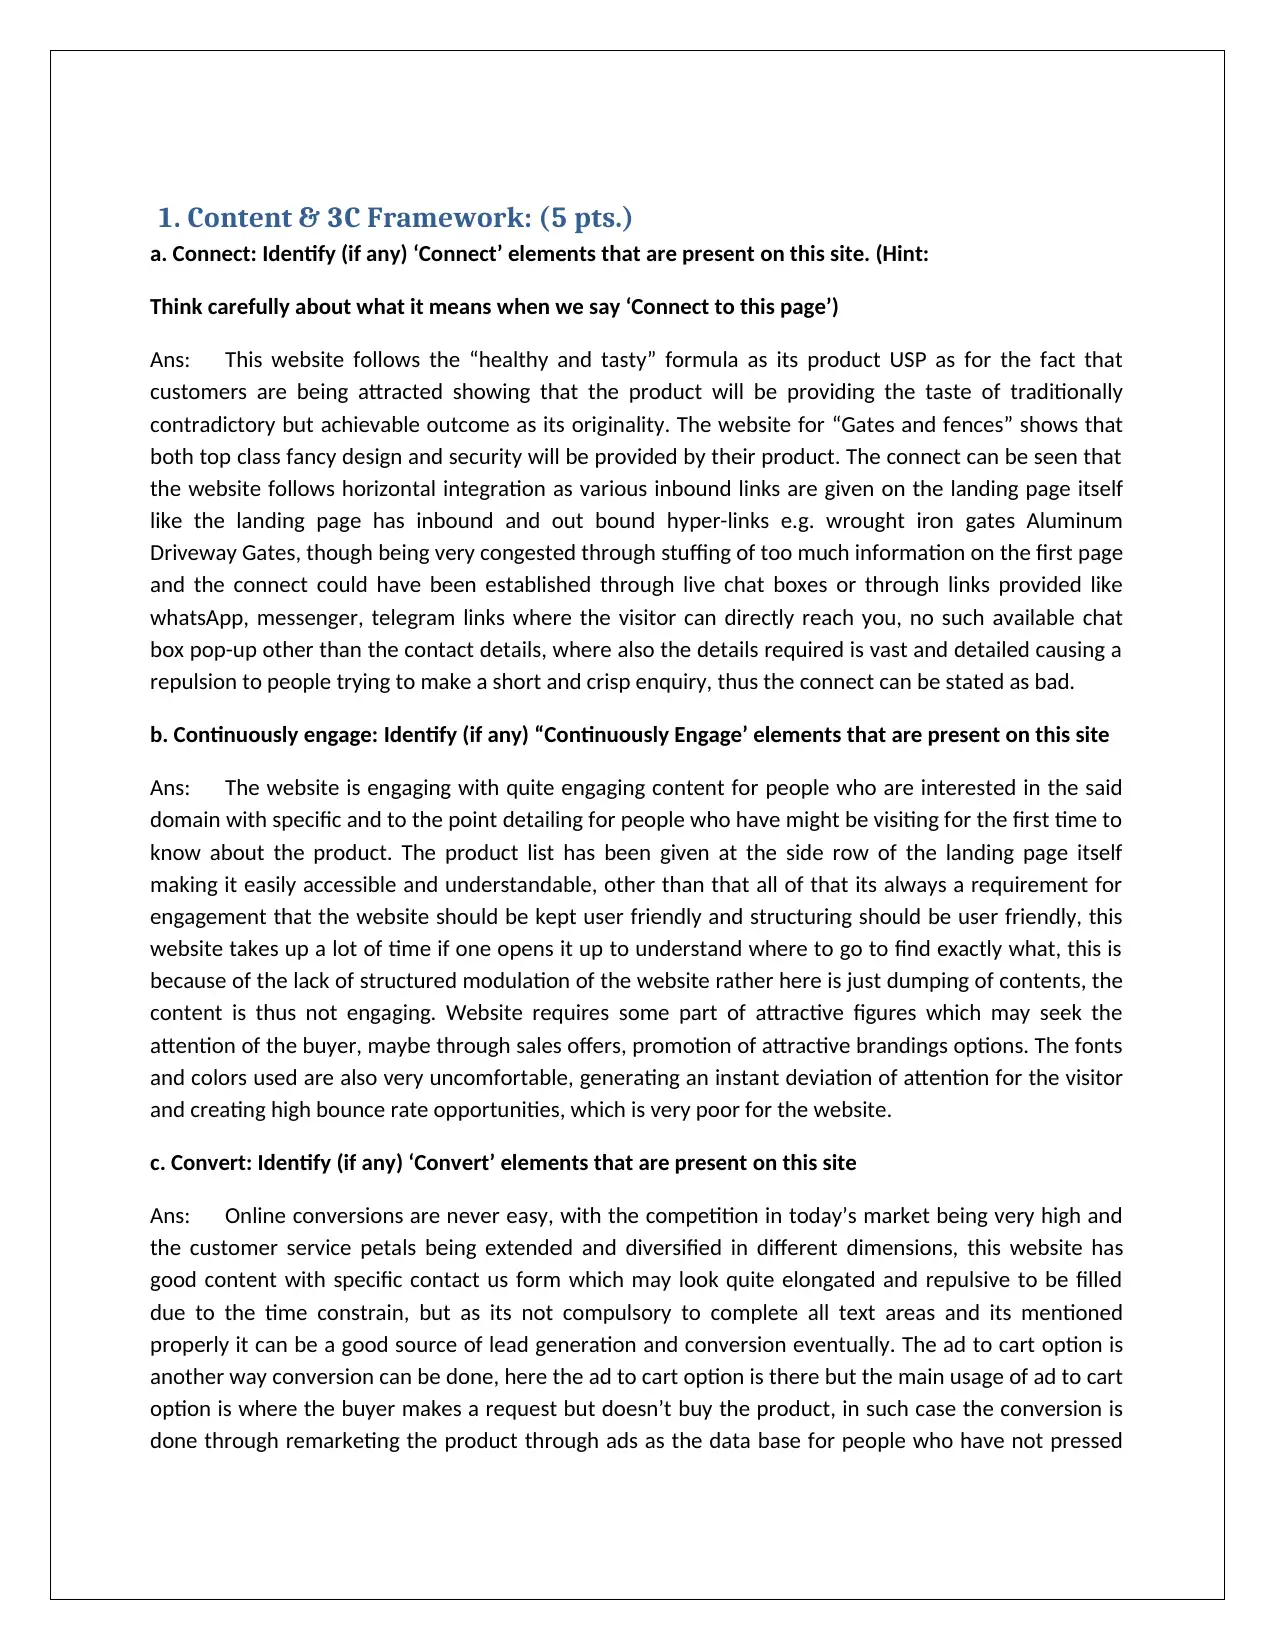
1. Content & 3C Framework: (5 pts.)
a. Connect: Identify (if any) ‘Connect’ elements that are present on this site. (Hint:
Think carefully about what it means when we say ‘Connect to this page’)
Ans: This website follows the “healthy and tasty” formula as its product USP as for the fact that
customers are being attracted showing that the product will be providing the taste of traditionally
contradictory but achievable outcome as its originality. The website for “Gates and fences” shows that
both top class fancy design and security will be provided by their product. The connect can be seen that
the website follows horizontal integration as various inbound links are given on the landing page itself
like the landing page has inbound and out bound hyper-links e.g. wrought iron gates Aluminum
Driveway Gates, though being very congested through stuffing of too much information on the first page
and the connect could have been established through live chat boxes or through links provided like
whatsApp, messenger, telegram links where the visitor can directly reach you, no such available chat
box pop-up other than the contact details, where also the details required is vast and detailed causing a
repulsion to people trying to make a short and crisp enquiry, thus the connect can be stated as bad.
b. Continuously engage: Identify (if any) “Continuously Engage’ elements that are present on this site
Ans: The website is engaging with quite engaging content for people who are interested in the said
domain with specific and to the point detailing for people who have might be visiting for the first time to
know about the product. The product list has been given at the side row of the landing page itself
making it easily accessible and understandable, other than that all of that its always a requirement for
engagement that the website should be kept user friendly and structuring should be user friendly, this
website takes up a lot of time if one opens it up to understand where to go to find exactly what, this is
because of the lack of structured modulation of the website rather here is just dumping of contents, the
content is thus not engaging. Website requires some part of attractive figures which may seek the
attention of the buyer, maybe through sales offers, promotion of attractive brandings options. The fonts
and colors used are also very uncomfortable, generating an instant deviation of attention for the visitor
and creating high bounce rate opportunities, which is very poor for the website.
c. Convert: Identify (if any) ‘Convert’ elements that are present on this site
Ans: Online conversions are never easy, with the competition in today’s market being very high and
the customer service petals being extended and diversified in different dimensions, this website has
good content with specific contact us form which may look quite elongated and repulsive to be filled
due to the time constrain, but as its not compulsory to complete all text areas and its mentioned
properly it can be a good source of lead generation and conversion eventually. The ad to cart option is
another way conversion can be done, here the ad to cart option is there but the main usage of ad to cart
option is where the buyer makes a request but doesn’t buy the product, in such case the conversion is
done through remarketing the product through ads as the data base for people who have not pressed
the buy option even after adding to cart are the most likely ones to buy it if a little bit of induced
marketing can be done, no such cookie or induction marketing was cited in this website .
d. What (if any) content on this site is user generated?
Ans: User generated contents are mostly found in social media platforms where the users share and
upload usable content, user generated contents are very common these days with the popular websites
where the user is being allowed to post contents and those contents are first sent to the admin for
approval and when if accepted the contents get posted, thus creating great engagements, no such user
generated contents were located here.
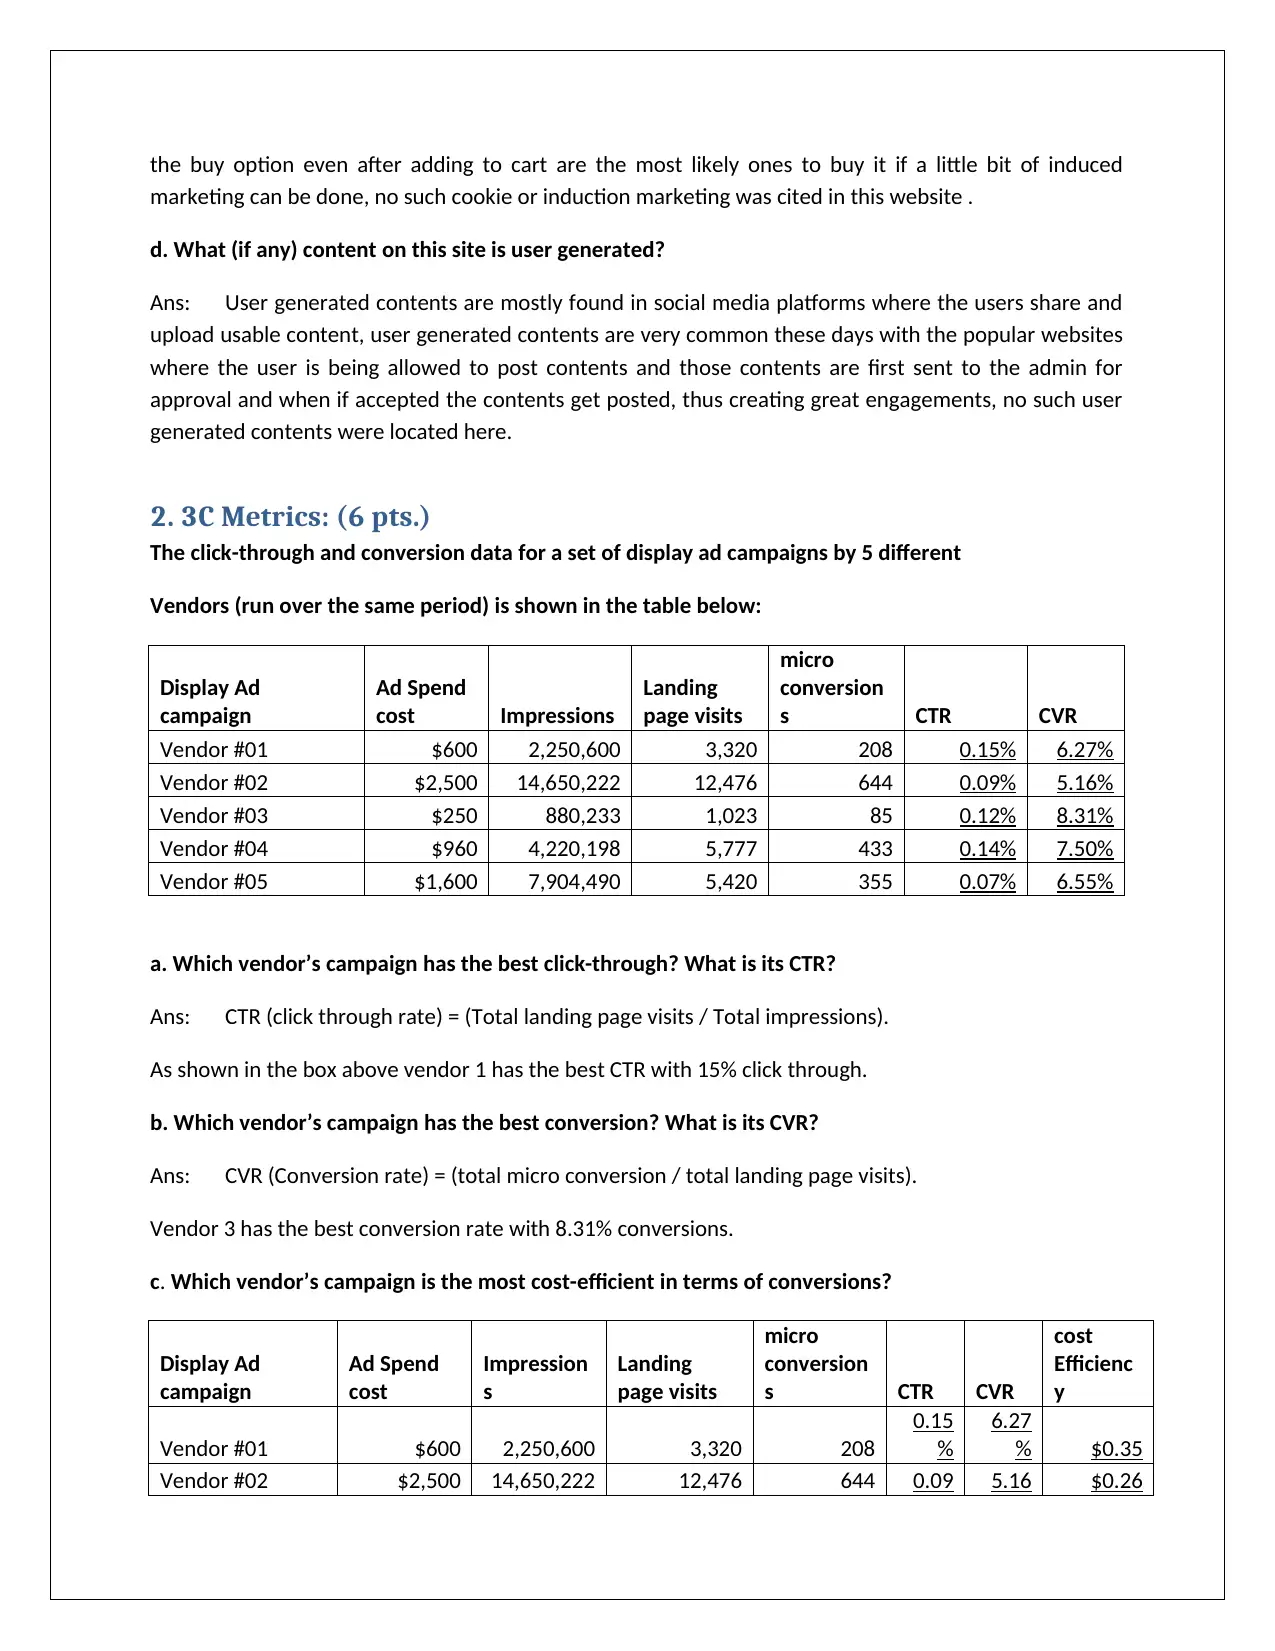
2. 3C Metrics: (6 pts.)
The click-through and conversion data for a set of display ad campaigns by 5 different
Vendors (run over the same period) is shown in the table below:
Display Ad
campaign
Ad Spend
cost Impressions
Landing
page visits
micro
conversion
s CTR CVR
Vendor #01 $600 2,250,600 3,320 208 0.15% 6.27%
Vendor #02 $2,500 14,650,222 12,476 644 0.09% 5.16%
Vendor #03 $250 880,233 1,023 85 0.12% 8.31%
Vendor #04 $960 4,220,198 5,777 433 0.14% 7.50%
Vendor #05 $1,600 7,904,490 5,420 355 0.07% 6.55%
a. Which vendor’s campaign has the best click-through? What is its CTR?
Ans: CTR (click through rate) = (Total landing page visits / Total impressions).
As shown in the box above vendor 1 has the best CTR with 15% click through.
b. Which vendor’s campaign has the best conversion? What is its CVR?
Ans: CVR (Conversion rate) = (total micro conversion / total landing page visits).
Vendor 3 has the best conversion rate with 8.31% conversions.
c. Which vendor’s campaign is the most cost-efficient in terms of conversions?
Display Ad
campaign
Ad Spend
cost
Impression
s
Landing
page visits
micro
conversion
s CTR CVR
cost
Efficienc
y
Vendor #01 $600 2,250,600 3,320 208
0.15
%
6.27
% $0.35
Vendor #02 $2,500 14,650,222 12,476 644 0.09 5.16 $0.26
marketing can be done, no such cookie or induction marketing was cited in this website .
d. What (if any) content on this site is user generated?
Ans: User generated contents are mostly found in social media platforms where the users share and
upload usable content, user generated contents are very common these days with the popular websites
where the user is being allowed to post contents and those contents are first sent to the admin for
approval and when if accepted the contents get posted, thus creating great engagements, no such user
generated contents were located here.
2. 3C Metrics: (6 pts.)
The click-through and conversion data for a set of display ad campaigns by 5 different
Vendors (run over the same period) is shown in the table below:
Display Ad
campaign
Ad Spend
cost Impressions
Landing
page visits
micro
conversion
s CTR CVR
Vendor #01 $600 2,250,600 3,320 208 0.15% 6.27%
Vendor #02 $2,500 14,650,222 12,476 644 0.09% 5.16%
Vendor #03 $250 880,233 1,023 85 0.12% 8.31%
Vendor #04 $960 4,220,198 5,777 433 0.14% 7.50%
Vendor #05 $1,600 7,904,490 5,420 355 0.07% 6.55%
a. Which vendor’s campaign has the best click-through? What is its CTR?
Ans: CTR (click through rate) = (Total landing page visits / Total impressions).
As shown in the box above vendor 1 has the best CTR with 15% click through.
b. Which vendor’s campaign has the best conversion? What is its CVR?
Ans: CVR (Conversion rate) = (total micro conversion / total landing page visits).
Vendor 3 has the best conversion rate with 8.31% conversions.
c. Which vendor’s campaign is the most cost-efficient in terms of conversions?
Display Ad
campaign
Ad Spend
cost
Impression
s
Landing
page visits
micro
conversion
s CTR CVR
cost
Efficienc
y
Vendor #01 $600 2,250,600 3,320 208
0.15
%
6.27
% $0.35
Vendor #02 $2,500 14,650,222 12,476 644 0.09 5.16 $0.26
⊘ This is a preview!⊘
Do you want full access?
Subscribe today to unlock all pages.
Trusted by 1+ million students worldwide
% %
Vendor #03 $250 880,233 1,023 85
0.12
%
8.31
% $0.34
Vendor #04 $960 4,220,198 5,777 433
0.14
%
7.50
% $0.45
Vendor #05 $1,600 7,904,490 5,420 355
0.07
%
6.55
% $0.22
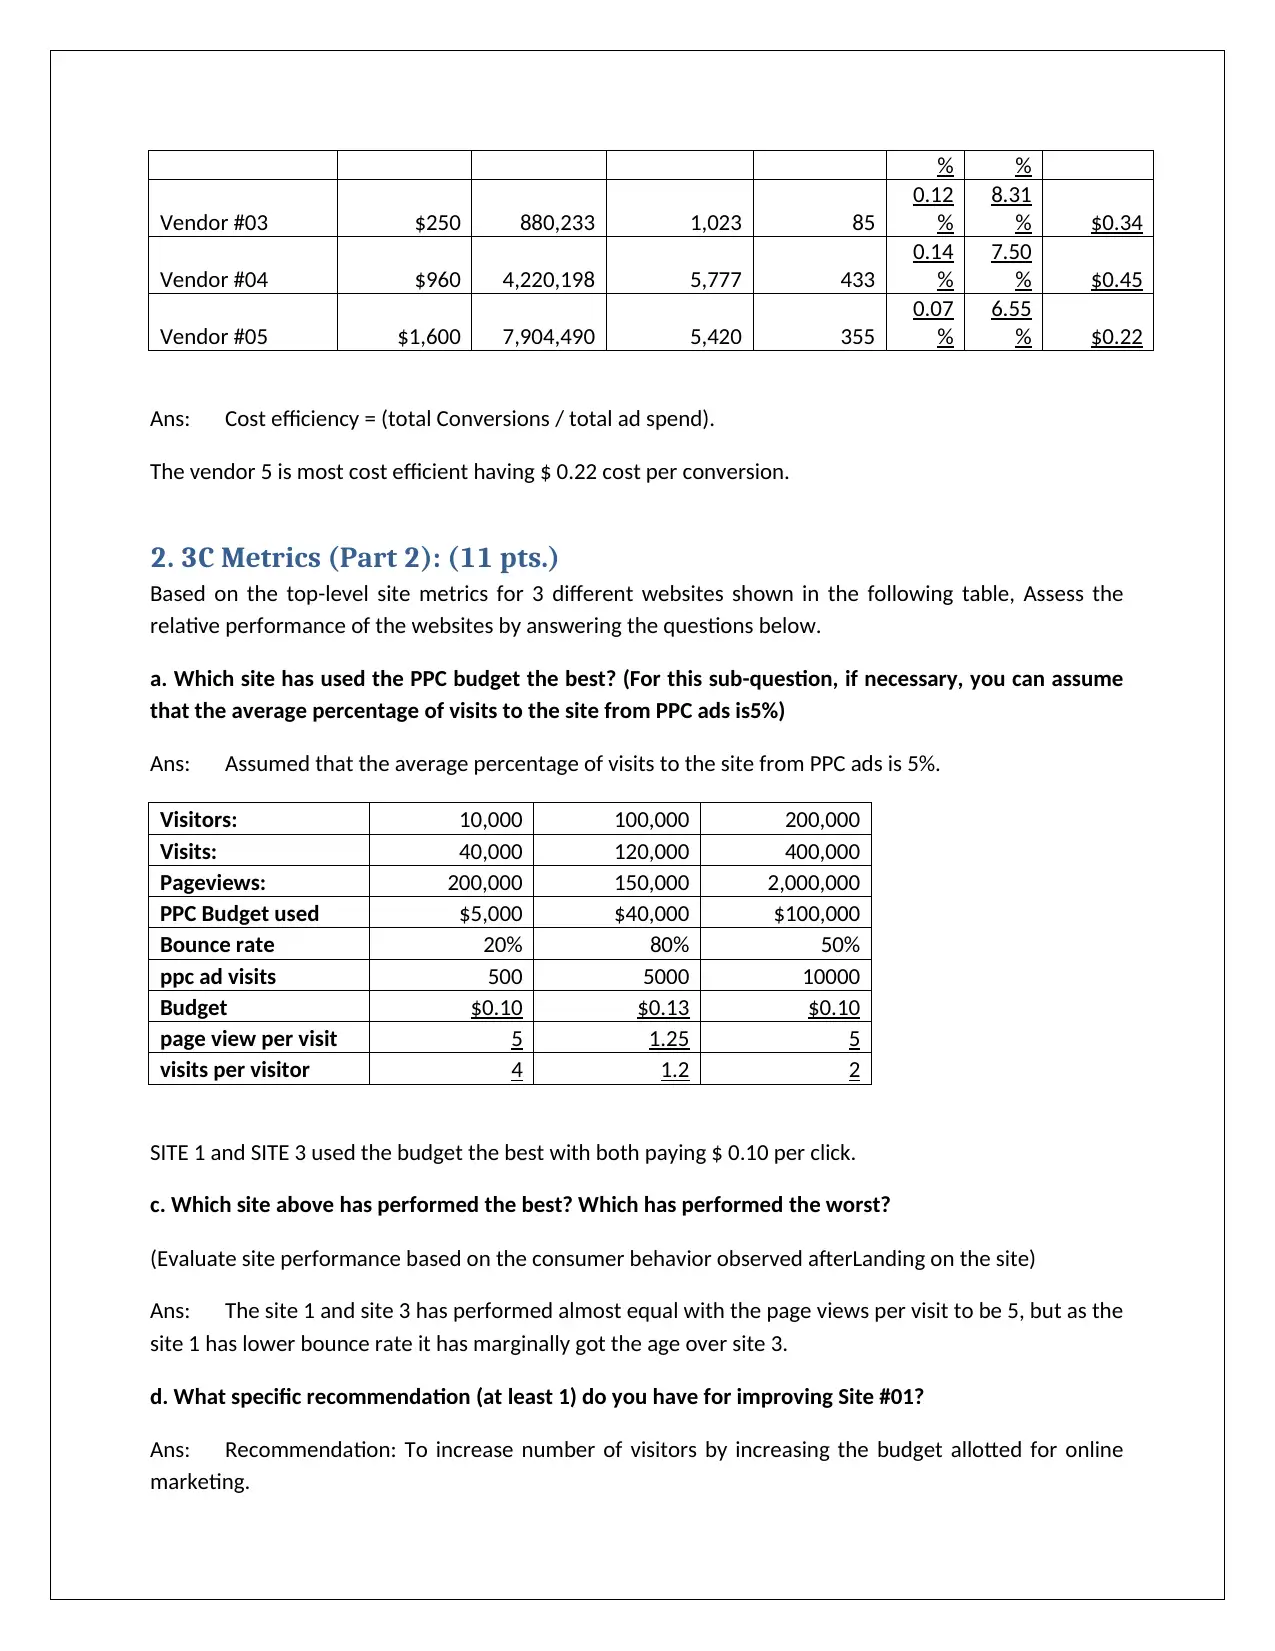
Ans: Cost efficiency = (total Conversions / total ad spend).
The vendor 5 is most cost efficient having $ 0.22 cost per conversion.
2. 3C Metrics (Part 2): (11 pts.)
Based on the top-level site metrics for 3 different websites shown in the following table, Assess the
relative performance of the websites by answering the questions below.
a. Which site has used the PPC budget the best? (For this sub-question, if necessary, you can assume
that the average percentage of visits to the site from PPC ads is5%)
Ans: Assumed that the average percentage of visits to the site from PPC ads is 5%.
Visitors: 10,000 100,000 200,000
Visits: 40,000 120,000 400,000
Pageviews: 200,000 150,000 2,000,000
PPC Budget used $5,000 $40,000 $100,000
Bounce rate 20% 80% 50%
ppc ad visits 500 5000 10000
Budget $0.10 $0.13 $0.10
page view per visit 5 1.25 5
visits per visitor 4 1.2 2
SITE 1 and SITE 3 used the budget the best with both paying $ 0.10 per click.
c. Which site above has performed the best? Which has performed the worst?
(Evaluate site performance based on the consumer behavior observed afterLanding on the site)
Ans: The site 1 and site 3 has performed almost equal with the page views per visit to be 5, but as the
site 1 has lower bounce rate it has marginally got the age over site 3.
d. What specific recommendation (at least 1) do you have for improving Site #01?
Ans: Recommendation: To increase number of visitors by increasing the budget allotted for online
marketing.
Vendor #03 $250 880,233 1,023 85
0.12
%
8.31
% $0.34
Vendor #04 $960 4,220,198 5,777 433
0.14
%
7.50
% $0.45
Vendor #05 $1,600 7,904,490 5,420 355
0.07
%
6.55
% $0.22
Ans: Cost efficiency = (total Conversions / total ad spend).
The vendor 5 is most cost efficient having $ 0.22 cost per conversion.
2. 3C Metrics (Part 2): (11 pts.)
Based on the top-level site metrics for 3 different websites shown in the following table, Assess the
relative performance of the websites by answering the questions below.
a. Which site has used the PPC budget the best? (For this sub-question, if necessary, you can assume
that the average percentage of visits to the site from PPC ads is5%)
Ans: Assumed that the average percentage of visits to the site from PPC ads is 5%.
Visitors: 10,000 100,000 200,000
Visits: 40,000 120,000 400,000
Pageviews: 200,000 150,000 2,000,000
PPC Budget used $5,000 $40,000 $100,000
Bounce rate 20% 80% 50%
ppc ad visits 500 5000 10000
Budget $0.10 $0.13 $0.10
page view per visit 5 1.25 5
visits per visitor 4 1.2 2
SITE 1 and SITE 3 used the budget the best with both paying $ 0.10 per click.
c. Which site above has performed the best? Which has performed the worst?
(Evaluate site performance based on the consumer behavior observed afterLanding on the site)
Ans: The site 1 and site 3 has performed almost equal with the page views per visit to be 5, but as the
site 1 has lower bounce rate it has marginally got the age over site 3.
d. What specific recommendation (at least 1) do you have for improving Site #01?
Ans: Recommendation: To increase number of visitors by increasing the budget allotted for online
marketing.
Paraphrase This Document
Need a fresh take? Get an instant paraphrase of this document with our AI Paraphraser
e. What specific recommendations (at least 2) do you have for improving Site #02?
Ans: Recommendation 1: To have more engaging and illustrative content so that the bounce rate
goes down, maybe hire good content writers.
Recommendation 2: The bidding strategy used to allot budget per click can be more cost
efficient more planned approach towards the bidding price strategy should be done.
f. What specific recommendations (at least 2) do you have for improving Site #03?
Ans: Recommendation 1: To have more engaging content so that the bounce rate can be reduced.
Recommendation 2: The page view per visitor is also low thus we can understand it has not been able
to create that connect with the visitors.
3 & 4. Google Ads & PPC: (20 pts.)
Ans: Assume that you are in charge of the overall e-commerce success of BigSkinny. You are bidding
in a Google Ads campaign on Google for the keyword 'skinny wallet’, against 5 competitors - Allett,
Bellroy, Dash, Fossil, and Slimfold. Assume that for a particular search query by a user, Google Ads
determines that all 6 vendors (you and your 5 competitors above) will be in the auction. The max bid
presented by each vendor is shown below, along with Google's quality score for each vendor.
Based on the simplified Google Ads bidding model that we discussed in class:
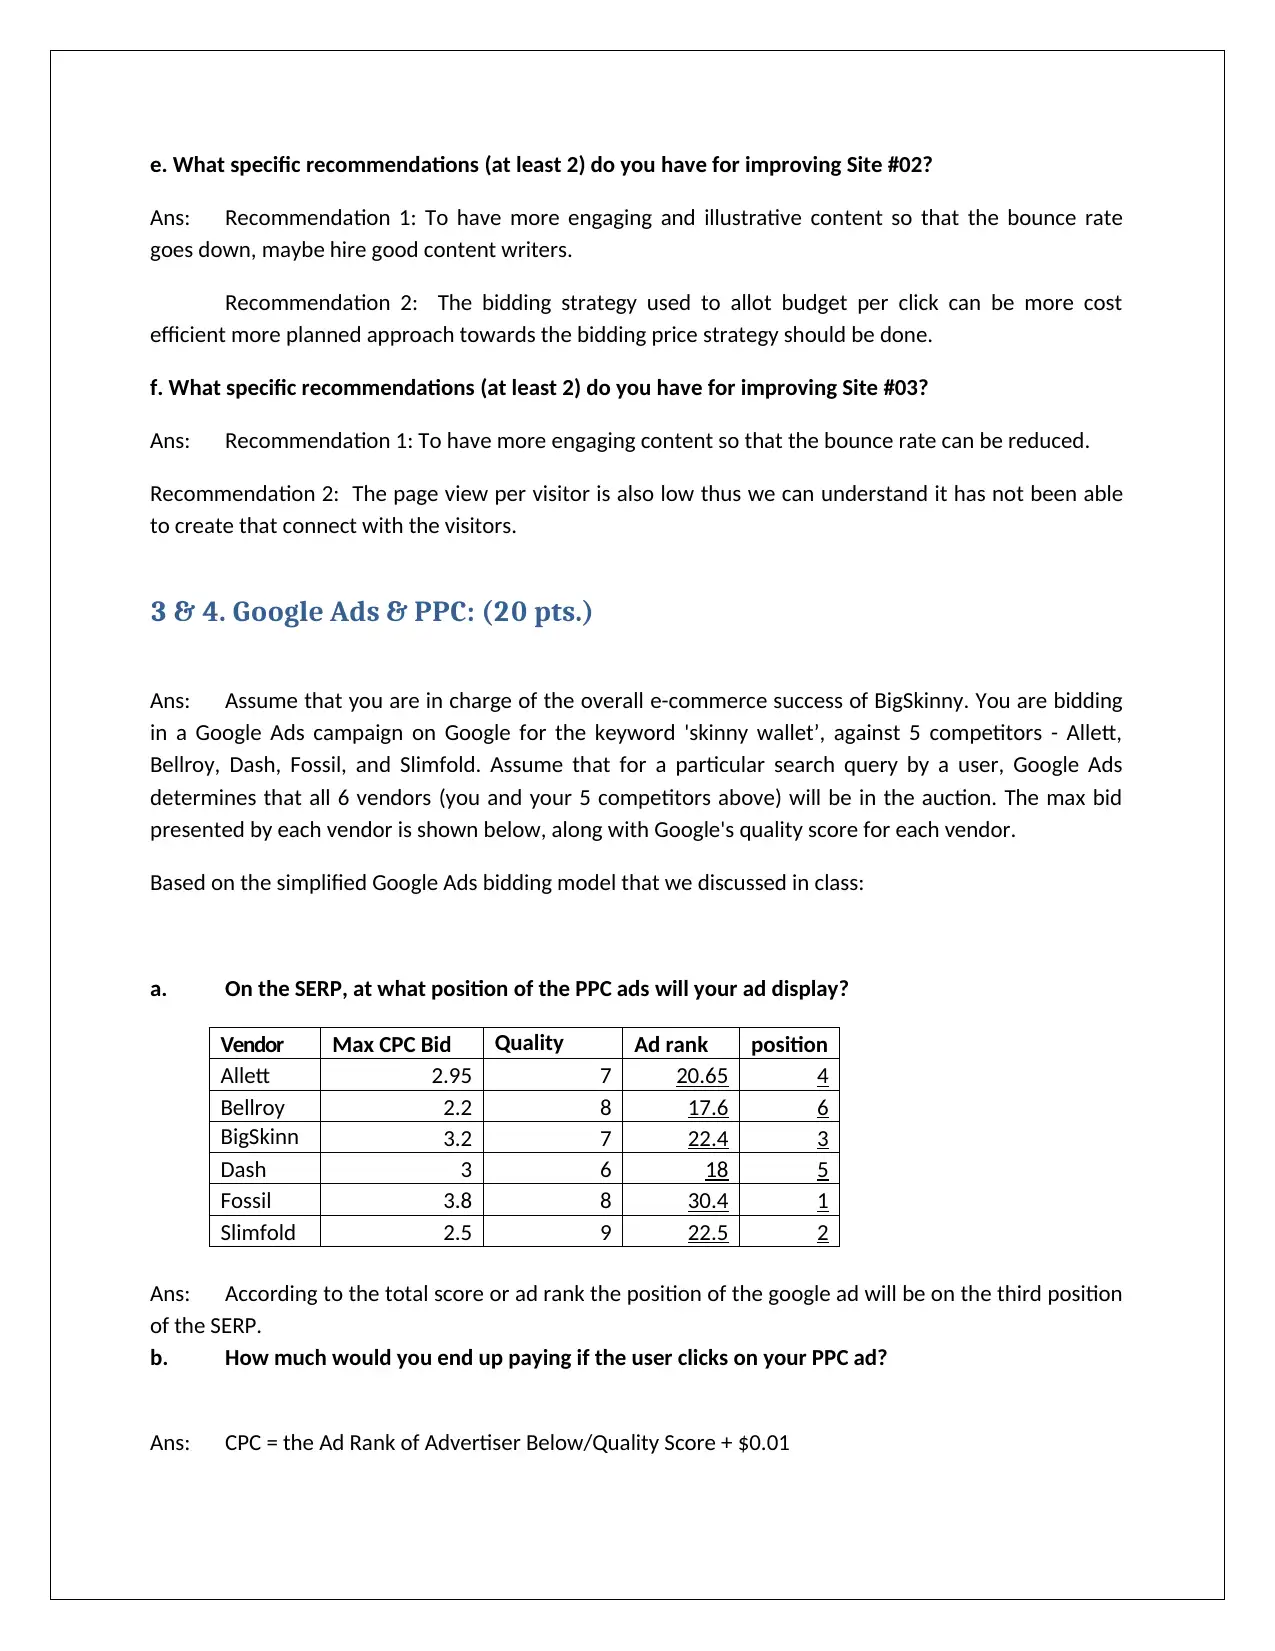
a. On the SERP, at what position of the PPC ads will your ad display?
Vendor Max CPC Bid Quality
Score
Ad rank position
Allett 2.95 7 20.65 4
Bellroy 2.2 8 17.6 6
BigSkinn
y
3.2 7 22.4 3
Dash 3 6 18 5
Fossil 3.8 8 30.4 1
Slimfold 2.5 9 22.5 2
Ans: According to the total score or ad rank the position of the google ad will be on the third position
of the SERP.
b. How much would you end up paying if the user clicks on your PPC ad?
Ans: CPC = the Ad Rank of Advertiser Below/Quality Score + $0.01
Ans: Recommendation 1: To have more engaging and illustrative content so that the bounce rate
goes down, maybe hire good content writers.
Recommendation 2: The bidding strategy used to allot budget per click can be more cost
efficient more planned approach towards the bidding price strategy should be done.
f. What specific recommendations (at least 2) do you have for improving Site #03?
Ans: Recommendation 1: To have more engaging content so that the bounce rate can be reduced.
Recommendation 2: The page view per visitor is also low thus we can understand it has not been able
to create that connect with the visitors.
3 & 4. Google Ads & PPC: (20 pts.)
Ans: Assume that you are in charge of the overall e-commerce success of BigSkinny. You are bidding
in a Google Ads campaign on Google for the keyword 'skinny wallet’, against 5 competitors - Allett,
Bellroy, Dash, Fossil, and Slimfold. Assume that for a particular search query by a user, Google Ads
determines that all 6 vendors (you and your 5 competitors above) will be in the auction. The max bid
presented by each vendor is shown below, along with Google's quality score for each vendor.
Based on the simplified Google Ads bidding model that we discussed in class:
a. On the SERP, at what position of the PPC ads will your ad display?
Vendor Max CPC Bid Quality
Score
Ad rank position
Allett 2.95 7 20.65 4
Bellroy 2.2 8 17.6 6
BigSkinn
y
3.2 7 22.4 3
Dash 3 6 18 5
Fossil 3.8 8 30.4 1
Slimfold 2.5 9 22.5 2
Ans: According to the total score or ad rank the position of the google ad will be on the third position
of the SERP.
b. How much would you end up paying if the user clicks on your PPC ad?
Ans: CPC = the Ad Rank of Advertiser Below/Quality Score + $0.01
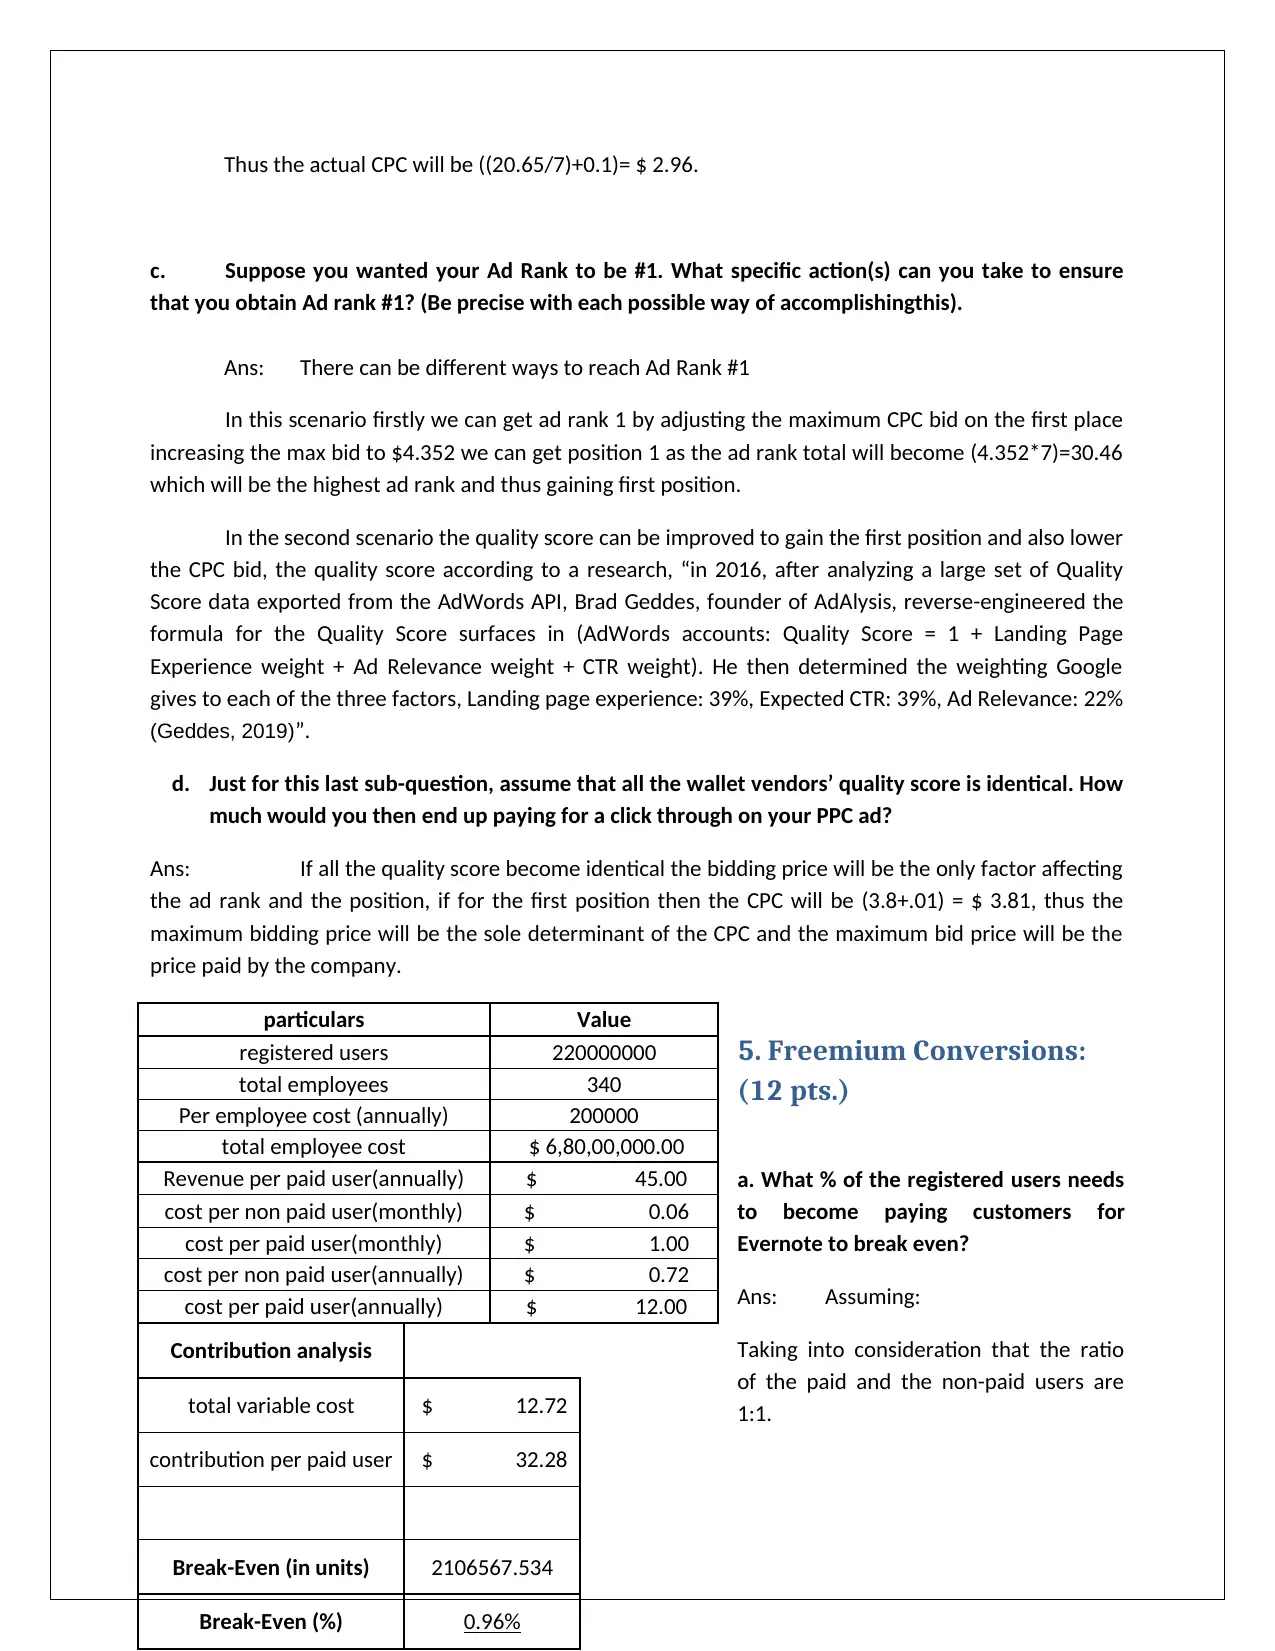
Thus the actual CPC will be ((20.65/7)+0.1)= $ 2.96.
c. Suppose you wanted your Ad Rank to be #1. What specific action(s) can you take to ensure
that you obtain Ad rank #1? (Be precise with each possible way of accomplishingthis).
Ans: There can be different ways to reach Ad Rank #1
In this scenario firstly we can get ad rank 1 by adjusting the maximum CPC bid on the first place
increasing the max bid to $4.352 we can get position 1 as the ad rank total will become (4.352*7)=30.46
which will be the highest ad rank and thus gaining first position.
In the second scenario the quality score can be improved to gain the first position and also lower
the CPC bid, the quality score according to a research, “in 2016, after analyzing a large set of Quality
Score data exported from the AdWords API, Brad Geddes, founder of AdAlysis, reverse-engineered the
formula for the Quality Score surfaces in (AdWords accounts: Quality Score = 1 + Landing Page
Experience weight + Ad Relevance weight + CTR weight). He then determined the weighting Google
gives to each of the three factors, Landing page experience: 39%, Expected CTR: 39%, Ad Relevance: 22%
(Geddes, 2019)”.
d. Just for this last sub-question, assume that all the wallet vendors’ quality score is identical. How
much would you then end up paying for a click through on your PPC ad?
Ans: If all the quality score become identical the bidding price will be the only factor affecting
the ad rank and the position, if for the first position then the CPC will be (3.8+.01) = $ 3.81, thus the
maximum bidding price will be the sole determinant of the CPC and the maximum bid price will be the
price paid by the company.
5. Freemium Conversions:
(12 pts.)
a. What % of the registered users needs
to become paying customers for
Evernote to break even?
Ans: Assuming:
Taking into consideration that the ratio
of the paid and the non-paid users are
1:1.
particulars Value
registered users 220000000
total employees 340
Per employee cost (annually) 200000
total employee cost $ 6,80,00,000.00
Revenue per paid user(annually) $ 45.00
cost per non paid user(monthly) $ 0.06
cost per paid user(monthly) $ 1.00
cost per non paid user(annually) $ 0.72
cost per paid user(annually) $ 12.00
Contribution analysis
total variable cost $ 12.72
contribution per paid user $ 32.28
Break-Even (in units) 2106567.534
Break-Even (%) 0.96%
⊘ This is a preview!⊘
Do you want full access?
Subscribe today to unlock all pages.
Trusted by 1+ million students worldwide
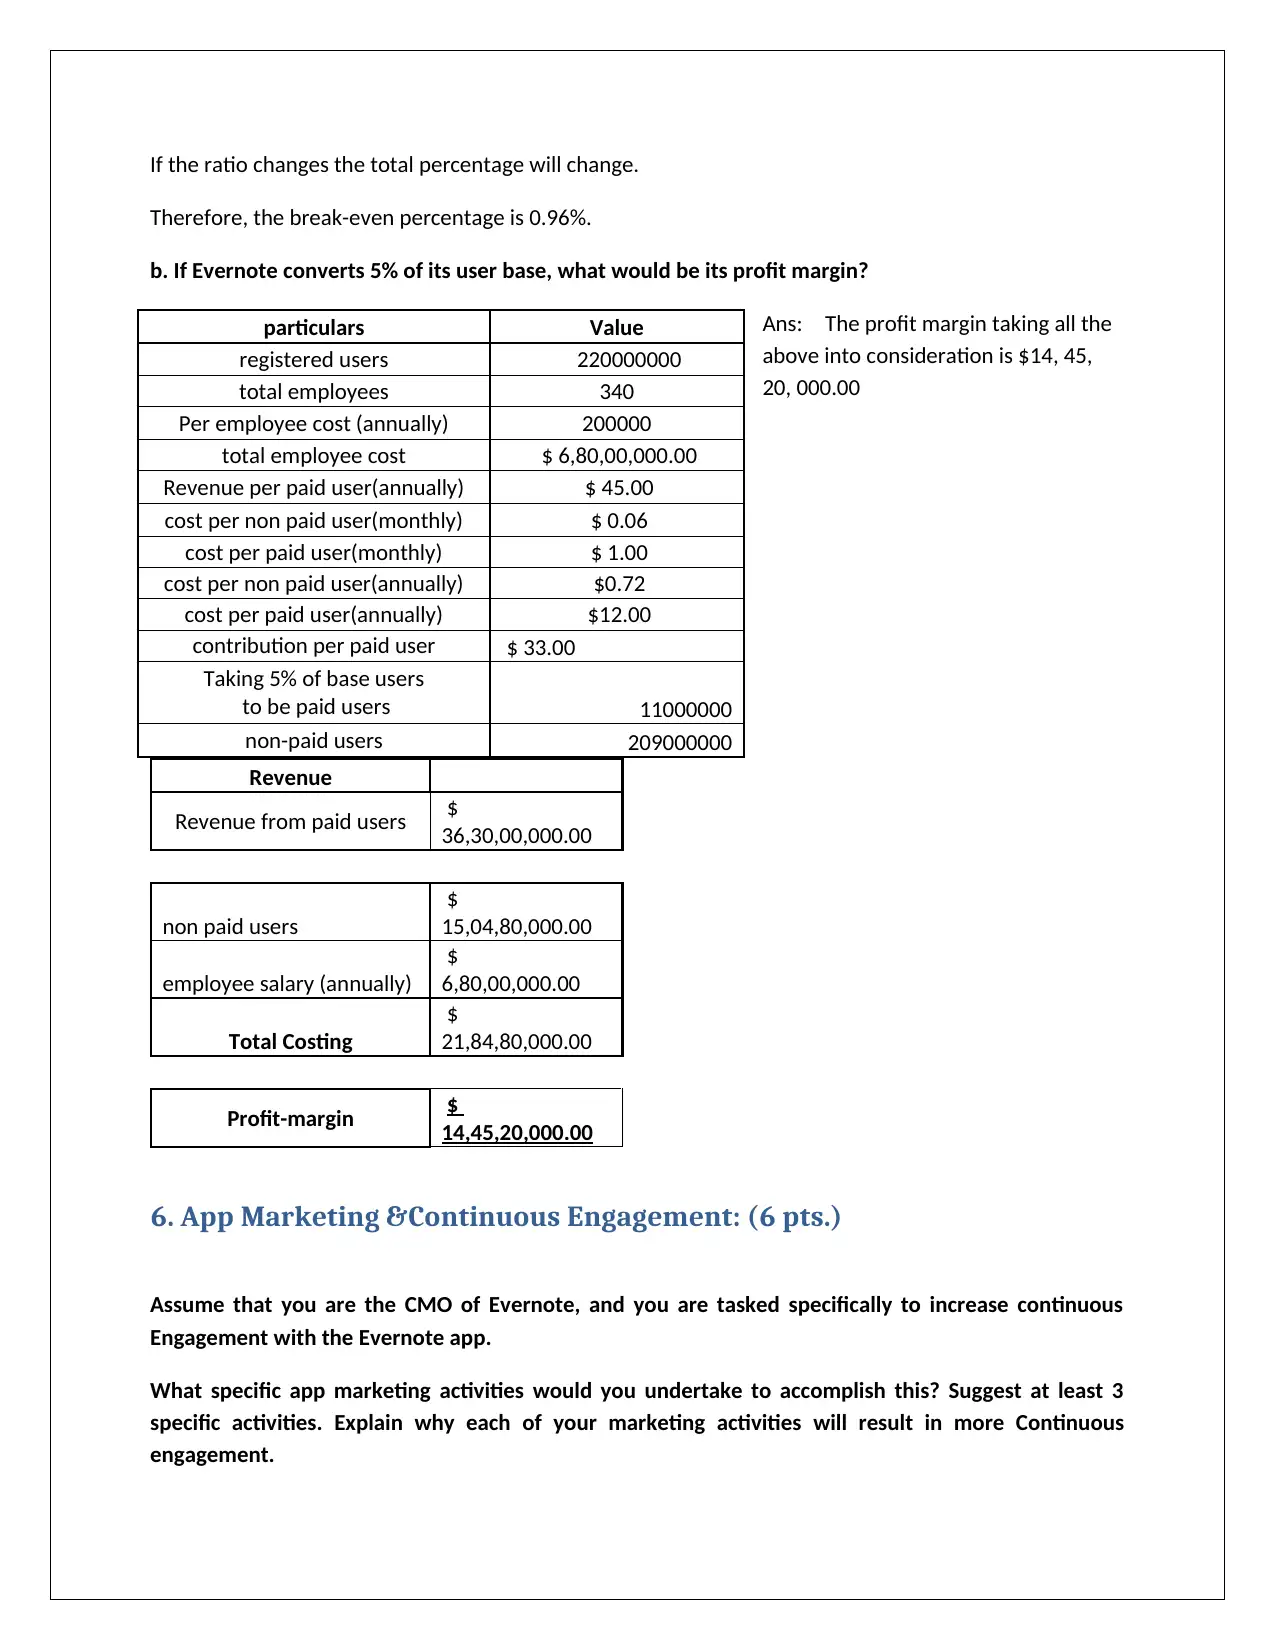
If the ratio changes the total percentage will change.
Therefore, the break-even percentage is 0.96%.
b. If Evernote converts 5% of its user base, what would be its profit margin?
Ans: The profit margin taking all the
above into consideration is $14, 45,
20, 000.00
Revenue
Revenue from paid users $
36,30,00,000.00
non paid users
$
15,04,80,000.00
employee salary (annually)
$
6,80,00,000.00
Total Costing
$
21,84,80,000.00
Profit-margin $
14,45,20,000.00
6. App Marketing &Continuous Engagement: (6 pts.)
Assume that you are the CMO of Evernote, and you are tasked specifically to increase continuous
Engagement with the Evernote app.
What specific app marketing activities would you undertake to accomplish this? Suggest at least 3
specific activities. Explain why each of your marketing activities will result in more Continuous
engagement.
particulars Value
registered users 220000000
total employees 340
Per employee cost (annually) 200000
total employee cost $ 6,80,00,000.00
Revenue per paid user(annually) $ 45.00
cost per non paid user(monthly) $ 0.06
cost per paid user(monthly) $ 1.00
cost per non paid user(annually) $0.72
cost per paid user(annually) $12.00
contribution per paid user $ 33.00
Taking 5% of base users
to be paid users 11000000
non-paid users 209000000
Paraphrase This Document
Need a fresh take? Get an instant paraphrase of this document with our AI Paraphraser
Ans: Engagement strategies:
a. The app should be user friendly.
App engagement is heavily influenced by the use-friendly structuring and algorithm
of the app. The app developing team should have a clear idea about the fact that
what kind of users will use the app. The demographics of users will have its impact
on the app.
b. Notifications on a daily basis should be given to keep the user interested push
notifications can also be used.
Push notifications help a lot in creating engagements as there are many apps that a
user uses and it has been seen that if an app is not used on a daily basis the users
tend to forget about it, thus push notifications come into play.
The push notifications should have innovative aspect towards it also where it should
target the user and notifications should be targeted and customised according to
user usage database information.
c. The users should be asked to give feedback on usage.
The app usage and the rectifications required for the app can be understood through
the feedback that the users will provide. Feedback has always been way the app
developers have got to know the app bugs and the corrections required. The app
quality should be always kept on check through regular updated, as a happy user will
always going to be an engaging user.
7. Virality and Social Lift: (10 pts.)
Assume you run two viral social media video campaigns A and B. For simplicity, assume that you
started both campaigns on the same day. Also assume that the time taken for a re-share is 1 day in
both campaigns.
In viral video Campaign A, on average, a person shares the video A with 12 new people, each with 50%
chance of viewing; and for those that viewed the share, a 20% chance of re-sharing.
In viral video Campaign B, on average, a person shares the video B with 10 new people, each with 60%
chance of viewing; and for those that viewed the share, a 25% chance of re-sharing.
Let’s say that Campaign A was started with 200 people sharing video A at the end of day 0, and
Campaign B was started with 100 people sharing video B at the end of day 0.
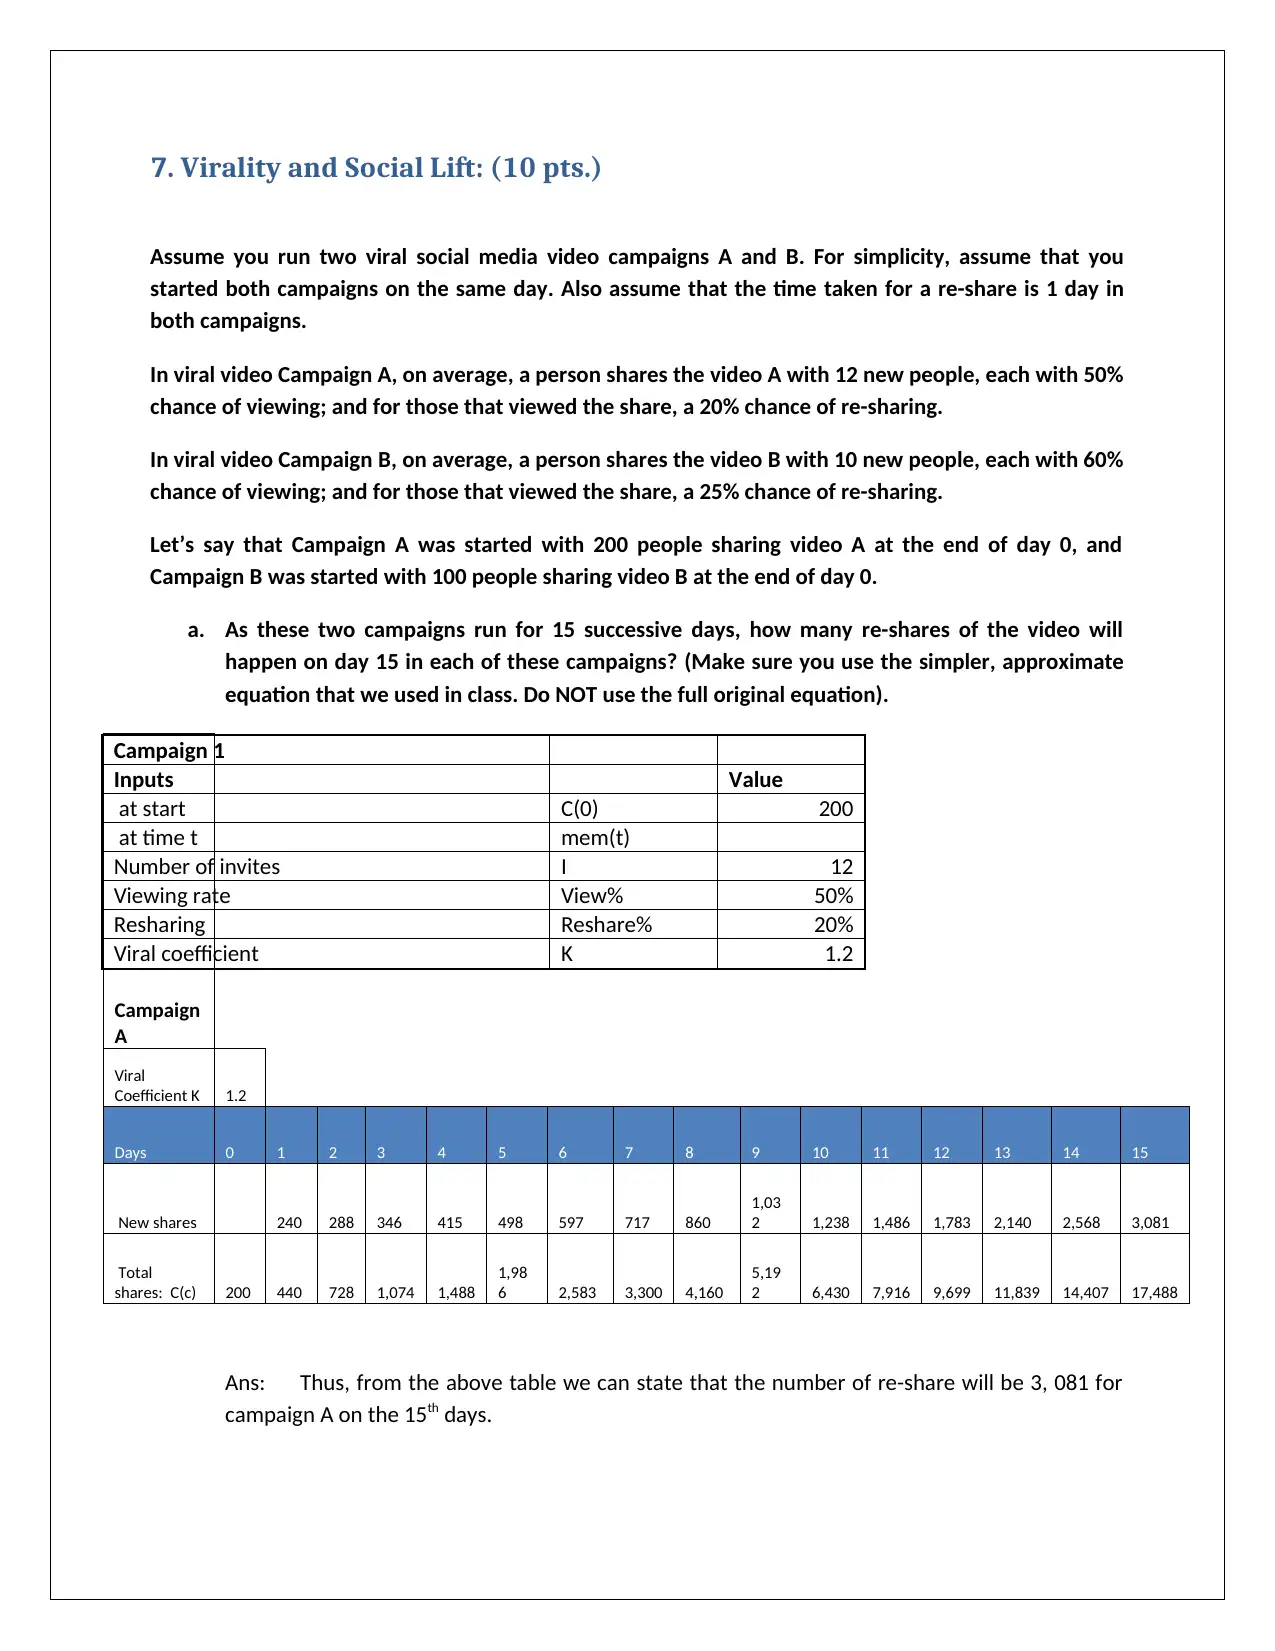
a. As these two campaigns run for 15 successive days, how many re-shares of the video will
happen on day 15 in each of these campaigns? (Make sure you use the simpler, approximate
equation that we used in class. Do NOT use the full original equation).
Campaign
A
Viral
Coefficient K 1.2
Days 0 1 2 3 4 5 6 7 8 9 10 11 12 13 14 15
New shares 240 288 346 415 498 597 717 860
1,03
2 1,238 1,486 1,783 2,140 2,568 3,081
Total
shares: C(c) 200 440 728 1,074 1,488
1,98
6 2,583 3,300 4,160
5,19
2 6,430 7,916 9,699 11,839 14,407 17,488
Ans: Thus, from the above table we can state that the number of re-share will be 3, 081 for
campaign A on the 15th days.
Campaign 1
Inputs Value
at start C(0) 200
at time t mem(t)
Number of invites I 12
Viewing rate View% 50%
Resharing Reshare% 20%
Viral coefficient K 1.2
Assume you run two viral social media video campaigns A and B. For simplicity, assume that you
started both campaigns on the same day. Also assume that the time taken for a re-share is 1 day in
both campaigns.
In viral video Campaign A, on average, a person shares the video A with 12 new people, each with 50%
chance of viewing; and for those that viewed the share, a 20% chance of re-sharing.
In viral video Campaign B, on average, a person shares the video B with 10 new people, each with 60%
chance of viewing; and for those that viewed the share, a 25% chance of re-sharing.
Let’s say that Campaign A was started with 200 people sharing video A at the end of day 0, and
Campaign B was started with 100 people sharing video B at the end of day 0.
a. As these two campaigns run for 15 successive days, how many re-shares of the video will
happen on day 15 in each of these campaigns? (Make sure you use the simpler, approximate
equation that we used in class. Do NOT use the full original equation).
Campaign
A
Viral
Coefficient K 1.2
Days 0 1 2 3 4 5 6 7 8 9 10 11 12 13 14 15
New shares 240 288 346 415 498 597 717 860
1,03
2 1,238 1,486 1,783 2,140 2,568 3,081
Total
shares: C(c) 200 440 728 1,074 1,488
1,98
6 2,583 3,300 4,160
5,19
2 6,430 7,916 9,699 11,839 14,407 17,488
Ans: Thus, from the above table we can state that the number of re-share will be 3, 081 for
campaign A on the 15th days.
Campaign 1
Inputs Value
at start C(0) 200
at time t mem(t)
Number of invites I 12
Viewing rate View% 50%
Resharing Reshare% 20%
Viral coefficient K 1.2
⊘ This is a preview!⊘
Do you want full access?
Subscribe today to unlock all pages.
Trusted by 1+ million students worldwide
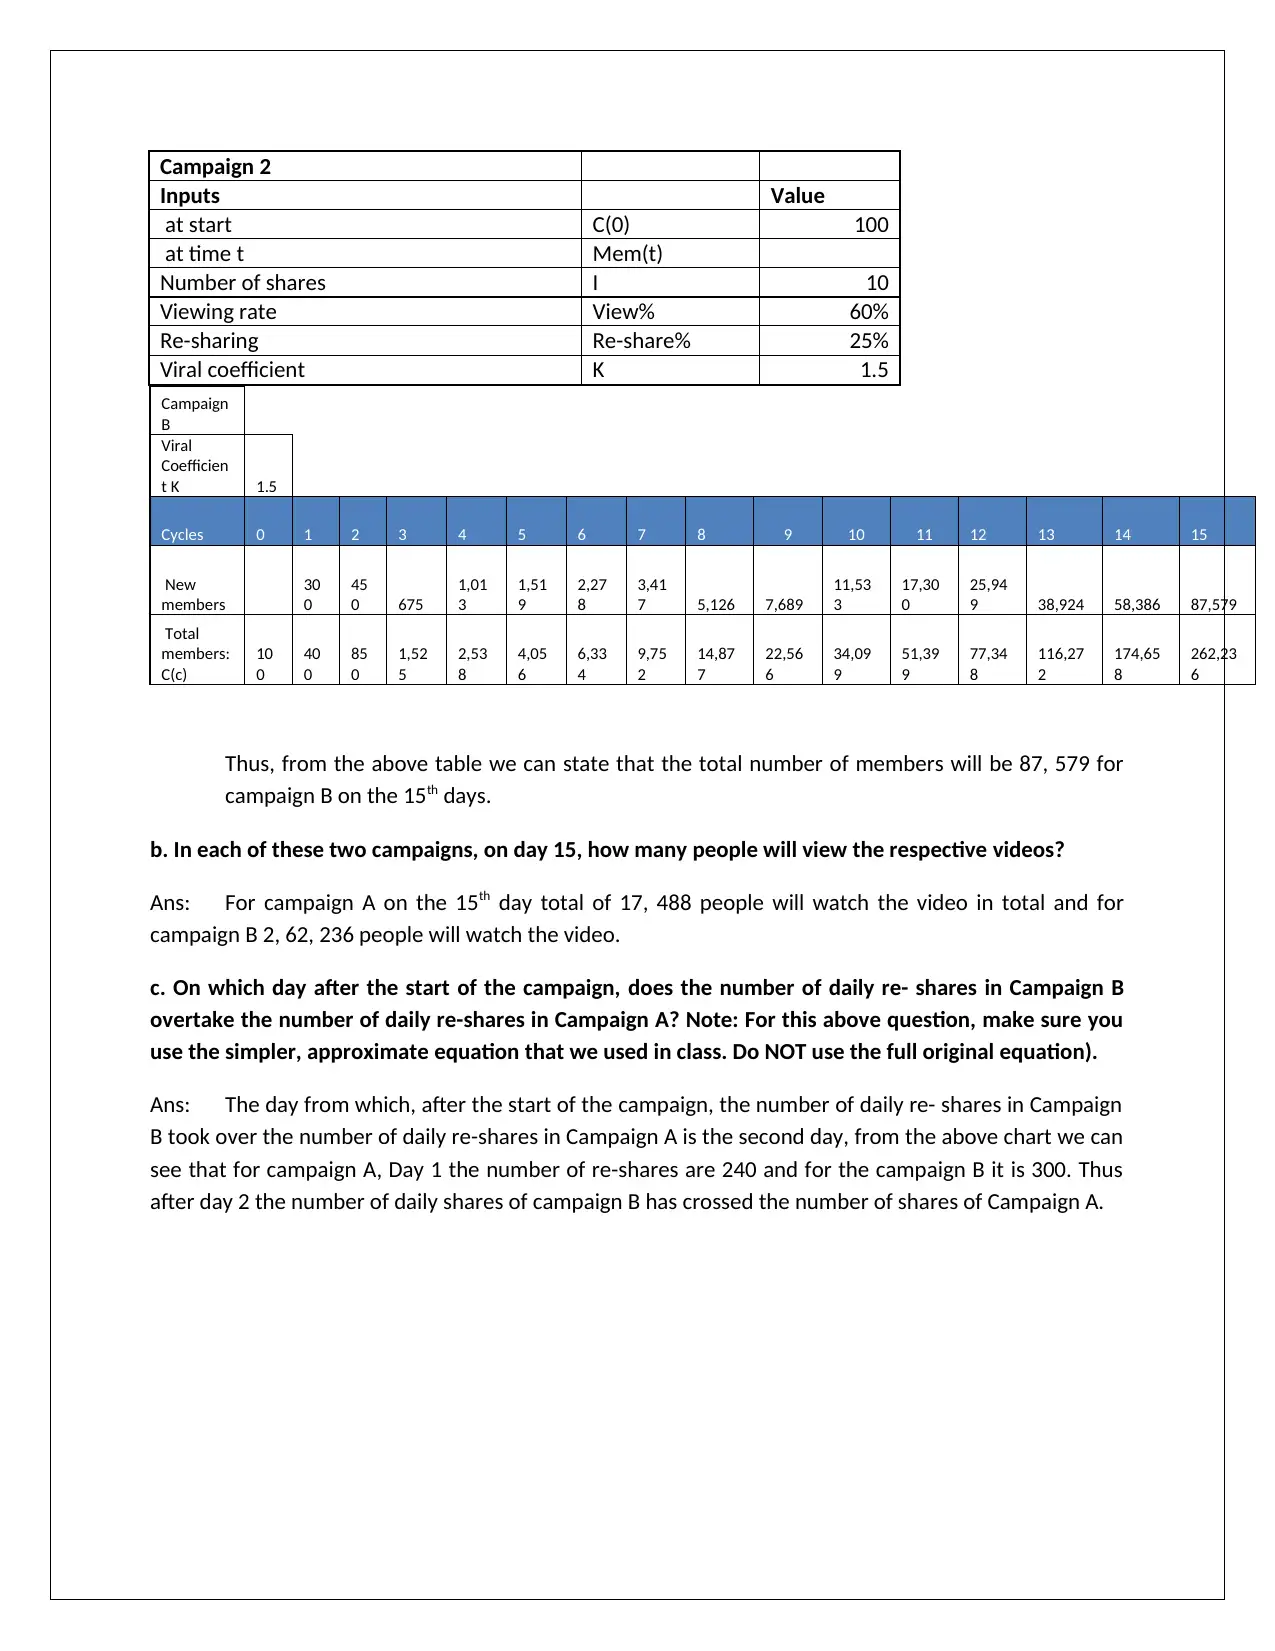
Campaign 2
Inputs Value
at start C(0) 100
at time t Mem(t)
Number of shares I 10
Viewing rate View% 60%
Re-sharing Re-share% 25%
Viral coefficient K 1.5
Campaign
B
Viral
Coefficien
t K 1.5
Cycles 0 1 2 3 4 5 6 7 8 9 10 11 12 13 14 15
New
members
30
0
45
0 675
1,01
3
1,51
9
2,27
8
3,41
7 5,126 7,689
11,53
3
17,30
0
25,94
9 38,924 58,386 87,579
Total
members:
C(c)
10
0
40
0
85
0
1,52
5
2,53
8
4,05
6
6,33
4
9,75
2
14,87
7
22,56
6
34,09
9
51,39
9
77,34
8
116,27
2
174,65
8
262,23
6
Thus, from the above table we can state that the total number of members will be 87, 579 for
campaign B on the 15th days.
b. In each of these two campaigns, on day 15, how many people will view the respective videos?
Ans: For campaign A on the 15th day total of 17, 488 people will watch the video in total and for
campaign B 2, 62, 236 people will watch the video.
c. On which day after the start of the campaign, does the number of daily re- shares in Campaign B
overtake the number of daily re-shares in Campaign A? Note: For this above question, make sure you
use the simpler, approximate equation that we used in class. Do NOT use the full original equation).
Ans: The day from which, after the start of the campaign, the number of daily re- shares in Campaign
B took over the number of daily re-shares in Campaign A is the second day, from the above chart we can
see that for campaign A, Day 1 the number of re-shares are 240 and for the campaign B it is 300. Thus
after day 2 the number of daily shares of campaign B has crossed the number of shares of Campaign A.
Paraphrase This Document
Need a fresh take? Get an instant paraphrase of this document with our AI Paraphraser
Reference
Geddes, B. (2019). How the PPC ad auction works - Search Engine Land. [online] Search Engine Land.
Available at: https://searchengineland.com/guide/ppc/how-the-ppc-ad-auction-works [Accessed
13 Apr. 2019].
Geddes, B. (2019). How the PPC ad auction works - Search Engine Land. [online] Search Engine Land.
Available at: https://searchengineland.com/guide/ppc/how-the-ppc-ad-auction-works [Accessed
13 Apr. 2019].
1 out of 11
Your All-in-One AI-Powered Toolkit for Academic Success.
+13062052269
info@desklib.com
Available 24*7 on WhatsApp / Email
![[object Object]](/_next/static/media/star-bottom.7253800d.svg)
Unlock your academic potential
Copyright © 2020–2026 A2Z Services. All Rights Reserved. Developed and managed by ZUCOL.