ITECH1100: Understanding Digital Revolution - Tuxedo City Project

Verified

Added on  2022/12/29

|7
|825
|86
Project
AI Summary
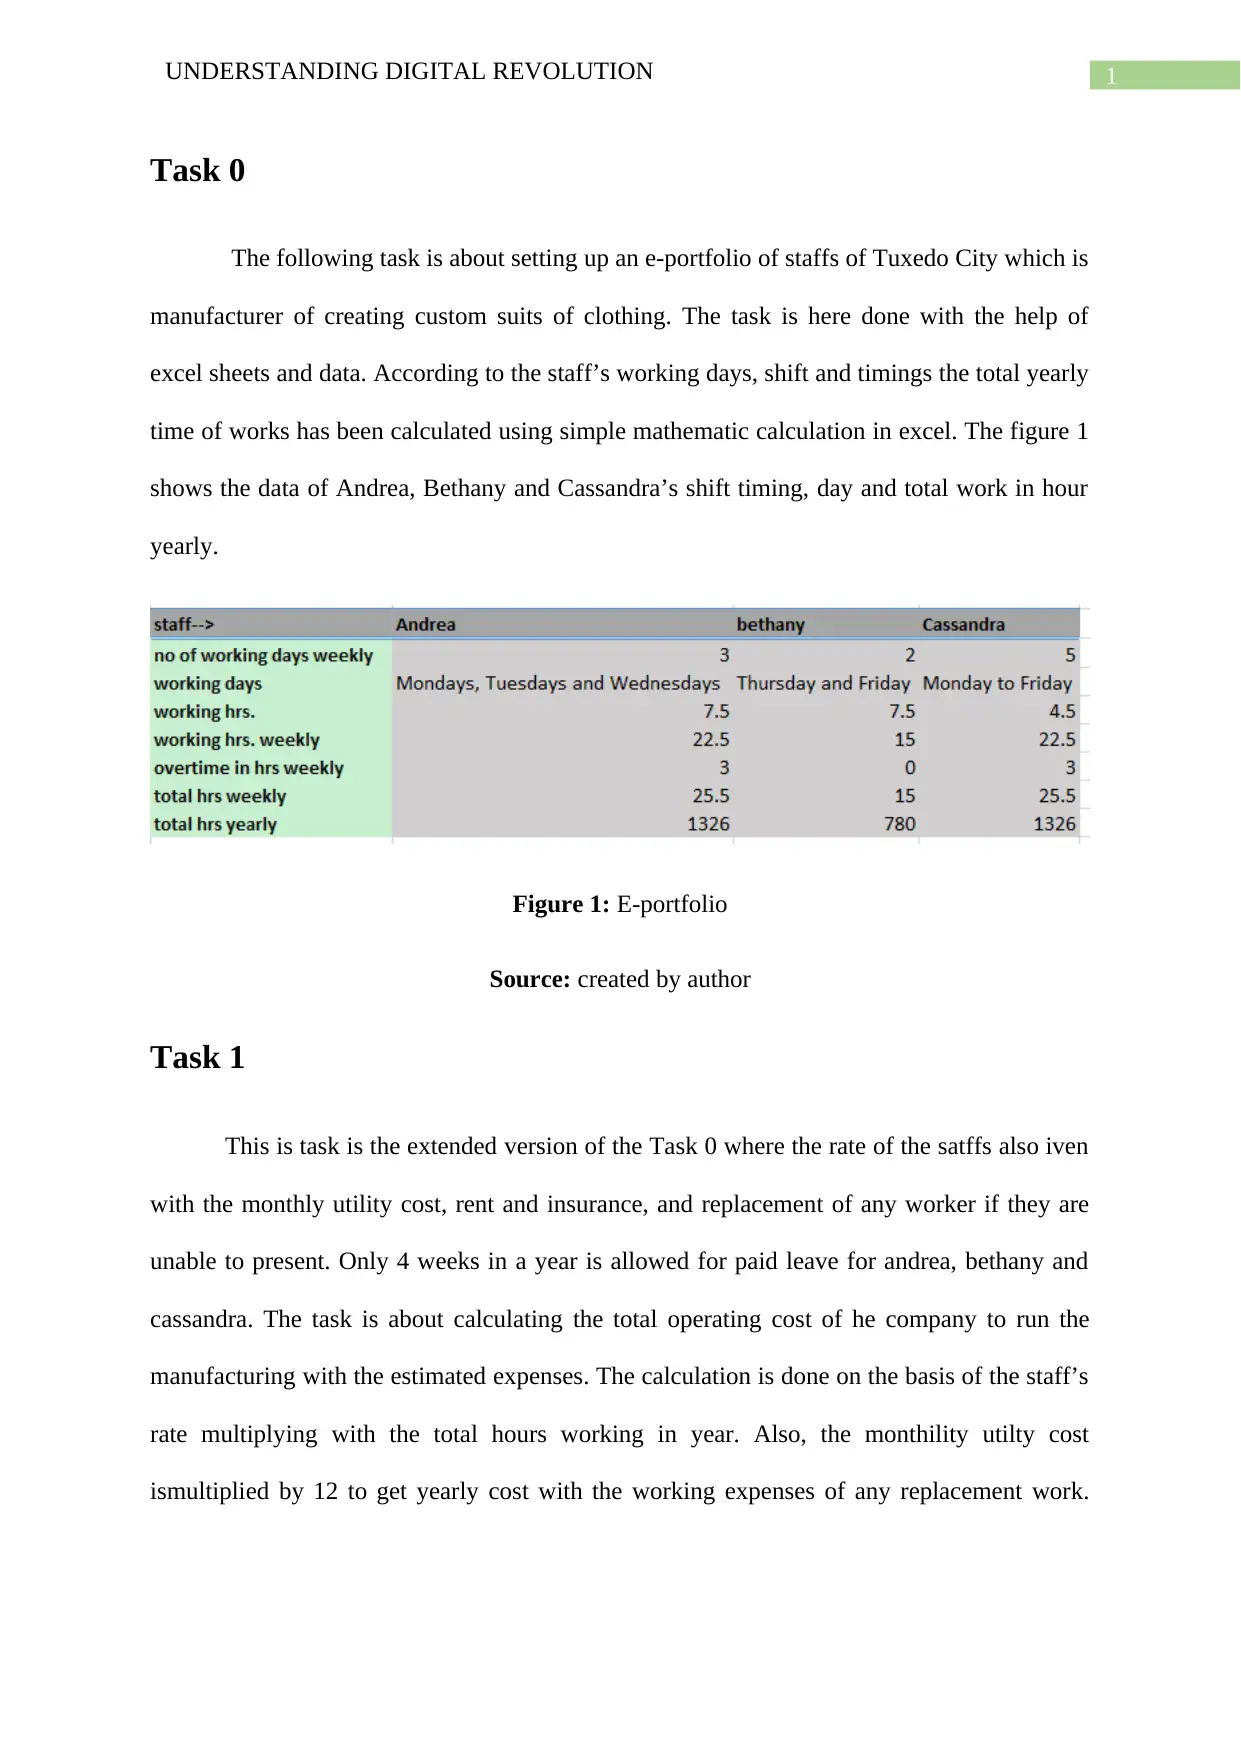
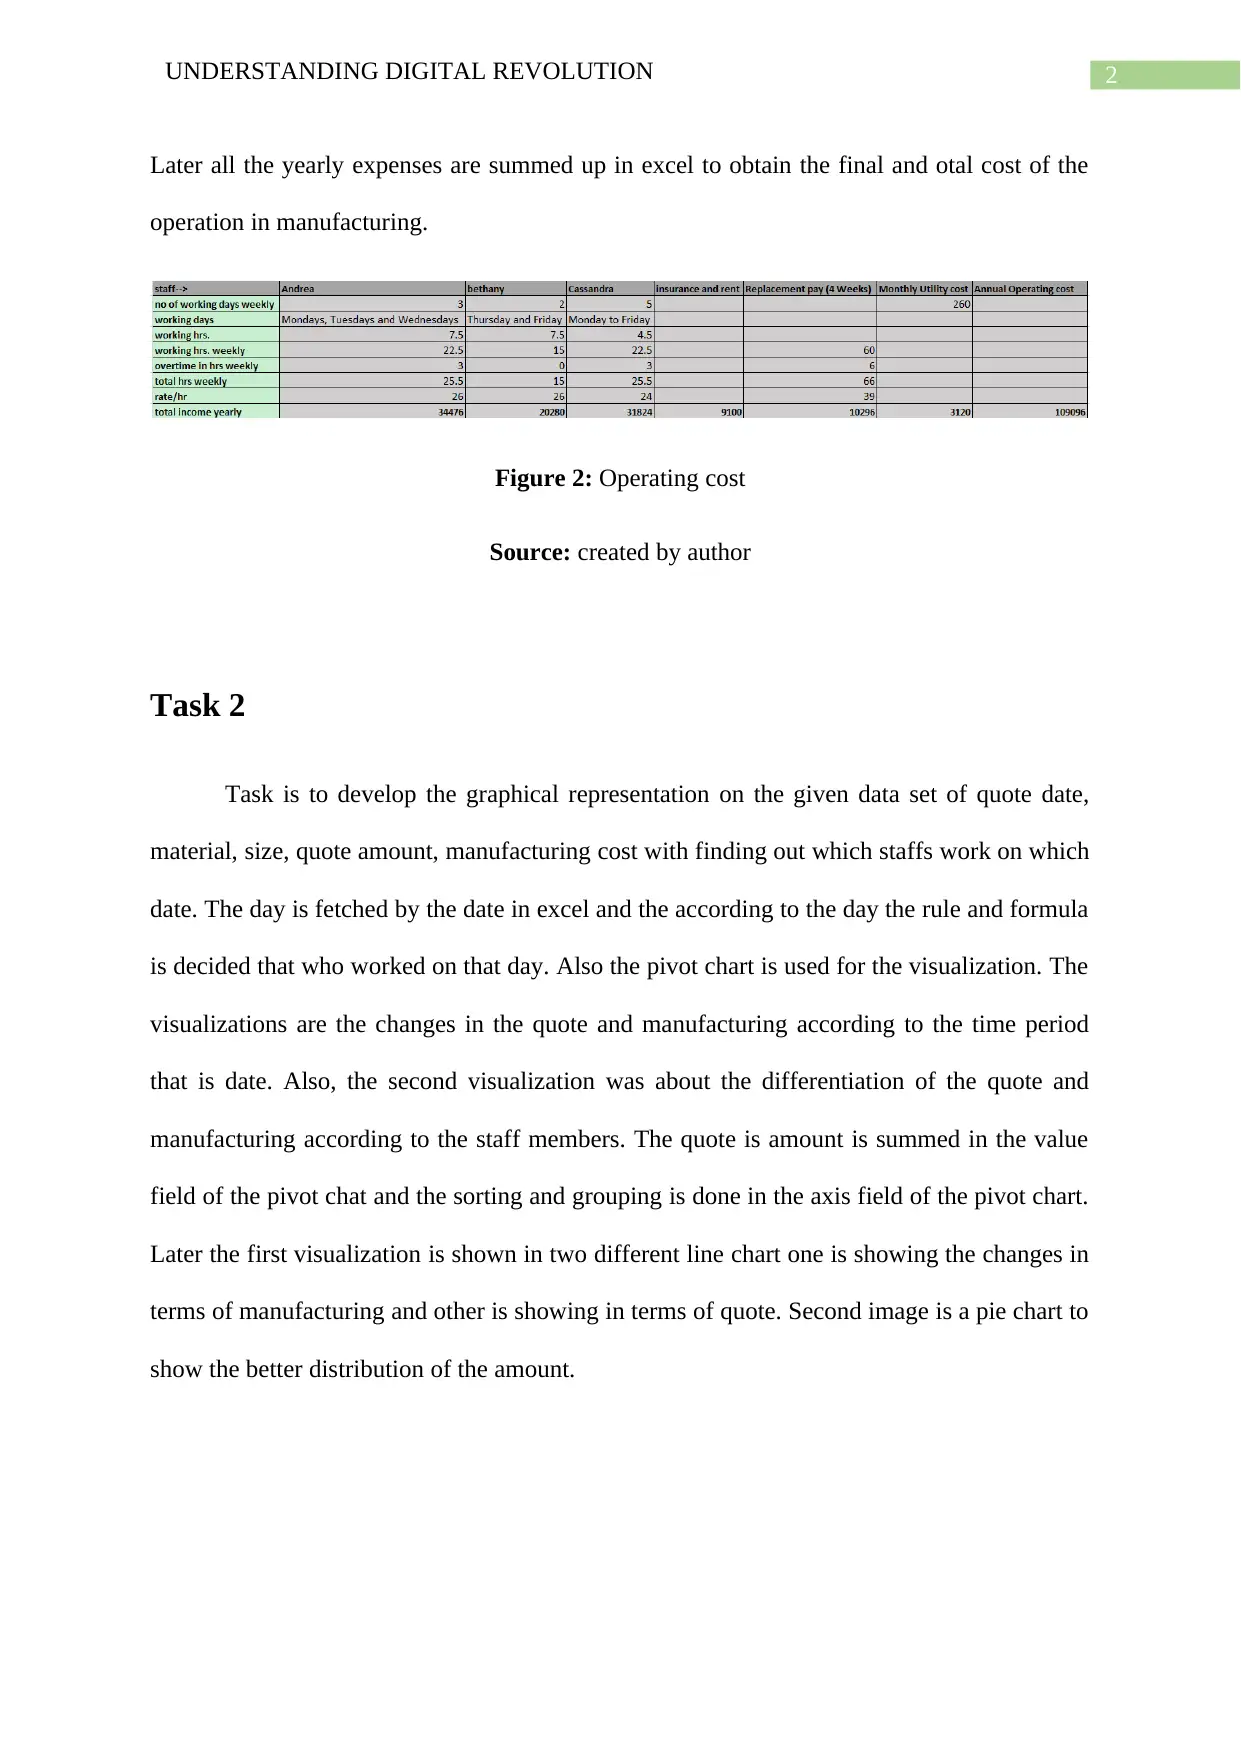
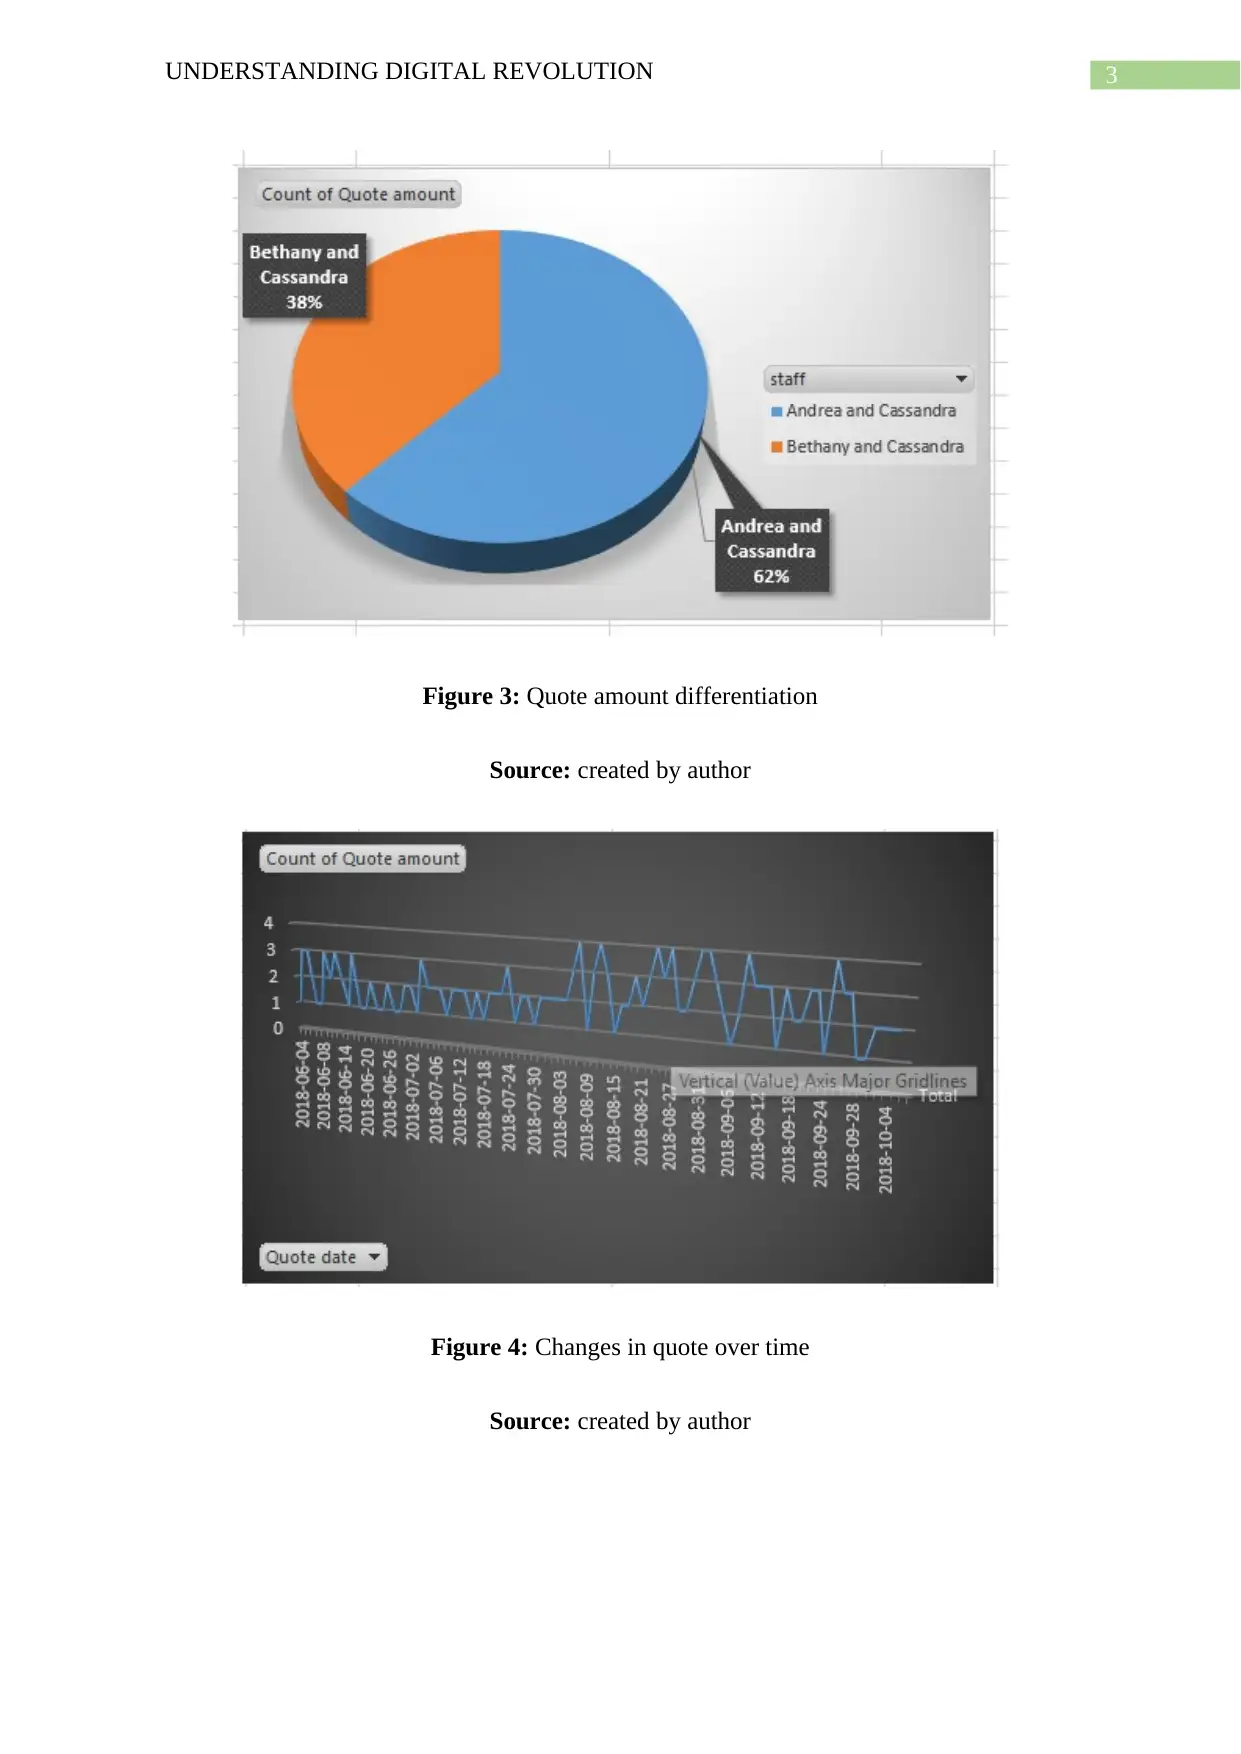
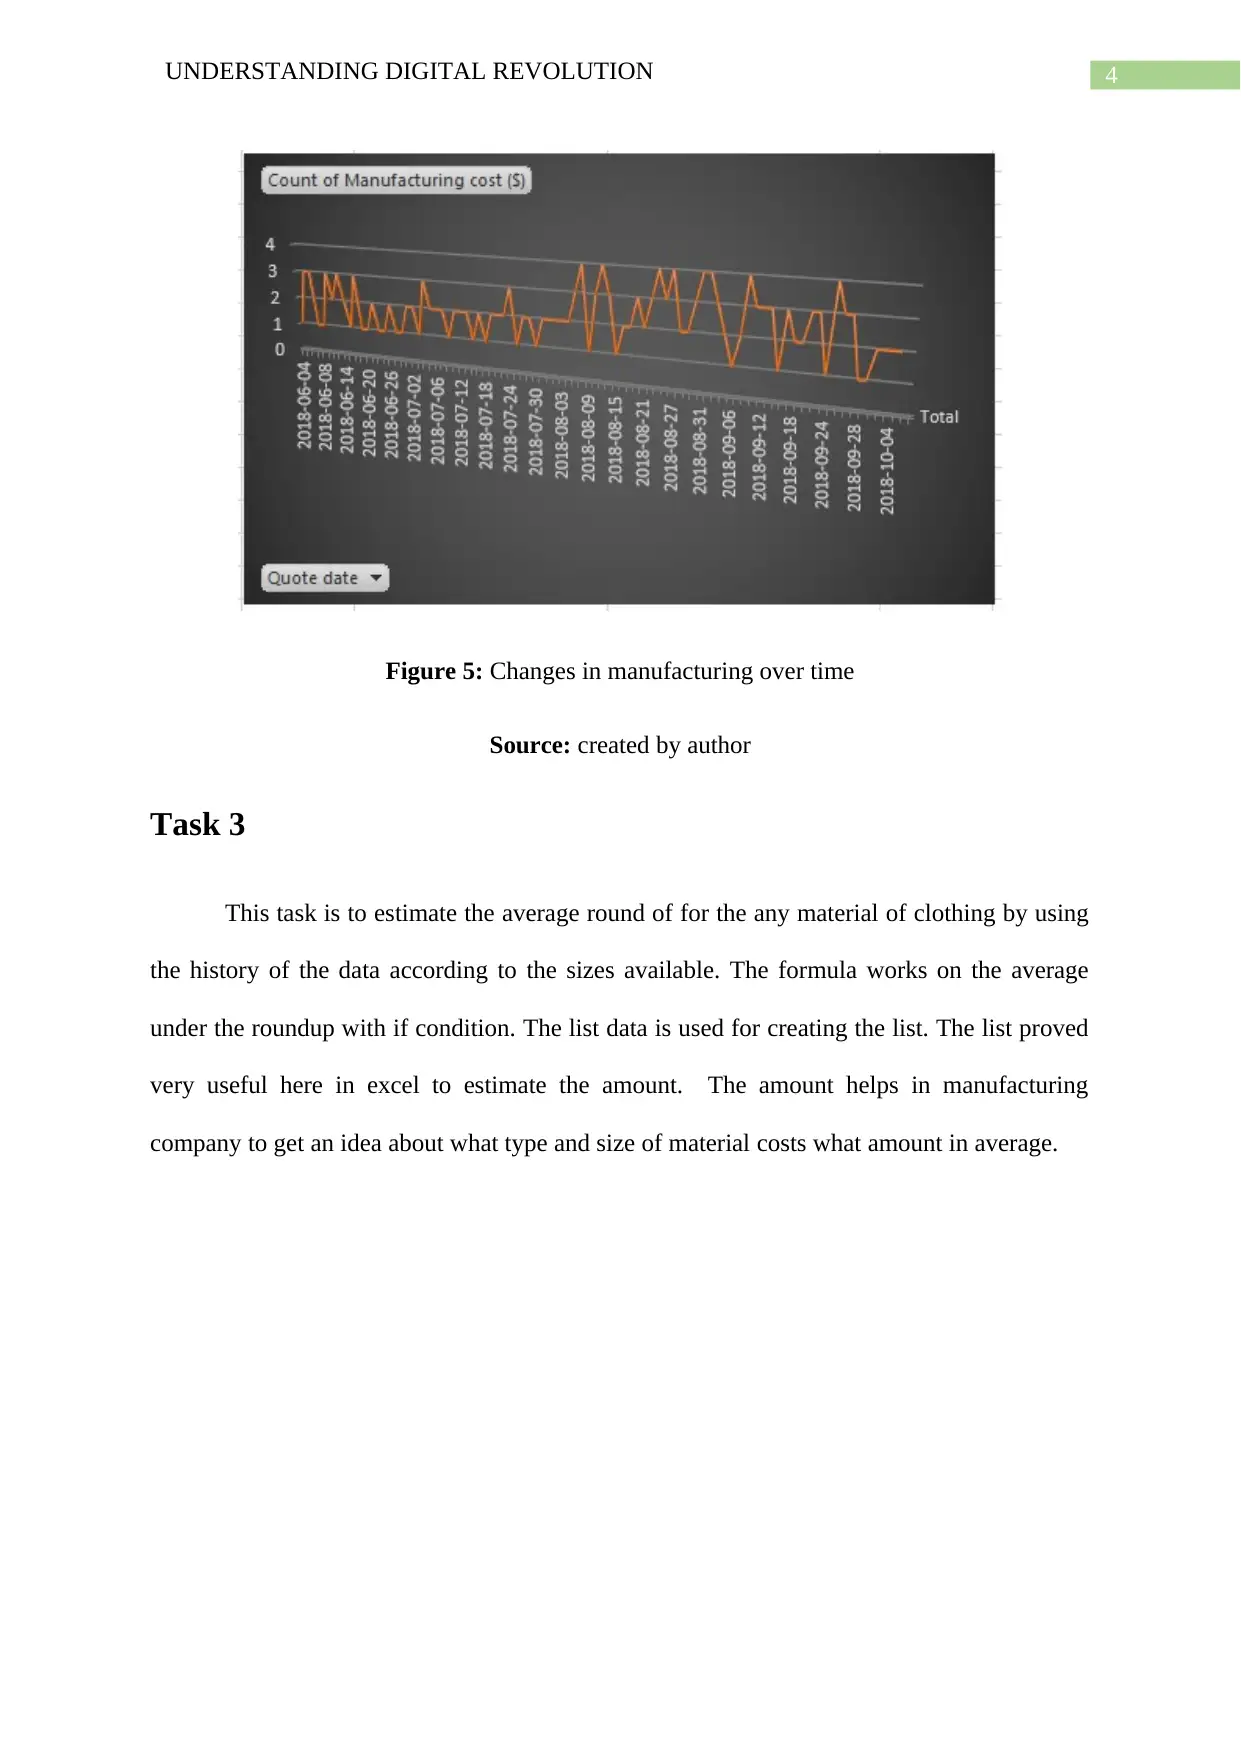
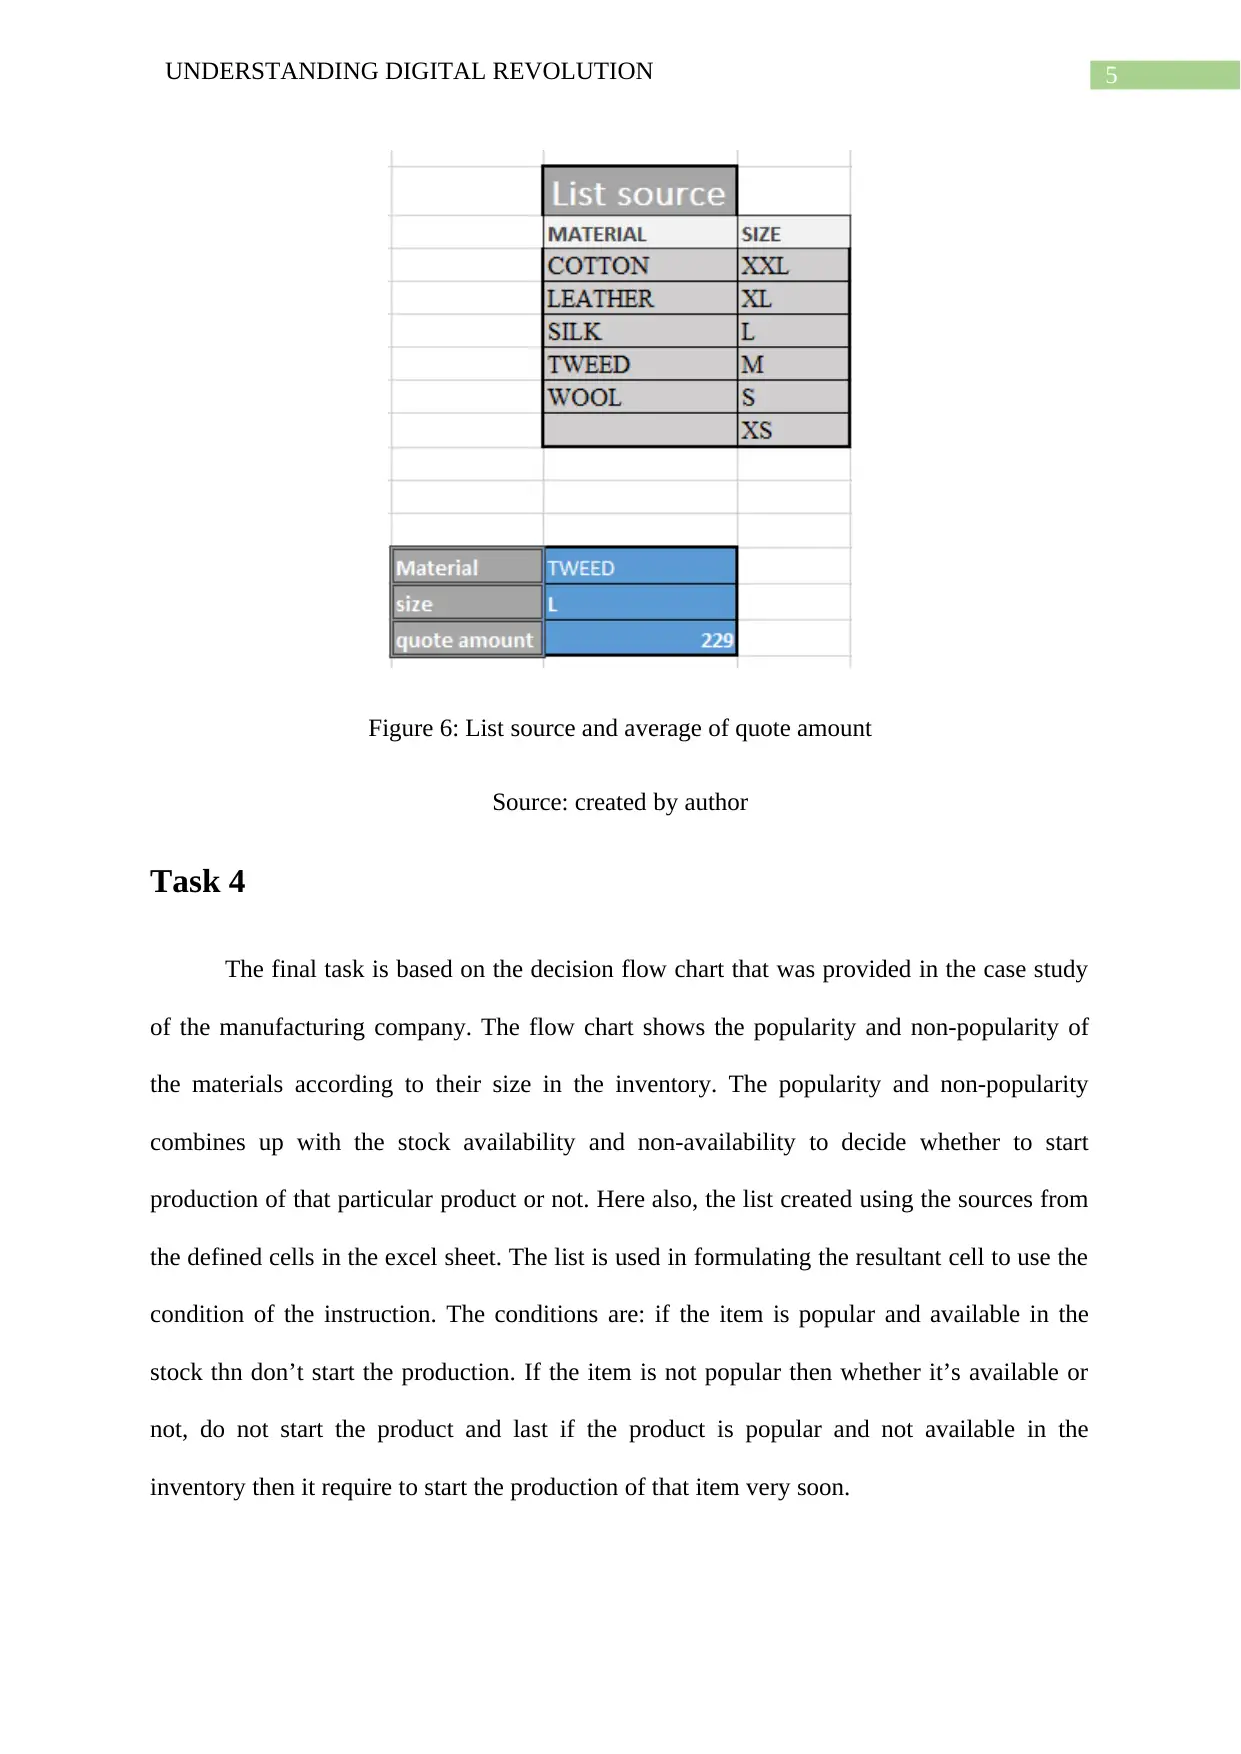
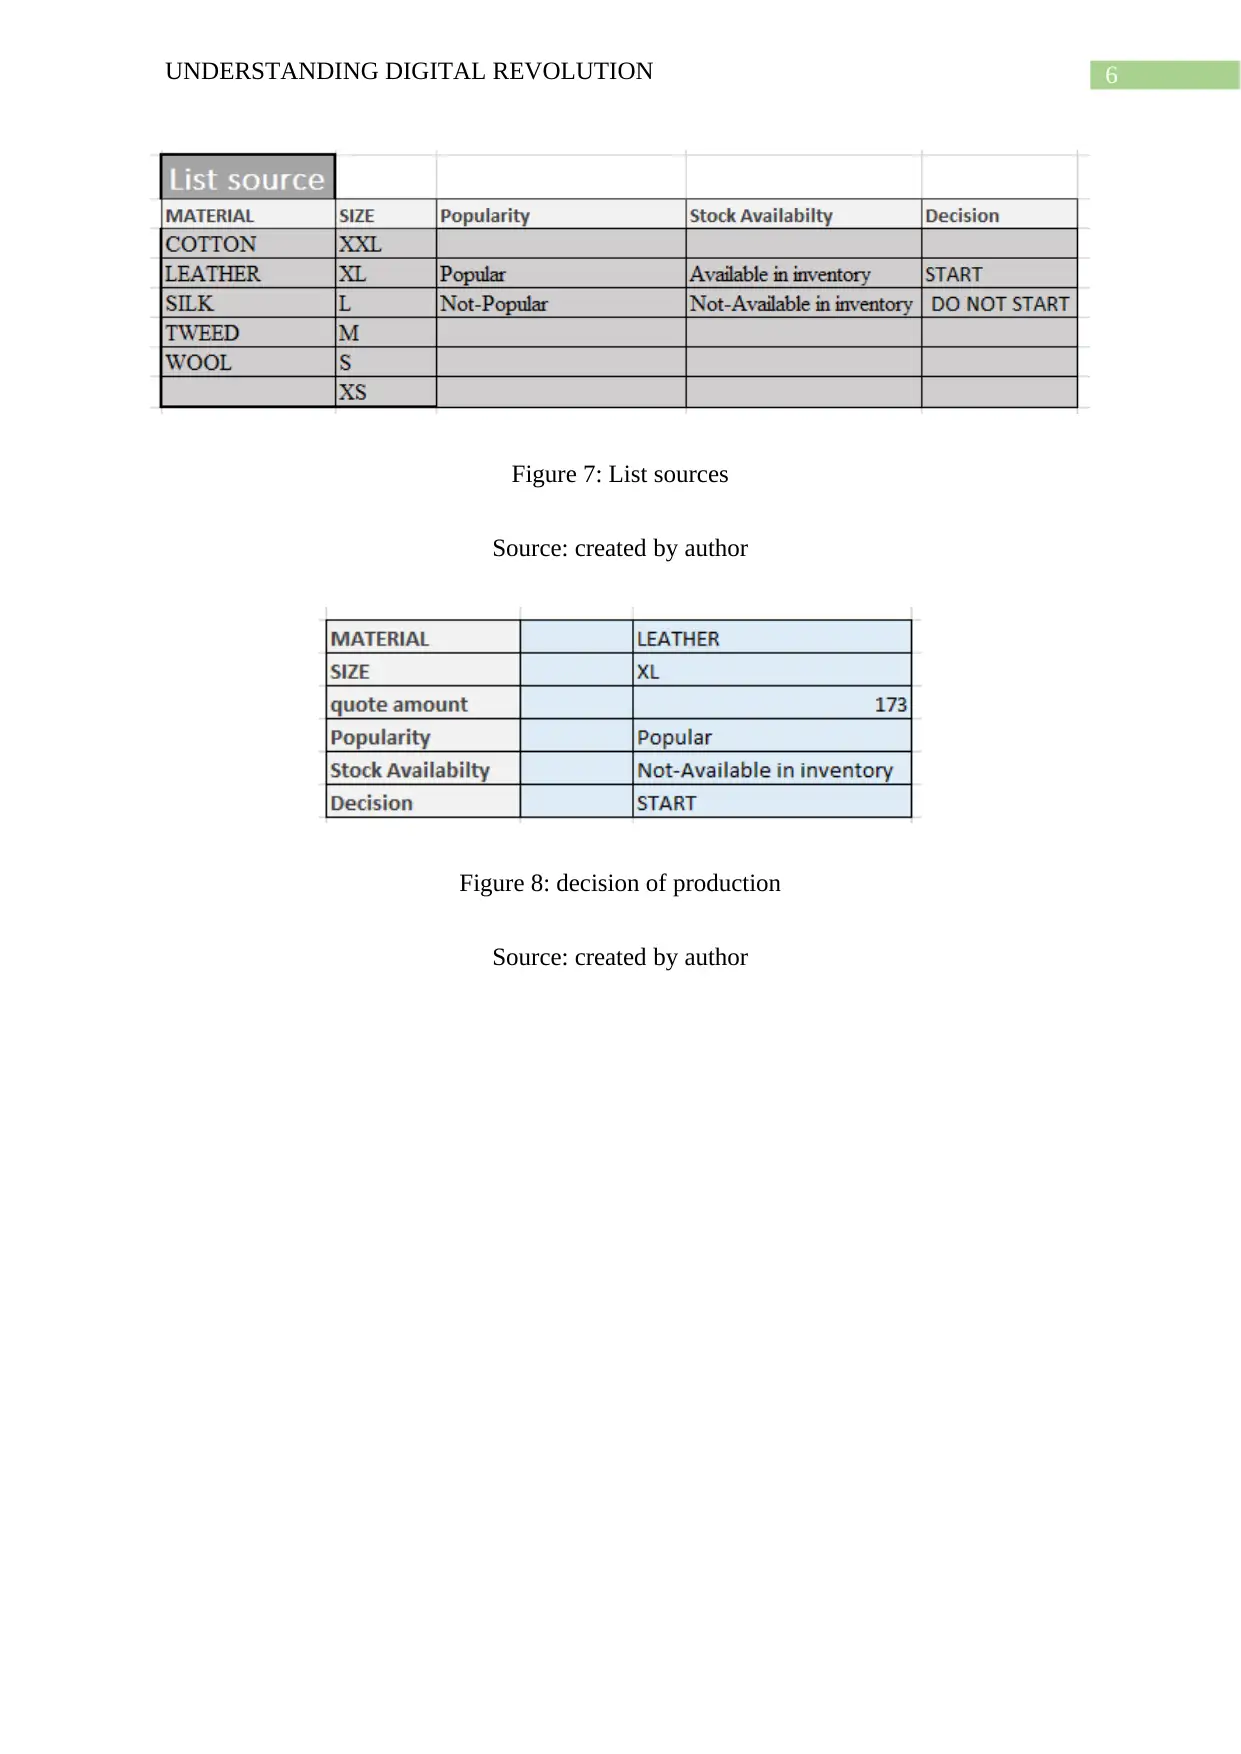
This project focuses on understanding the digital revolution through the lens of a case study involving Tuxedo City, a custom suit manufacturer. The assignment utilizes Microsoft Excel to automate business processes and visualize data. Task 0 involves setting up an e-portfolio using staff data, calculating yearly work hours. Task 1 extends this by calculating the total operating costs, considering staff rates, utility costs, and potential replacement expenses. Task 2 involves graphical representations of quote and manufacturing data, using pivot charts for visualization and analysis of trends over time. Task 3 estimates average material costs using historical data and the AVERAGE and IF functions in Excel. Finally, Task 4 employs a decision flow chart to determine production decisions based on material popularity, size, and stock availability. The project demonstrates data analysis, business process automation, and data visualization skills within the context of a real-world business scenario.
Document Page
Running head: UNDERSTANDING DIGITAL REVOLUTION
Understanding Digital Revolution
Name of the Student
Name of the University
Author Note
tabler-icon-diamond-filled.svg

Secure Best Marks with AI Grader

Need help grading? Try our AI Grader for instant feedback on your assignments.
Document Page
1UNDERSTANDING DIGITAL REVOLUTION
Task 0
The following task is about setting up an e-portfolio of staffs of Tuxedo City which is
manufacturer of creating custom suits of clothing. The task is here done with the help of
excel sheets and data. According to the staff’s working days, shift and timings the total yearly
time of works has been calculated using simple mathematic calculation in excel. The figure 1
shows the data of Andrea, Bethany and Cassandra’s shift timing, day and total work in hour
yearly.
Figure 1: E-portfolio
Source: created by author
Task 1
This is task is the extended version of the Task 0 where the rate of the satffs also iven
with the monthly utility cost, rent and insurance, and replacement of any worker if they are
unable to present. Only 4 weeks in a year is allowed for paid leave for andrea, bethany and
cassandra. The task is about calculating the total operating cost of he company to run the
manufacturing with the estimated expenses. The calculation is done on the basis of the staff’s
rate multiplying with the total hours working in year. Also, the monthility utilty cost
ismultiplied by 12 to get yearly cost with the working expenses of any replacement work.
Document Page
2UNDERSTANDING DIGITAL REVOLUTION
Later all the yearly expenses are summed up in excel to obtain the final and otal cost of the
operation in manufacturing.
Figure 2: Operating cost
Source: created by author
Task 2
Task is to develop the graphical representation on the given data set of quote date,
material, size, quote amount, manufacturing cost with finding out which staffs work on which
date. The day is fetched by the date in excel and the according to the day the rule and formula
is decided that who worked on that day. Also the pivot chart is used for the visualization. The
visualizations are the changes in the quote and manufacturing according to the time period
that is date. Also, the second visualization was about the differentiation of the quote and
manufacturing according to the staff members. The quote is amount is summed in the value
field of the pivot chat and the sorting and grouping is done in the axis field of the pivot chart.
Later the first visualization is shown in two different line chart one is showing the changes in
terms of manufacturing and other is showing in terms of quote. Second image is a pie chart to
show the better distribution of the amount.
Document Page
3UNDERSTANDING DIGITAL REVOLUTION
Figure 3: Quote amount differentiation
Source: created by author
Figure 4: Changes in quote over time
Source: created by author
tabler-icon-diamond-filled.svg

Secure Best Marks with AI Grader

Need help grading? Try our AI Grader for instant feedback on your assignments.
Document Page
4UNDERSTANDING DIGITAL REVOLUTION
Figure 5: Changes in manufacturing over time
Source: created by author
Task 3
This task is to estimate the average round of for the any material of clothing by using
the history of the data according to the sizes available. The formula works on the average
under the roundup with if condition. The list data is used for creating the list. The list proved
very useful here in excel to estimate the amount. The amount helps in manufacturing
company to get an idea about what type and size of material costs what amount in average.
Document Page
5UNDERSTANDING DIGITAL REVOLUTION
Figure 6: List source and average of quote amount
Source: created by author
Task 4
The final task is based on the decision flow chart that was provided in the case study
of the manufacturing company. The flow chart shows the popularity and non-popularity of
the materials according to their size in the inventory. The popularity and non-popularity
combines up with the stock availability and non-availability to decide whether to start
production of that particular product or not. Here also, the list created using the sources from
the defined cells in the excel sheet. The list is used in formulating the resultant cell to use the
condition of the instruction. The conditions are: if the item is popular and available in the
stock thn don’t start the production. If the item is not popular then whether it’s available or
not, do not start the product and last if the product is popular and not available in the
inventory then it require to start the production of that item very soon.
Document Page
6UNDERSTANDING DIGITAL REVOLUTION
Figure 7: List sources
Source: created by author
Figure 8: decision of production
Source: created by author
chevron_up_icon
1 out of 7
circle_padding
hide_on_mobile
zoom_out_icon
[object Object]