Financial Analysis Report: Dilmah Tea Company's Strategic Overview
VerifiedAdded on 2023/01/12
|10
|2620
|59
Report
AI Summary
This report presents a detailed financial analysis of Dilmah Tea Company, focusing on its strategic decisions and financial performance. It examines key financial metrics such as revenue, gross profit margin, operating expenses, PBT, PAT, assets, liquidity, working capital, and cash flows. The report also analyzes Dilmah's capital structure, including ROCE, EPS, net assets per share, share price, DPS, dividend yield, dividend payout, and market value. Furthermore, it explores Dilmah's dividend policy and capital value additions. The analysis reveals Dilmah's strong financial position and its potential for expansion, supported by a detailed review of its financial statements and performance indicators. The report concludes with a discussion of the importance of financial management in ensuring organizational success and provides references to relevant literature and supporting financial data.

Financial
Management
Management
Paraphrase This Document
Need a fresh take? Get an instant paraphrase of this document with our AI Paraphraser
Contents
INTRODUCTION...........................................................................................................................3
TASK...............................................................................................................................................3
Overview of Dilmah:.......................................................................................................................3
Vision Statement of Dilmah:..................................................................................................3
The Measurements of Financial Achievement:...............................................................................4
Revenue:.................................................................................................................................4
Gross Profit Margin:...............................................................................................................4
Operating Expenses:...............................................................................................................4
PBT and PAT:........................................................................................................................5
Assets:.....................................................................................................................................5
Liquidity, Working Capital and Cash Flows:.........................................................................5
Current Assets:.......................................................................................................................5
Current Liabilities:..................................................................................................................6
Capital Structure:....................................................................................................................6
1. ROCE:................................................................................................................................7
2. EPS:....................................................................................................................................7
3. Net Assets per share:..........................................................................................................7
4. Share Price:.........................................................................................................................7
DPS, Divided yield and Dividend pay-out:............................................................................7
Market Value:.........................................................................................................................8
Dividend Policy:.....................................................................................................................8
Capital Value Addition:..........................................................................................................8
REFERENCES................................................................................................................................9

APPENDIX....................................................................................................................................10
⊘ This is a preview!⊘
Do you want full access?
Subscribe today to unlock all pages.
Trusted by 1+ million students worldwide
INTRODUCTION
Financial management primarily deals with the strategic actions that result in companies
acquiring as well as financing short run and long-term loans. Financial management in every
entity is a critical process. To accomplish organizational priorities and targets, it is the method of
preparing, coordinating, managing and tracking fiscal resources Mien and Thao, (2015). This is
an excellent method for monitoring a firm's financial operations such as budget procurement,
budget use, reporting, transactions, risk management and everything else relevant to funds. This
study is mainly focused on business plan of Dilmah Tea company which wants to enter into Sri
Lanka’s dairy market with aim to empower local farmers.
TASK
Overview of Dilmah:
Dilmah is a corporation formed in year 1988 by Fernando, company named after his 2 daughters,
Dilhan and Malik. Fernando concentrated on product quality, credibility and morality that were
absent from tea industry at the time. Other international tea companies use Ceylon tea, filtered
and combined with tea of different sources, and sold as unadulterated Sri-Lankan
teas worldwide. Their emphasis was on buying at lowest price and showing no regard for prices.
Dilmah opposed this assertion as well as introduced Single Origin, unblended teas. Dilmah was
managing to develop a tea business segment powered by quality over previous 30 years.
Currently, company Dilmah is available in above 100 countries, rated one of world's best-tea
labels, and regarded as Sri-Lanka largest tea bag manufacturer and exporter. Also, Company
Dilmah is first tea brand controlled by producer worldwide About us: Dilmah. (2019).
Vision Statement of Dilmah:
Bring quality, credibility, and trustworthiness back in business of tea and make business a human
service affair. As family business, with family ideals at its root, company believe which there
needs are an goal above the solely economic component, and every organization has a duty to
offer back to society and environment.
Paraphrase This Document
Need a fresh take? Get an instant paraphrase of this document with our AI Paraphraser
The Measurements of Financial Achievement:
Revenue:
Revenue rose mostly on back of LKR's rapid weakening of USD during the year, coupled with
volume increase of 11%. Nation-specific sales growth control strategies (delicate to the strained
economic conditions in several of marketplaces), new consumer acquisitions and tailored
business operations in all sectors and core segments expanded market penetration Golin and
Delhaise, (2013).
In order to follow emerging market trends, the company sought to expand its product range and
created new ingredients and branding mixes. Despite increasing pressure on product rates and the
pervasive practice of bargain pricing followed by major retailers, it preserved pricing, pushing
the brand proposal to ensure good quality, sustainable, pure Ceylon green tea at competitive
prices for consumers. The volume increase is also partially due to 2017/18, representing only
five-month estimates from MJF Teas since DCTC acquired its company in Nov. 2017.
Gross Profit Margin:
The gross profit margins improved dramatically from 39 per cent to 44 per cent from 2017/18 to
2018/19 due to currency appreciation as well as price control programs carried out during year
Annual Report of Dilmah. (2019).
Operating Expenses:
Administrative costs rose by 30% as well as sales and distribution by 38 percent. Costs for the
financing is nominal. High rates of cost awareness have curbed operating cost rising. Donation
amounting Rs. 170Mn (that was in 2017/18: Rs. 100Mn) to MJF Charitable Foundation and
increased tech amortization were main contributors to rise in operating expenses. Selling
& delivery or distribution expenss have risen substantially despite continuing developments in
developing the brand in more than 100 nations in which it works, the main Australia region,
where rivalry is challenge against other supermarket tea brands that are deeply embroiled in
discount marketing that sacrifice product quality. In conjunction with its vast array of retailers
and direct distribution customers, Company specializes in advertisement and promotion. Dilmah
ranks in world's top Five tea labels.
PBT and PAT:
Profits before tax rose significantly by 32 percent to Rs 1,694 million (that during 2017/18 was
Rs 1,281 million) and profits after tax by around 33 percent to Rs 1,591 million (which
during 2017/18 was around Rs 1,193 million). owing to first Schedule of Inland Revenues Act
No.24 of year 2017, from Year of Assessment: 2018/19, tax was estimated at higher tax
rate(%) of 14 percent (2017/18–10 percent) for firms primarily involved in export industry (80
percent).
Assets:
Aggregate assets rose by 10 percent to around Rs. 12,805 million, supported by 18 percent
increase in company's current assets, mainly attributable to currency deflation, by converting
USD / AUD reserves kept at the end of the year to LKR. While trade receivables rose by 9% to
Rs. 3,896 million at year ending, the corresponding rise in trade accounts
receivables denominated in USD were 2%.
Advances given and prepayments involve advances charged in USD for importation of
state-of-art tea-bagging equipment while cash equivalents are mainly fixed deposits and reserves
denominated by foreign currency. Non-current assets sank slightly to around Rs. 4.456 million,
backed by increased software depreciation & amortization.
Liquidity, Working Capital and Cash Flows:
The liquidity status of the DCTC is quite strong, with progress in the current ratio as well
as quick ratio, supported by account receivables and cash-funds and cash equivalents balances.
Cash funds grew by Rs. 870 million to Rs. 2.807 million by year end. Operating cash-flows rose
around 2.5 times to amount Rs. 1,608 million which in 2017/18 was Rs. 635 million arising
from increased performance, currency benefit achieved, inventory management including debt
recovery. Cash generated has been expended in capital investment that fosters potential growth,
and dividend-distribution.
Current Assets:
Inventories on reduced carrying raw materials as well as finished products declined by 10
per cent. Most supplies are purchased on order basis.
Accounts receivables constitute 30 per cent of overall assets. The higher valuation is due
to DCTC's business practices which are comparable to sector. Lead period to transfer and clear
⊘ This is a preview!⊘
Do you want full access?
Subscribe today to unlock all pages.
Trusted by 1+ million students worldwide
products abroad; and credit permitted to distributors and supermarkets generally determines
DCTC's credit policies. A stable debt recovery program focused on the implementation of a
systematic method of customer search, effective client relationship management including strict
debt control and tracking drives timely duties settlement. The considerably smaller growth in
exchange receivables at year-end, if compared with the rise in revenue, shows an effective credit
management.
Of gross pending trade receivables at year-ended, 38 percent (2017/18–48 percent) is overdue
from Dilmah Australia (Pty) Ltd, a corporation that handles Dilmah Tea's distribution and
promotions in Australia. Dilmah Australia's debts fall is due to better sales on the market.
Products to Dilmah Australian are subject to market terms. Both debts, including that of
associated persons, were considered for disability, and treated where appropriate with prudence
Bulgurcu, (2012).
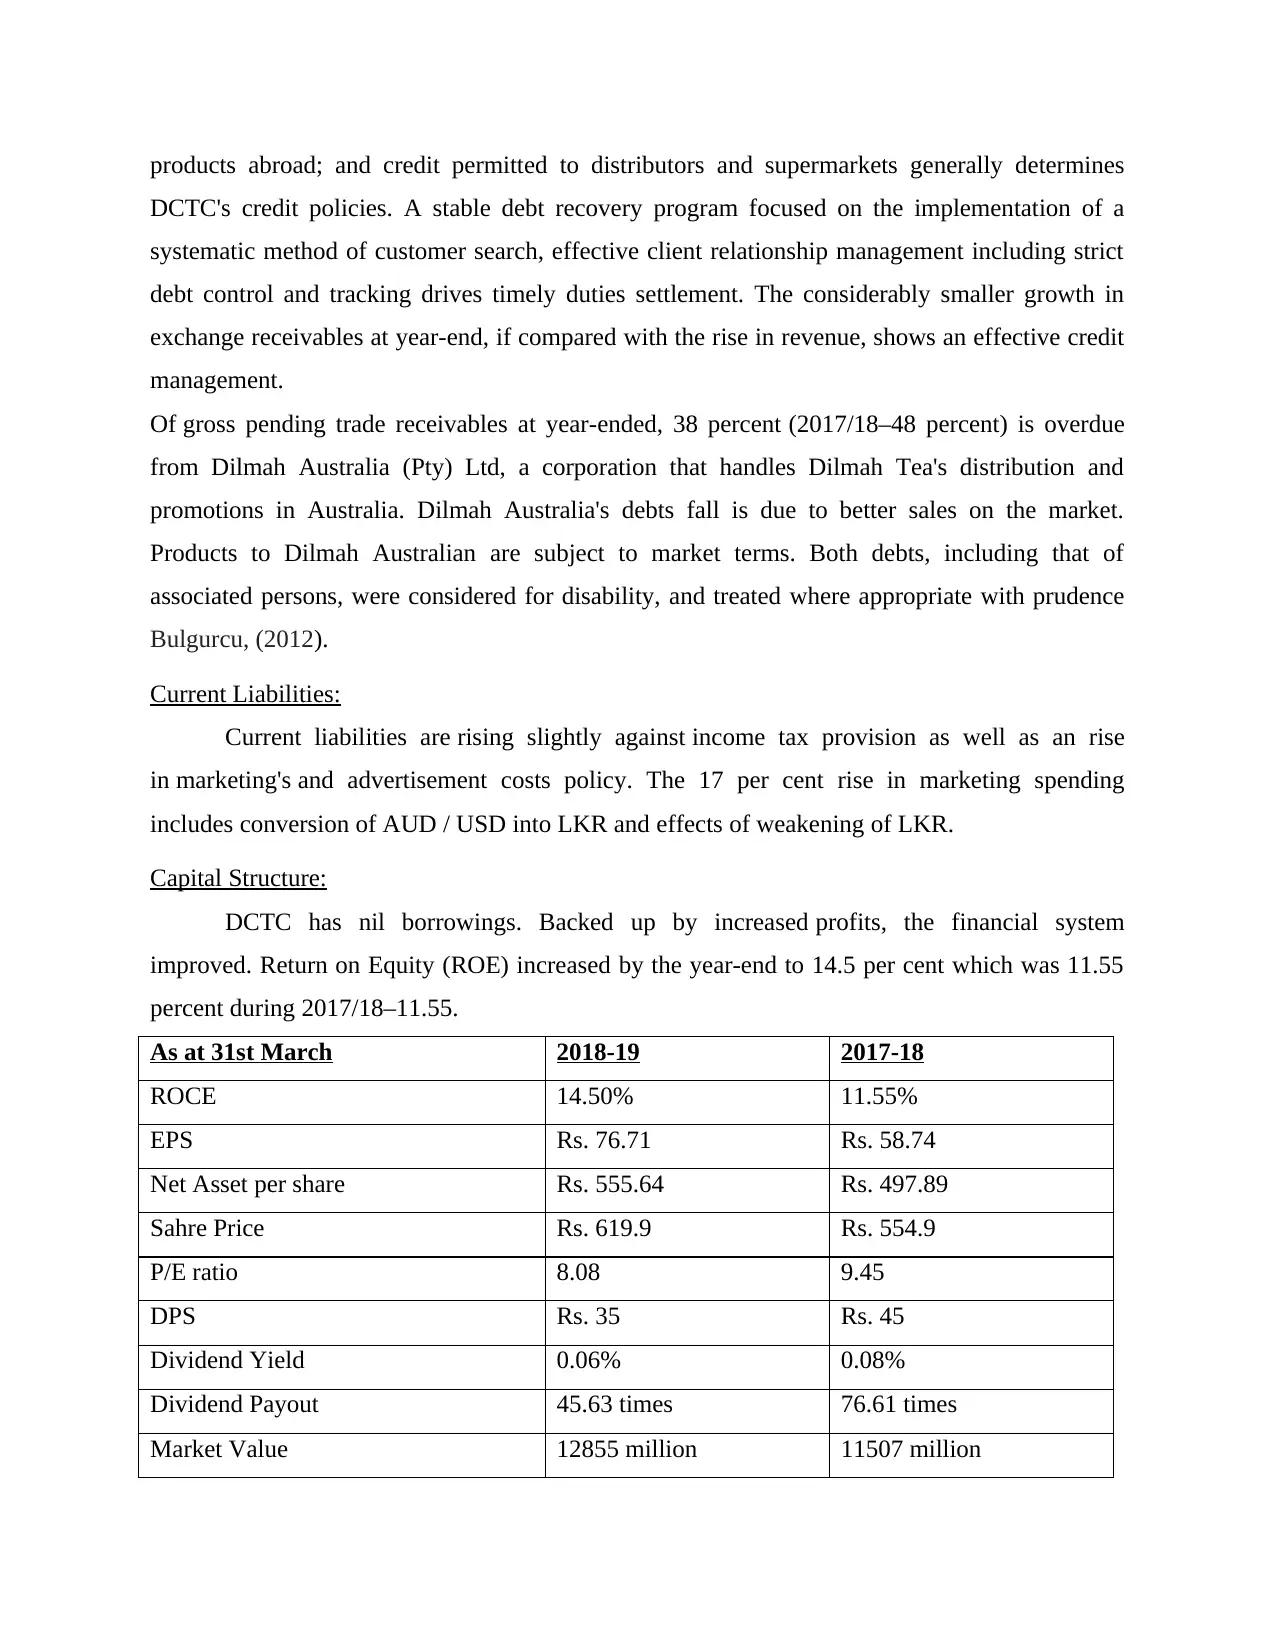
Current Liabilities:
Current liabilities are rising slightly against income tax provision as well as an rise
in marketing's and advertisement costs policy. The 17 per cent rise in marketing spending
includes conversion of AUD / USD into LKR and effects of weakening of LKR.
Capital Structure:
DCTC has nil borrowings. Backed up by increased profits, the financial system
improved. Return on Equity (ROE) increased by the year-end to 14.5 per cent which was 11.55
percent during 2017/18–11.55.
As at 31st March 2018-19 2017-18
ROCE 14.50% 11.55%
EPS Rs. 76.71 Rs. 58.74
Net Asset per share Rs. 555.64 Rs. 497.89
Sahre Price Rs. 619.9 Rs. 554.9
P/E ratio 8.08 9.45
DPS Rs. 35 Rs. 45
Dividend Yield 0.06% 0.08%
Dividend Payout 45.63 times 76.61 times
Market Value 12855 million 11507 million
DCTC's credit policies. A stable debt recovery program focused on the implementation of a
systematic method of customer search, effective client relationship management including strict
debt control and tracking drives timely duties settlement. The considerably smaller growth in
exchange receivables at year-end, if compared with the rise in revenue, shows an effective credit
management.
Of gross pending trade receivables at year-ended, 38 percent (2017/18–48 percent) is overdue
from Dilmah Australia (Pty) Ltd, a corporation that handles Dilmah Tea's distribution and
promotions in Australia. Dilmah Australia's debts fall is due to better sales on the market.
Products to Dilmah Australian are subject to market terms. Both debts, including that of
associated persons, were considered for disability, and treated where appropriate with prudence
Bulgurcu, (2012).
Current Liabilities:
Current liabilities are rising slightly against income tax provision as well as an rise
in marketing's and advertisement costs policy. The 17 per cent rise in marketing spending
includes conversion of AUD / USD into LKR and effects of weakening of LKR.
Capital Structure:
DCTC has nil borrowings. Backed up by increased profits, the financial system
improved. Return on Equity (ROE) increased by the year-end to 14.5 per cent which was 11.55
percent during 2017/18–11.55.
As at 31st March 2018-19 2017-18
ROCE 14.50% 11.55%
EPS Rs. 76.71 Rs. 58.74
Net Asset per share Rs. 555.64 Rs. 497.89
Sahre Price Rs. 619.9 Rs. 554.9
P/E ratio 8.08 9.45
DPS Rs. 35 Rs. 45
Dividend Yield 0.06% 0.08%
Dividend Payout 45.63 times 76.61 times
Market Value 12855 million 11507 million
Paraphrase This Document
Need a fresh take? Get an instant paraphrase of this document with our AI Paraphraser
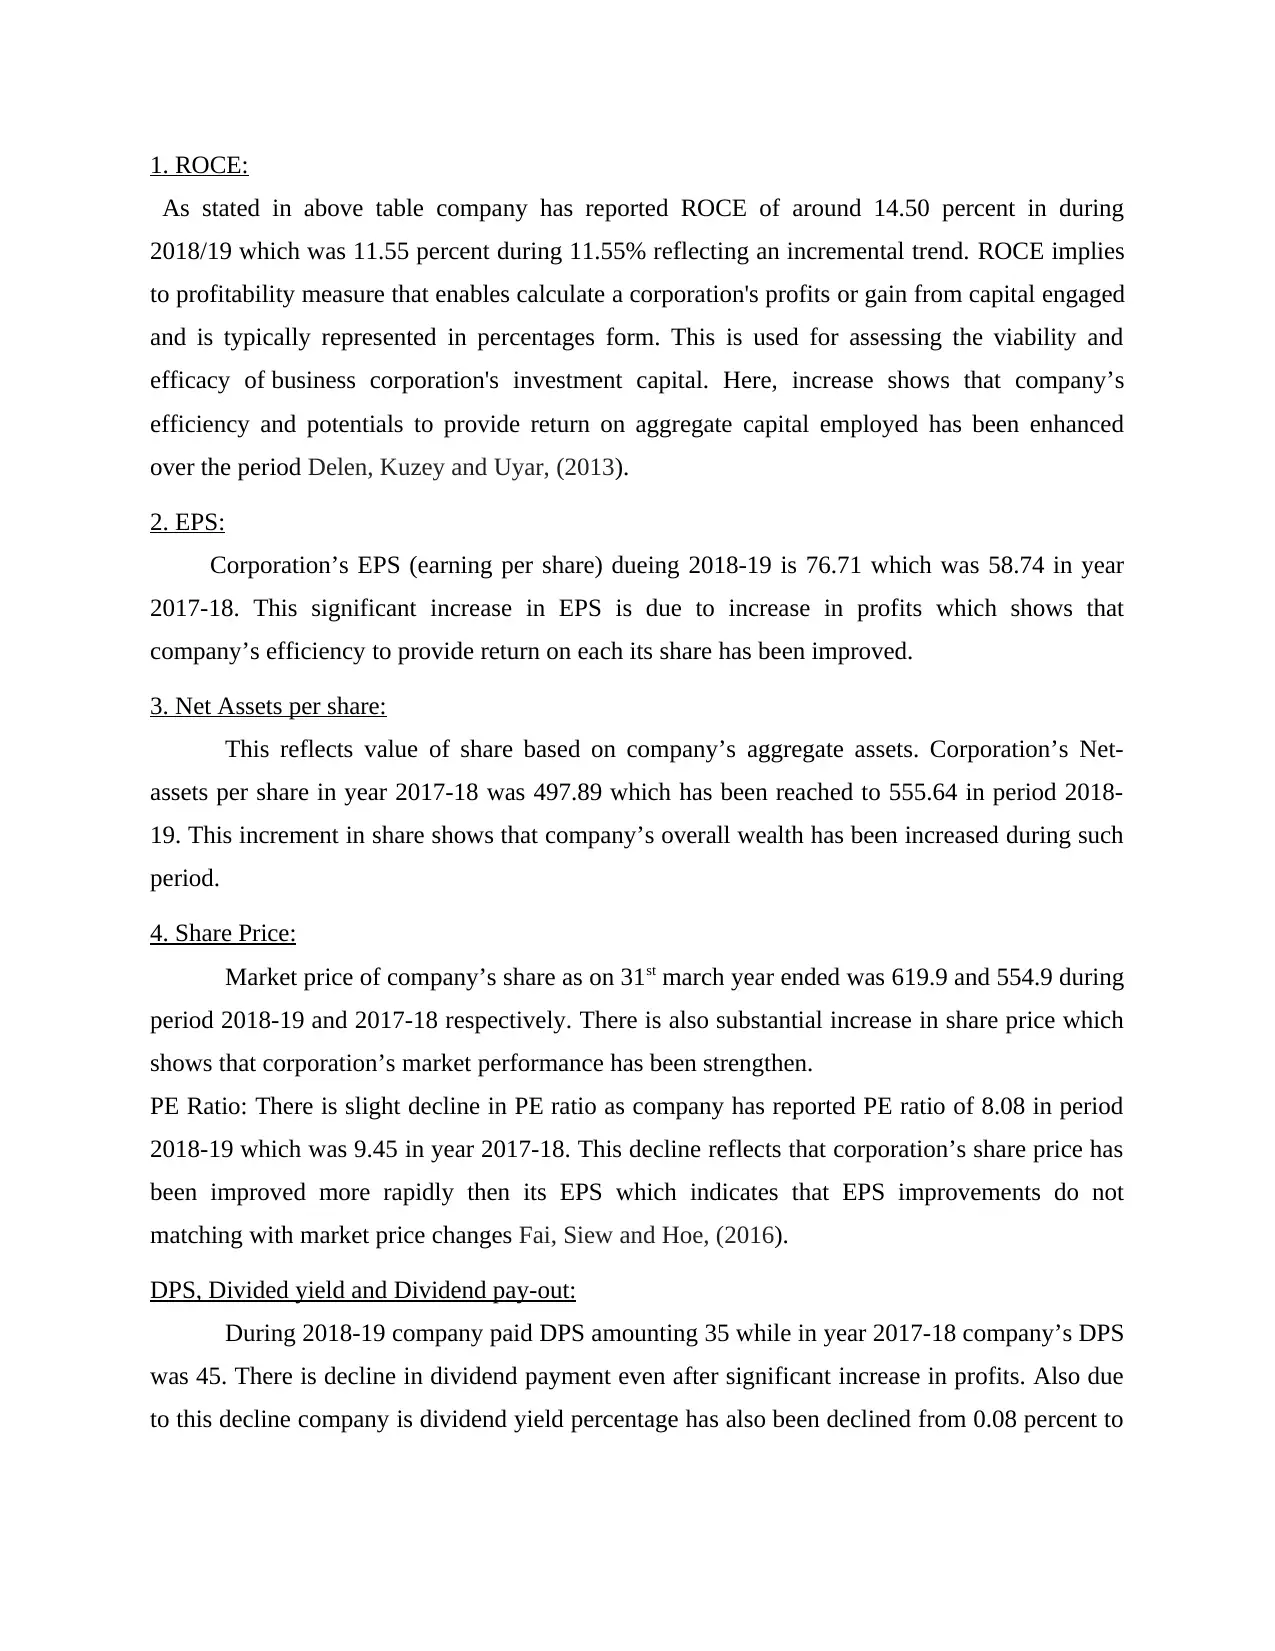
1. ROCE:
As stated in above table company has reported ROCE of around 14.50 percent in during
2018/19 which was 11.55 percent during 11.55% reflecting an incremental trend. ROCE implies
to profitability measure that enables calculate a corporation's profits or gain from capital engaged
and is typically represented in percentages form. This is used for assessing the viability and
efficacy of business corporation's investment capital. Here, increase shows that company’s
efficiency and potentials to provide return on aggregate capital employed has been enhanced
over the period Delen, Kuzey and Uyar, (2013).
2. EPS:
Corporation’s EPS (earning per share) dueing 2018-19 is 76.71 which was 58.74 in year
2017-18. This significant increase in EPS is due to increase in profits which shows that
company’s efficiency to provide return on each its share has been improved.
3. Net Assets per share:
This reflects value of share based on company’s aggregate assets. Corporation’s Net-
assets per share in year 2017-18 was 497.89 which has been reached to 555.64 in period 2018-
19. This increment in share shows that company’s overall wealth has been increased during such
period.
4. Share Price:
Market price of company’s share as on 31st march year ended was 619.9 and 554.9 during
period 2018-19 and 2017-18 respectively. There is also substantial increase in share price which
shows that corporation’s market performance has been strengthen.
PE Ratio: There is slight decline in PE ratio as company has reported PE ratio of 8.08 in period
2018-19 which was 9.45 in year 2017-18. This decline reflects that corporation’s share price has
been improved more rapidly then its EPS which indicates that EPS improvements do not
matching with market price changes Fai, Siew and Hoe, (2016).
DPS, Divided yield and Dividend pay-out:
During 2018-19 company paid DPS amounting 35 while in year 2017-18 company’s DPS
was 45. There is decline in dividend payment even after significant increase in profits. Also due
to this decline company is dividend yield percentage has also been declined from 0.08 percent to
0.06 percent. While dividend pay-out ratio of company is 46.63 during 2018-19 which was 76.61
times during 2017-18.
Market Value:
This is total market cap of company based on current market price of its shares.
Corporation’s market value in year 2017/18 was 11507 million which has been reached to 12855
million with an increment of 11.71 percent. This increase shows that corporation is performance
in Tea industry is continuously growing. This significant increase in market value is indicates
that in coming future also company will achieve growth.
Dividend Policy:
Dividend policy of Company aims to meet shareholder desires by ensuring adequate capital is
available for expected growth of the corporation Fu, Kraft and Zhang, (2012). The Company has
therefore paid interim dividend at Rs. 20/-each share as well as is offering final dividend at Rs.
15/-per share with respect to 2018/19 fiscal year.
Capital Value Addition:
Capital spending amounting to Rs. 305 million for period is under review, comprising of
new acquisitions and routine maintenance of produced capital. Company started development
during year of a completely automated factory fitted with robotic system control of
artificial intelligent (AI) and state-of - the-art equipment such as tea bagging devices. With an
estimated cumulative expenditure around Rs. 1,000 million, this is projected that the factory will
address the projected shortfall of manpower and resources, thus reducing manual output
mistakes.
CONCLUSION
From above study it has been articulated that Financial management is quite essential for
thorough analysis of corporation. In a corporate world financial management is regular practice.
This includes controlling the financial capital of a business to ensure inefficiency is minimal or
low. This governs any single aspect involving the financial operations of the company that
covers the acquisition of money, the utilization of money, transfers, accounting, risk
management and other items related to financing. Overall analysis of Dilham shows that
company’s financial position is quite strong and currently company can expand their business
into dairy products.
⊘ This is a preview!⊘
Do you want full access?
Subscribe today to unlock all pages.
Trusted by 1+ million students worldwide
REFERENCES
Books and Journals:
Mien, N.T.N. and Thao, T.P., (2015), July. Factors affecting personal financial management
behaviors: evidence from vietnam. In Proceedings of the Second Asia-Pacific
Conference on Global Business, Economics, Finance and Social Sciences
(AP15Vietnam Conference) (pp. 10-12).
Golin, J. and Delhaise, P., (2013). The bank credit analysis handbook: a guide for analysts,
bankers and investors. John Wiley & Sons.
Bulgurcu, B.K., (2012). Application of TOPSIS technique for financial performance evaluation
of technology firms in Istanbul stock exchange market. Procedia-Social and Behavioral
Sciences, 62. pp. 1033-1040.
Delen, D., Kuzey, C. and Uyar, A., (2013). Measuring firm performance using financial ratios: A
decision tree approach. Expert Systems with Applications, 40(10), pp.3970-3983.
Fai, L.K., Siew, L.W. and Hoe, L.W., (2016). Financial analysis on the company performance in
Malaysia with multi-criteria decision making model. Systems Science and Applied
Mathematics. 1(1). pp. 1-7.
Fu, R., Kraft, A. and Zhang, H., (2012). Financial reporting frequency, information asymmetry,
and the cost of equity. Journal of Accounting and Economics. 54(2-3). pp.132-149.
Online:
Annual Report of Dilmah. (2019). [Online]. Available through:
<https://www.dilmahtea.com/sustainability/pdf/dilmah-ceylon-tea-company-plc-annual-
report-2018-19>
About us: Dilmah. (2019). [Online]. Available through: <https://www.dilmahtea.com/dilmah-tea-
company/founders-message.html>
1 out of 10
Related Documents


Your All-in-One AI-Powered Toolkit for Academic Success.
+13062052269
info@desklib.com
Available 24*7 on WhatsApp / Email
![[object Object]](/_next/static/media/star-bottom.7253800d.svg)
Unlock your academic potential
Copyright © 2020–2026 A2Z Services. All Rights Reserved. Developed and managed by ZUCOL.