Financial Decision Making, Performance Analysis, and Investment Report
VerifiedAdded on 2023/03/29
|23
|4571
|320
Report
AI Summary
This report provides a comprehensive analysis of the financial decision-making processes within Dining Group PLC, a UK-based company. It begins with a detailed business performance analysis, evaluating the company's financial statements using ratio analysis to assess profitability, liquidity, and debt-equity ratios. The analysis reveals a decline in profit-earning capacity in 2016 compared to 2015, despite revenue increases, indicating challenges in cost management. The report also examines the company's liquidity position, highlighting the need for improvements. Furthermore, the report includes an investment appraisal, evaluating a proposed investment of 120,000 million pounds, and assesses the company's average rate of return, net present value, and total cost of capital. Finally, the report recommends potential sources of funds for raising 100 million pounds and discusses non-financial factors that the board of directors should consider.
FINANCIAL DECISION
MAKING
MAKING
Paraphrase This Document
Need a fresh take? Get an instant paraphrase of this document with our AI Paraphraser
TABLE OF CONTENTS
PART 1............................................................................................................................................1
BUSINESS PERFORMANCE ANALYSIS..............................................................................1
PART 2..........................................................................................................................................12
INVESTMENT APPRAISAL..................................................................................................12
CONCLUSION..............................................................................................................................15
APPENDICES ..............................................................................................................................17
REFERENCES..............................................................................................................................18
EXECUTIVE SUMMARY
In order to have desirable profits and to attain organisational goals and objectives,
management of an organisation has to take various financial decisions during a financial year.
The report provides information regarding financial decision making of Dining group plc that is
based in UK. Its overall business performance has been analysed by its financial statements
using ratio analysis techniques that shows following results. Liquid position of the cited firm is
not good and has increased more of its finance through bank loan and other creditors. It has also
been determined that profit earning capacity of the company has been declined in 2016 than
2015. Operating cycle of the business is 16 days. Further, for making more investments, directors
have provided investment appraisal information that has been critically evaluated. Dining group
plc initial investment is 120000 million pound. During first year it will receive 20800 million
pound, same as last year it will receive 43200 million pound. Company's average rate of return is
11.2% and average annual profit was 6694 million pound. It was found that company's net
present value is 16% and total cost of capital is 3% and cited firm has an investment target
criterion of 12%. At last, sources of funds that can be used by Dining Group plc for raising funds
of 100 m has been recommended along with other non-financial factors that its board of directors
must consider.
⊘ This is a preview!⊘
Do you want full access?
Subscribe today to unlock all pages.
Trusted by 1+ million students worldwide
PART 1
BUSINESS PERFORMANCE ANALYSIS
In order to measure and manage quantifiable achievements of an organisation, various
methodologies, processes, measurements and techniques are used by the management is
considered as a business performance analysis (Allan and et.al., 2015). Here, the performance of
Dining Group plc is undertaken by analysing and interpreting its financial statements using ratio
analysis technique.
Statement of Profit and Loss
Statement of profit and loss shows the profit earning capacity of the business along with
overall spendings in a financial year. Through what ways dining group plc is generating income
can be determined by analysing profit and loss statement (Authority, 2014). Income statement
includes various expenditure made during the year, revenues generated and profit earned or loss
suffered by the company during a specific period.
As per the profit and loss statement of Dining Group plc, it has been analysed that, in
2016, profit earned by firm is 29099, while in 2015, firm earned profit of 68875. This shows that,
the earning capacity of the company has reduced. However, revenues has been increased by
approximately 37% along with the increase in cost of sales by approximate 14%. In year 2016,
firm has also generated income from sale of plant property and equipment. Furthermore, finance
cost and taxation expenses in 2016 is also less than that of 2015. Thus, the only reason due to
which profit of Dining Group plc has been declined in 2016 is increase in proportion of revenue
to cost of sales. Factors that facilitated increment in revenue of the company may be increase in
the percentage of tourists in UK in 2016, or decline in competitors. While, factors that have
caused increase in cost of sales could be increase in staff and their salaries, increase in the cost of
accommodation facilities or high food material cost.
Moreover, for further analysis of company's profitability, profitable ratios such gross
profit ratio, operating profit ratio and net profit ratio has been calculated below. (APPENDIX 1)
Gross Profit ratio:
1
Paraphrase This Document
Need a fresh take? Get an instant paraphrase of this document with our AI Paraphraser
Gross profit ratio determines ability of company to earn profit after spending all the direct
cost associated to primary services (Bas, 2013). It considers cost of goods sold to profit
percentage. Therefore, the main components required for determining gross profit margin of
Dining Group plc are gross profit earned during 2015 and 2016 and revenue generated during the
period. It is the initial profit earning stage of the company.
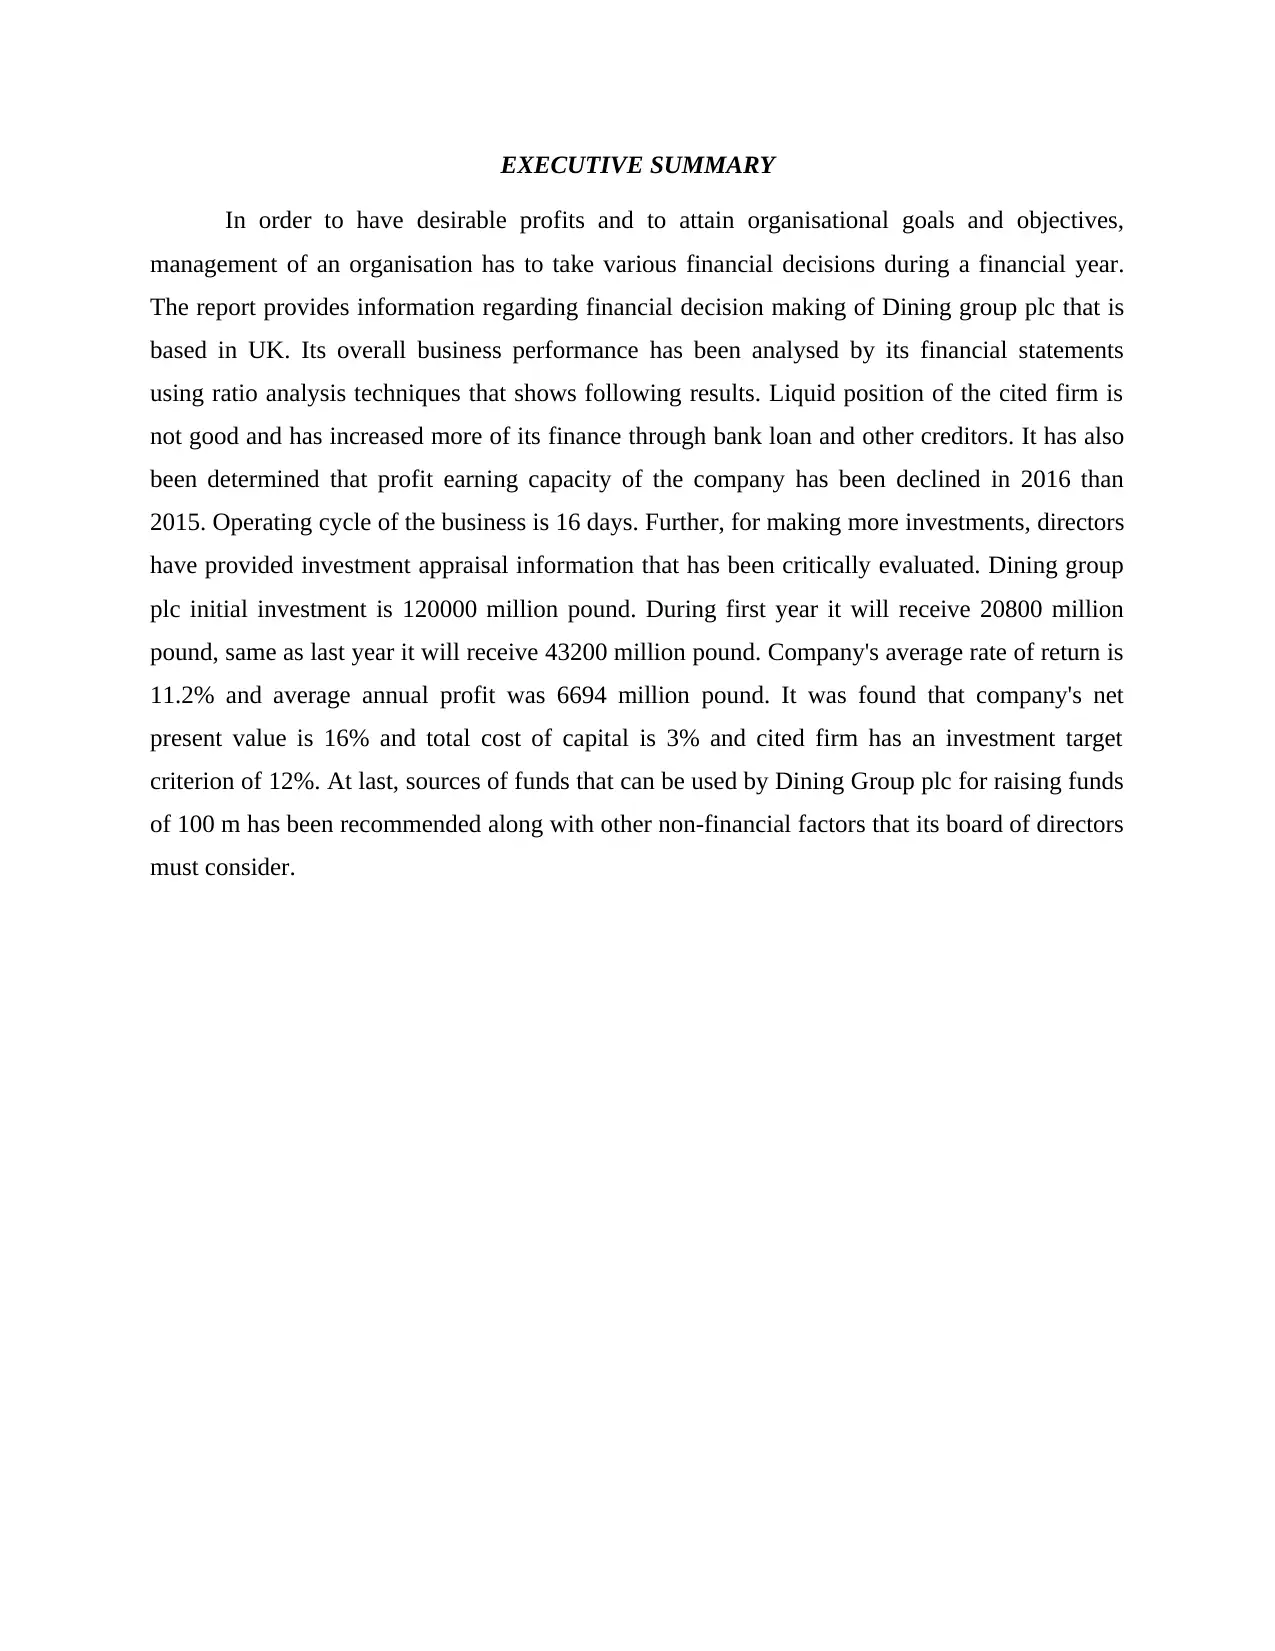
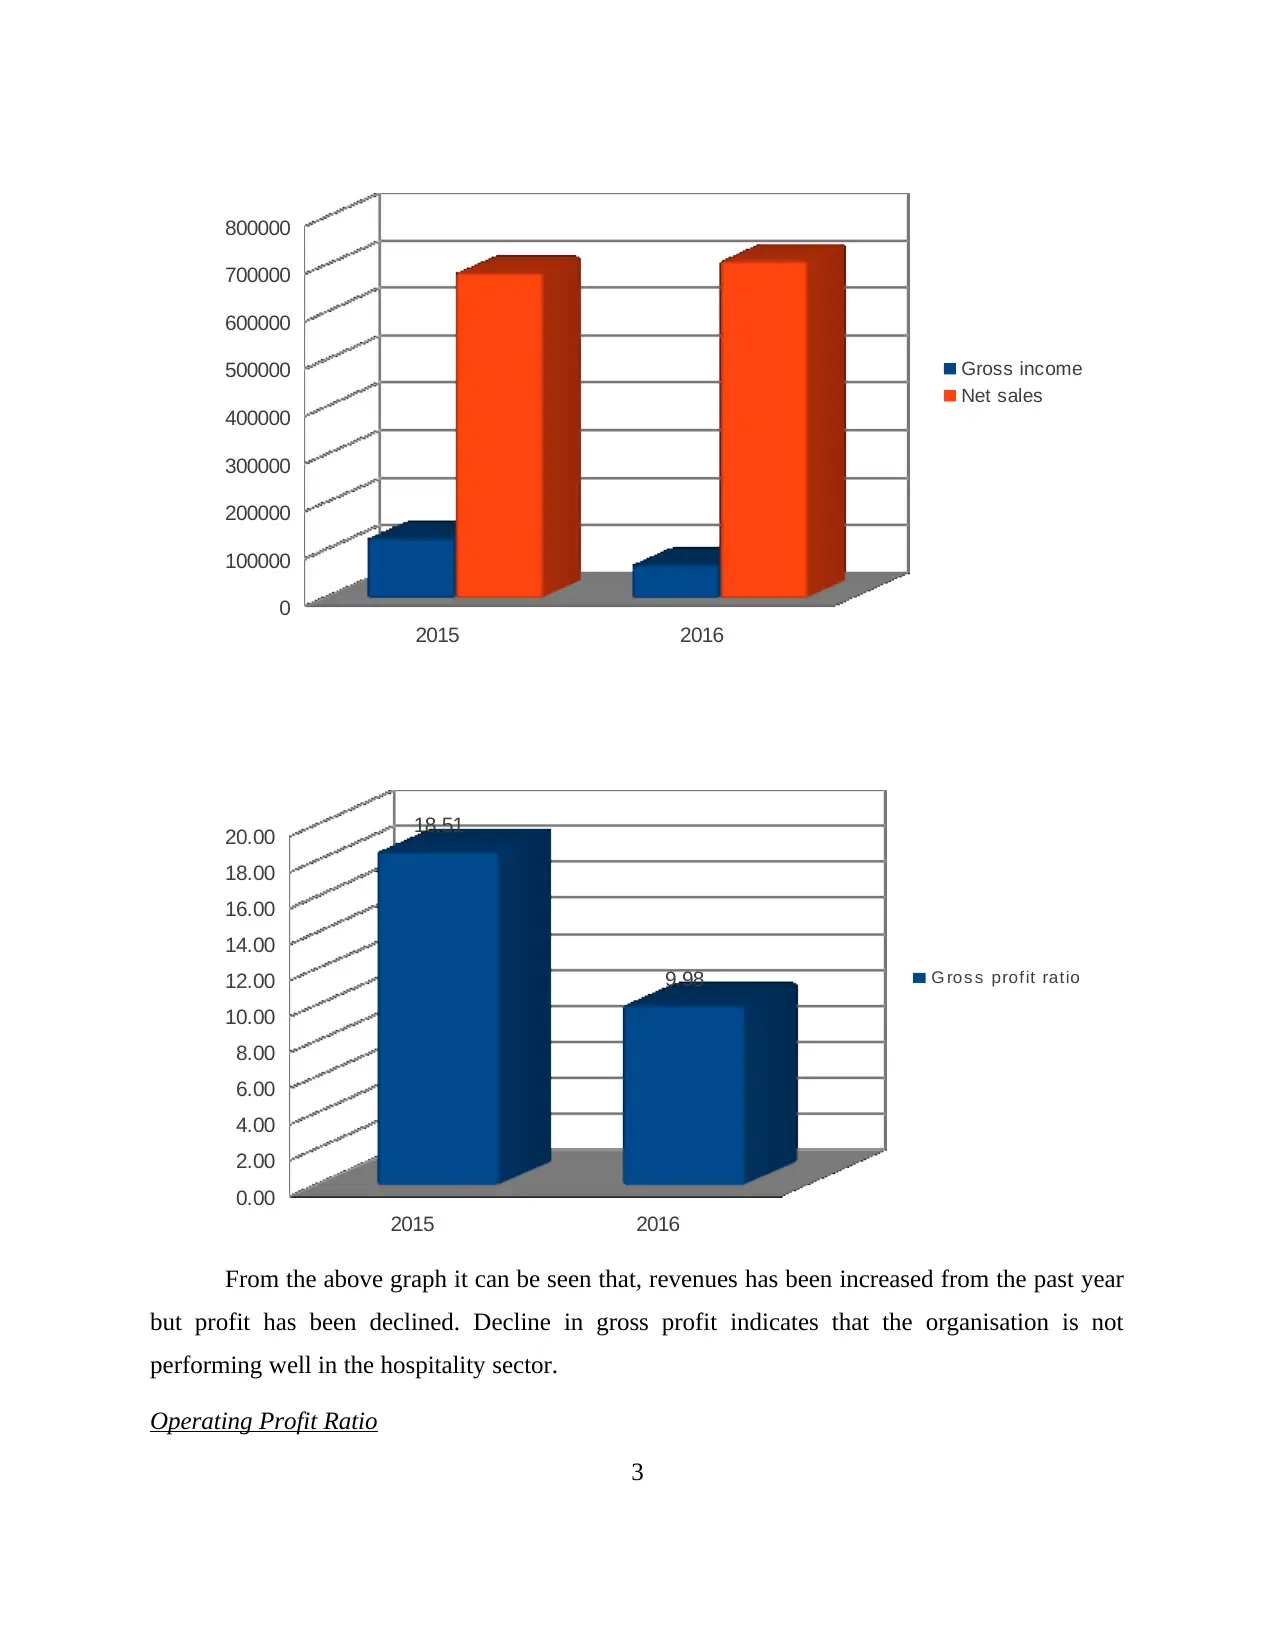
Gross profit ratio of Dining Group plc in 2015 is 18.51%, while in 2016 is 9.98%. This
means that the firm's efficiency to earn profit has been declined in 2016. This is due to the
increased cost of sales. In order to increase revenue, did not effectively maintained its cost of
providing services which lead to decline in profit percentage. (APPENDIX 1)
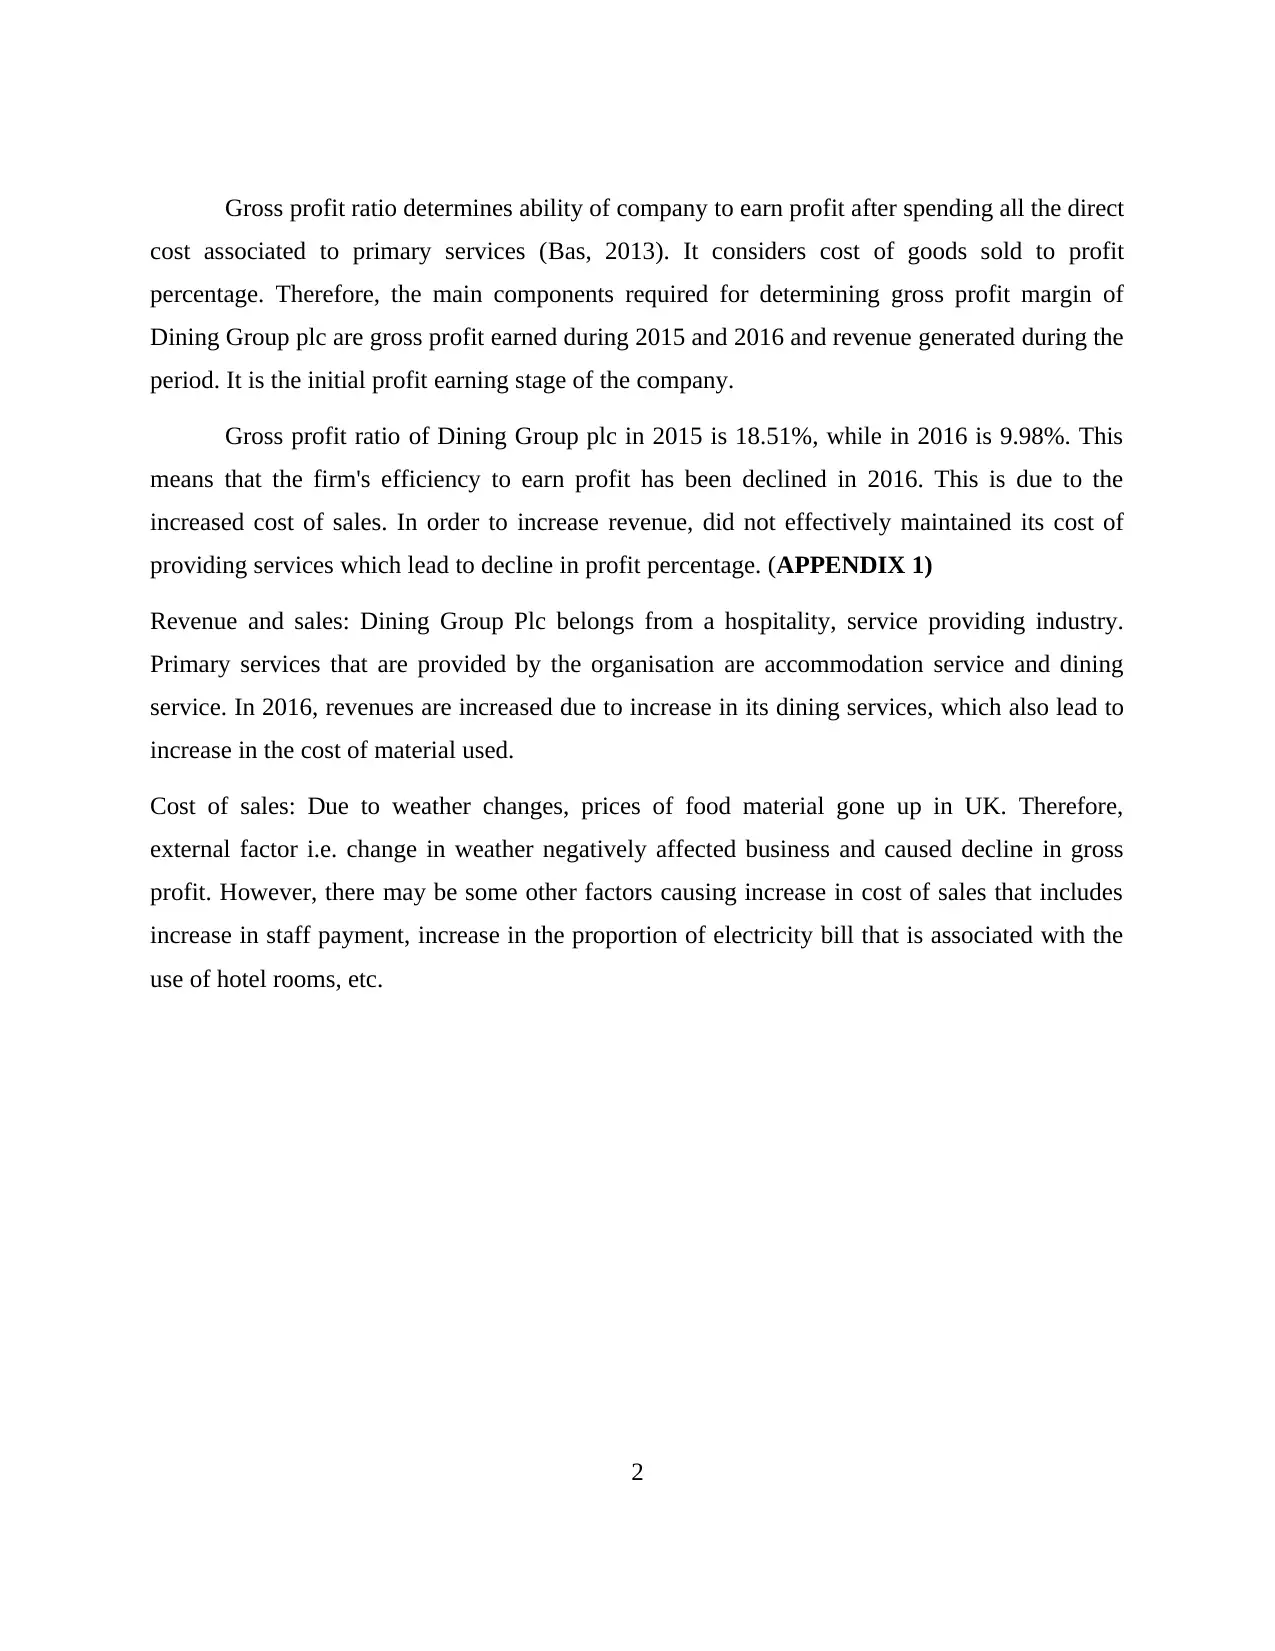
Revenue and sales: Dining Group Plc belongs from a hospitality, service providing industry.
Primary services that are provided by the organisation are accommodation service and dining
service. In 2016, revenues are increased due to increase in its dining services, which also lead to
increase in the cost of material used.
Cost of sales: Due to weather changes, prices of food material gone up in UK. Therefore,
external factor i.e. change in weather negatively affected business and caused decline in gross
profit. However, there may be some other factors causing increase in cost of sales that includes
increase in staff payment, increase in the proportion of electricity bill that is associated with the
use of hotel rooms, etc.
2
cost associated to primary services (Bas, 2013). It considers cost of goods sold to profit
percentage. Therefore, the main components required for determining gross profit margin of
Dining Group plc are gross profit earned during 2015 and 2016 and revenue generated during the
period. It is the initial profit earning stage of the company.
Gross profit ratio of Dining Group plc in 2015 is 18.51%, while in 2016 is 9.98%. This
means that the firm's efficiency to earn profit has been declined in 2016. This is due to the
increased cost of sales. In order to increase revenue, did not effectively maintained its cost of
providing services which lead to decline in profit percentage. (APPENDIX 1)
Revenue and sales: Dining Group Plc belongs from a hospitality, service providing industry.
Primary services that are provided by the organisation are accommodation service and dining
service. In 2016, revenues are increased due to increase in its dining services, which also lead to
increase in the cost of material used.
Cost of sales: Due to weather changes, prices of food material gone up in UK. Therefore,
external factor i.e. change in weather negatively affected business and caused decline in gross
profit. However, there may be some other factors causing increase in cost of sales that includes
increase in staff payment, increase in the proportion of electricity bill that is associated with the
use of hotel rooms, etc.
2
2015 2016
0
100000
200000
300000
400000
500000
600000
700000
800000
2015 2016
0.00
2.00
4.00
6.00
8.00
10.00
12.00
14.00
16.00
18.00
20.00 18.51
9.98
From the above graph it can be seen that, revenues has been increased from the past year
but profit has been declined. Decline in gross profit indicates that the organisation is not
performing well in the hospitality sector.
Operating Profit Ratio
3
Gross income
Net sales
G ros s profit ratio
⊘ This is a preview!⊘
Do you want full access?
Subscribe today to unlock all pages.
Trusted by 1+ million students worldwide
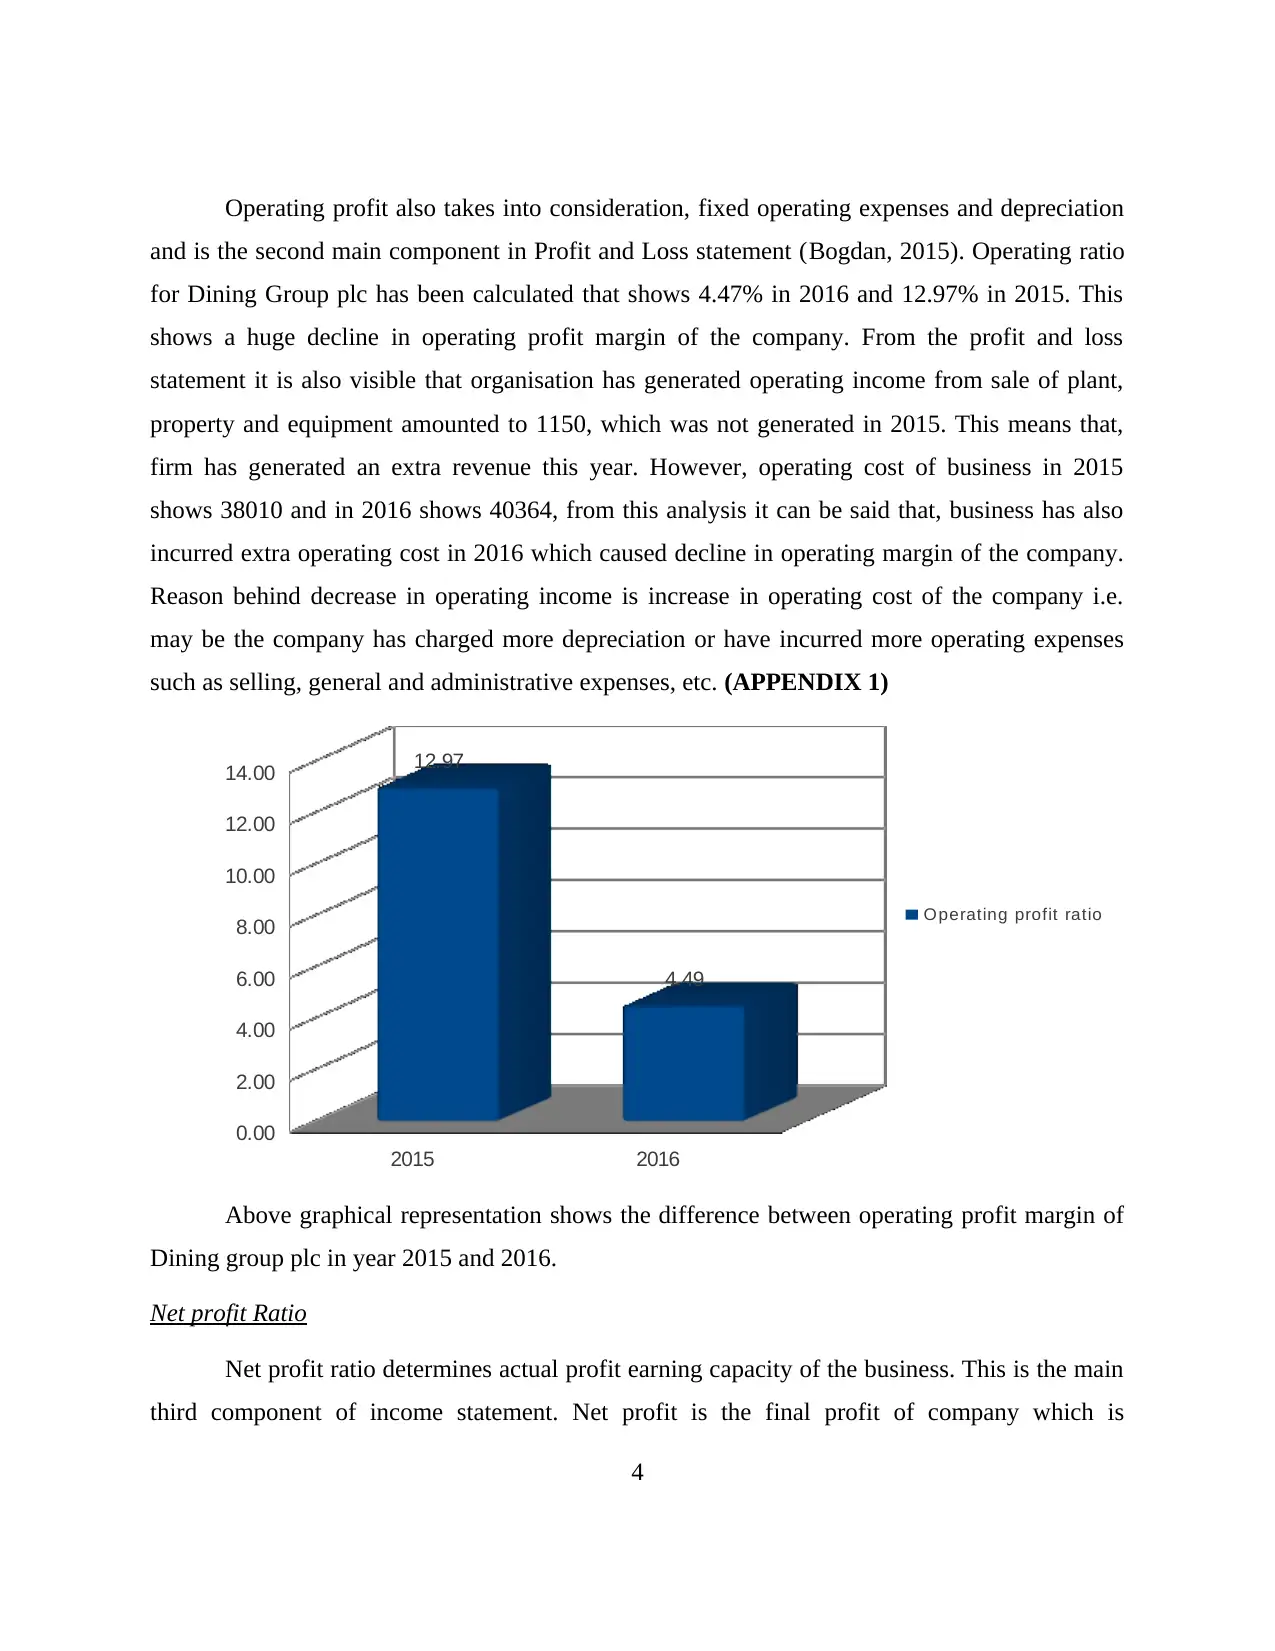
Operating profit also takes into consideration, fixed operating expenses and depreciation
and is the second main component in Profit and Loss statement (Bogdan, 2015). Operating ratio
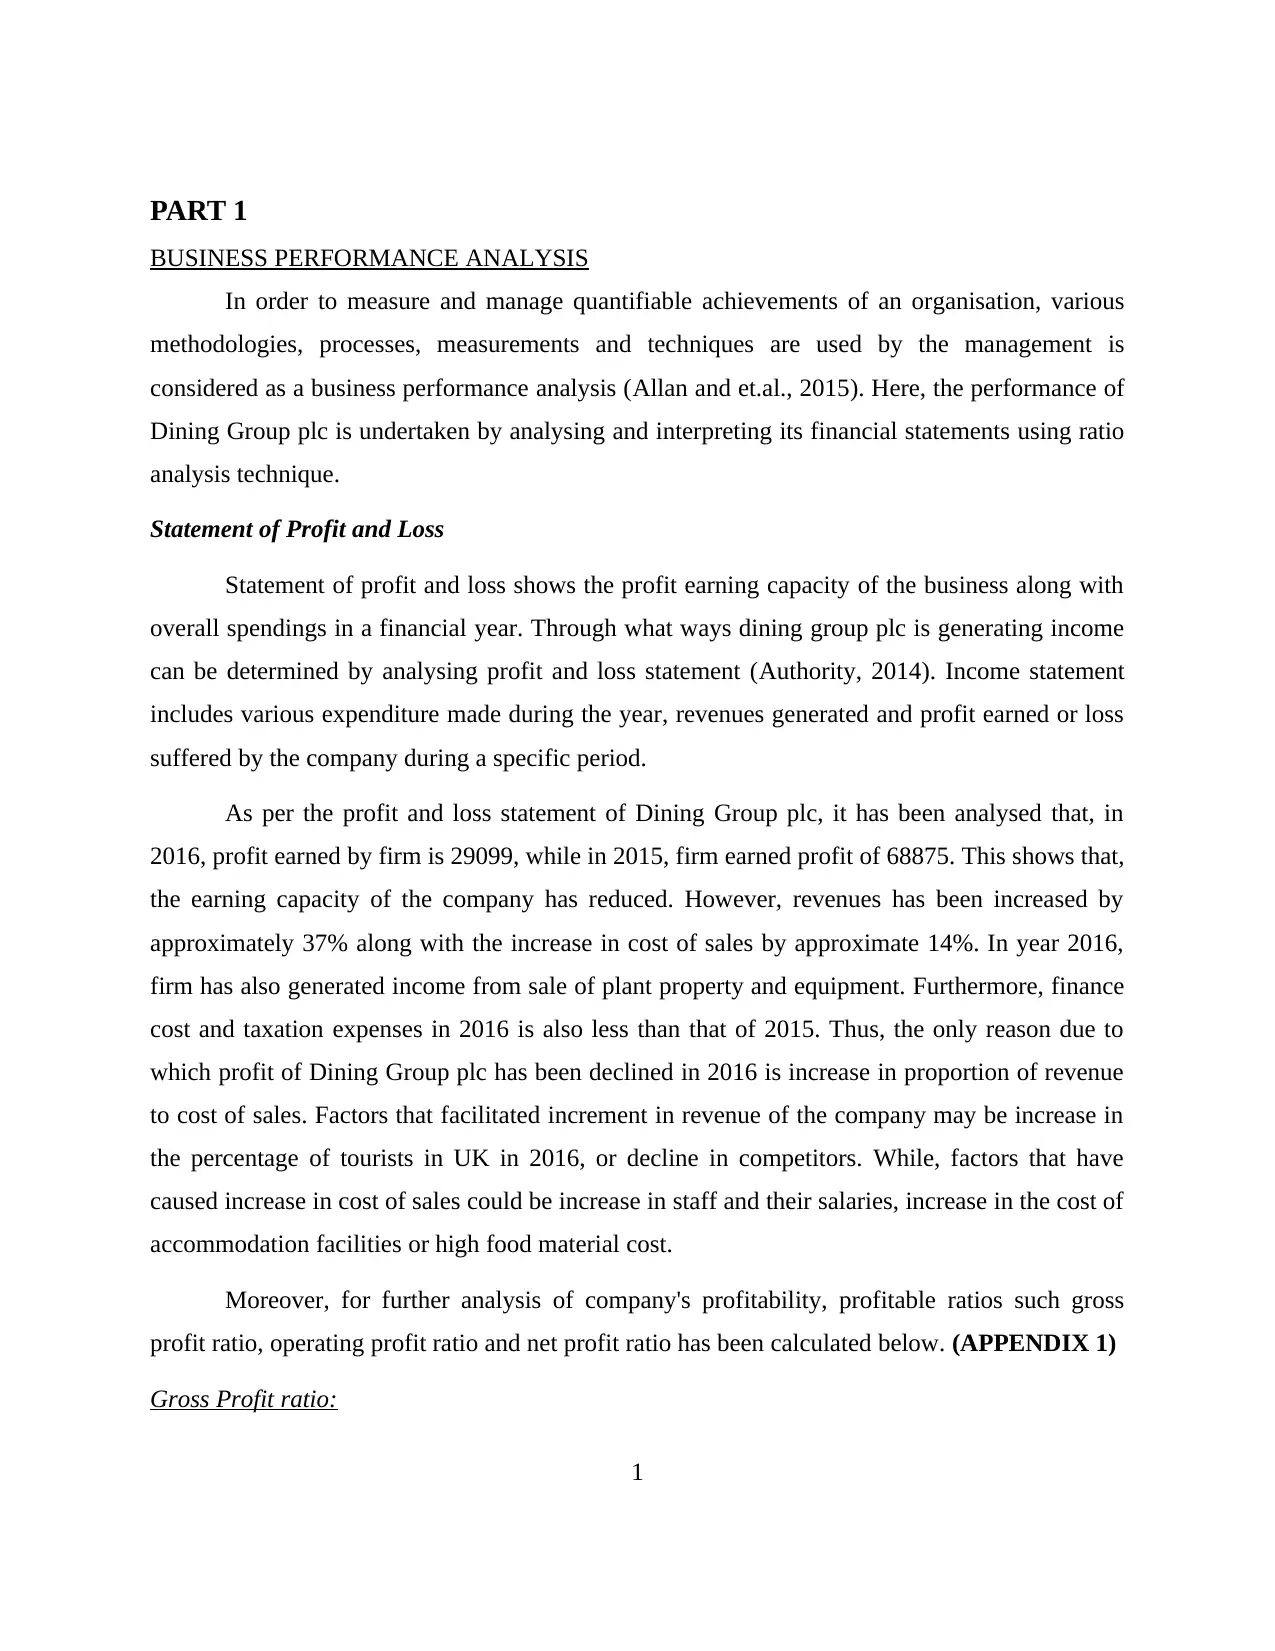
for Dining Group plc has been calculated that shows 4.47% in 2016 and 12.97% in 2015. This
shows a huge decline in operating profit margin of the company. From the profit and loss
statement it is also visible that organisation has generated operating income from sale of plant,
property and equipment amounted to 1150, which was not generated in 2015. This means that,
firm has generated an extra revenue this year. However, operating cost of business in 2015
shows 38010 and in 2016 shows 40364, from this analysis it can be said that, business has also
incurred extra operating cost in 2016 which caused decline in operating margin of the company.
Reason behind decrease in operating income is increase in operating cost of the company i.e.
may be the company has charged more depreciation or have incurred more operating expenses
such as selling, general and administrative expenses, etc. (APPENDIX 1)
2015 2016
0.00
2.00
4.00
6.00
8.00
10.00
12.00
14.00 12.97
4.49
Above graphical representation shows the difference between operating profit margin of
Dining group plc in year 2015 and 2016.
Net profit Ratio
Net profit ratio determines actual profit earning capacity of the business. This is the main
third component of income statement. Net profit is the final profit of company which is
4
O perating profit ratio
and is the second main component in Profit and Loss statement (Bogdan, 2015). Operating ratio
for Dining Group plc has been calculated that shows 4.47% in 2016 and 12.97% in 2015. This
shows a huge decline in operating profit margin of the company. From the profit and loss
statement it is also visible that organisation has generated operating income from sale of plant,
property and equipment amounted to 1150, which was not generated in 2015. This means that,
firm has generated an extra revenue this year. However, operating cost of business in 2015
shows 38010 and in 2016 shows 40364, from this analysis it can be said that, business has also
incurred extra operating cost in 2016 which caused decline in operating margin of the company.
Reason behind decrease in operating income is increase in operating cost of the company i.e.
may be the company has charged more depreciation or have incurred more operating expenses
such as selling, general and administrative expenses, etc. (APPENDIX 1)
2015 2016
0.00
2.00
4.00
6.00
8.00
10.00
12.00
14.00 12.97
4.49
Above graphical representation shows the difference between operating profit margin of
Dining group plc in year 2015 and 2016.
Net profit Ratio
Net profit ratio determines actual profit earning capacity of the business. This is the main
third component of income statement. Net profit is the final profit of company which is
4
O perating profit ratio
Paraphrase This Document
Need a fresh take? Get an instant paraphrase of this document with our AI Paraphraser
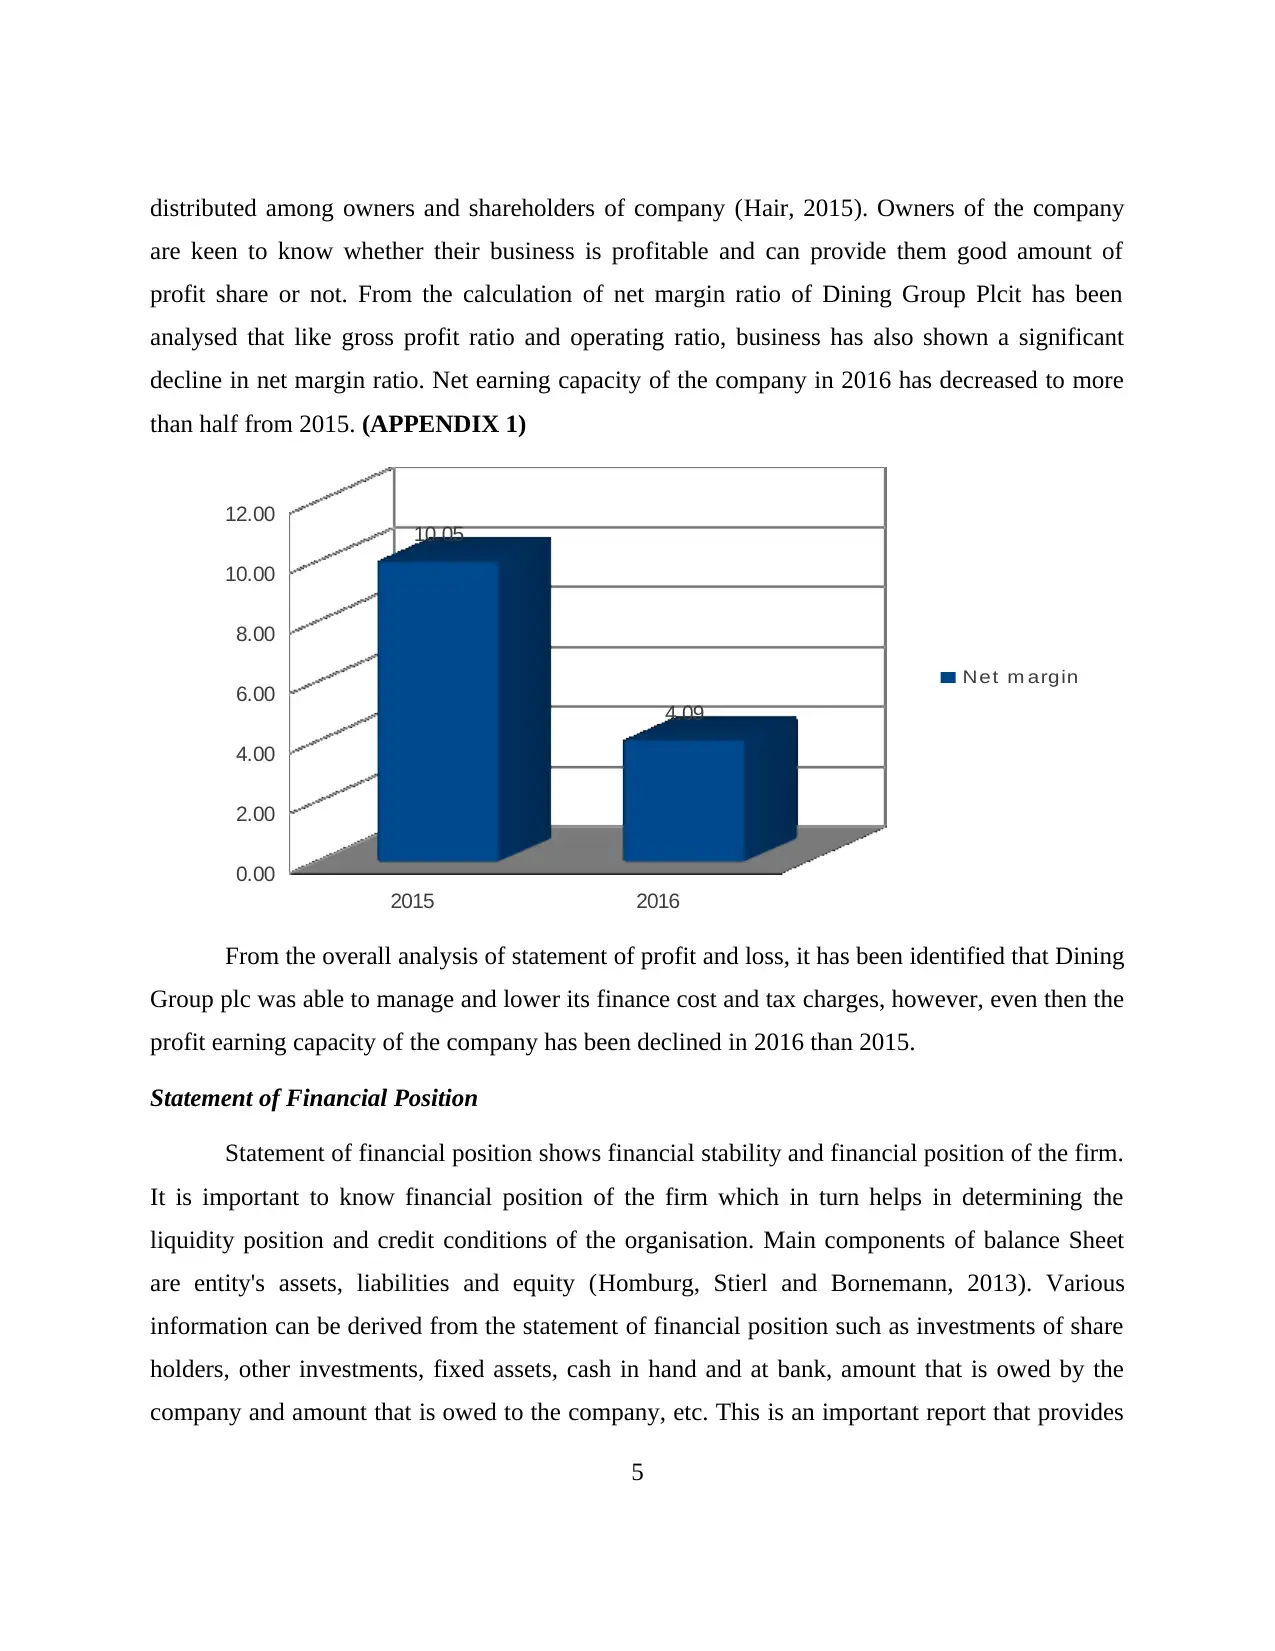
distributed among owners and shareholders of company (Hair, 2015). Owners of the company
are keen to know whether their business is profitable and can provide them good amount of
profit share or not. From the calculation of net margin ratio of Dining Group Plcit has been
analysed that like gross profit ratio and operating ratio, business has also shown a significant
decline in net margin ratio. Net earning capacity of the company in 2016 has decreased to more
than half from 2015. (APPENDIX 1)
2015 2016
0.00
2.00
4.00
6.00
8.00
10.00
12.00 10.05
4.09
From the overall analysis of statement of profit and loss, it has been identified that Dining
Group plc was able to manage and lower its finance cost and tax charges, however, even then the
profit earning capacity of the company has been declined in 2016 than 2015.
Statement of Financial Position
Statement of financial position shows financial stability and financial position of the firm.
It is important to know financial position of the firm which in turn helps in determining the
liquidity position and credit conditions of the organisation. Main components of balance Sheet
are entity's assets, liabilities and equity (Homburg, Stierl and Bornemann, 2013). Various
information can be derived from the statement of financial position such as investments of share
holders, other investments, fixed assets, cash in hand and at bank, amount that is owed by the
company and amount that is owed to the company, etc. This is an important report that provides
5
Net m argin
relevant information to the external users of firm that significantly affects their decisions. It
includes calculating ratios like; profitability, liquidity, efficiency, debt equity ratios and so on. In
addition to this, comparison between last years' performances of entity and with other
competitive organisations are also interpreted. Here, financial position of the Dining Group plc is
analysed by calculating some financial performance ratios. (APPENDIX 2)
Current Ratio
Current ratio is one of the main ratio under liquidity ratio. It is calculated to determine the
liquidity position of an organisation (Hottenrott and Lopes‐Bento, 2016). It helps external users
of financial statement of the company, information regarding, whether the company have enough
liquid resources i.e. cash resources that will enable business in paying off its short term
obligation. Short-term obligations refers to the payments that firm had to pay within a period of 1
year or less. Ideal current ratio that a company supposed to have is 2:1. Main components of
current ratio includes current assets and current liabilities of the entity.
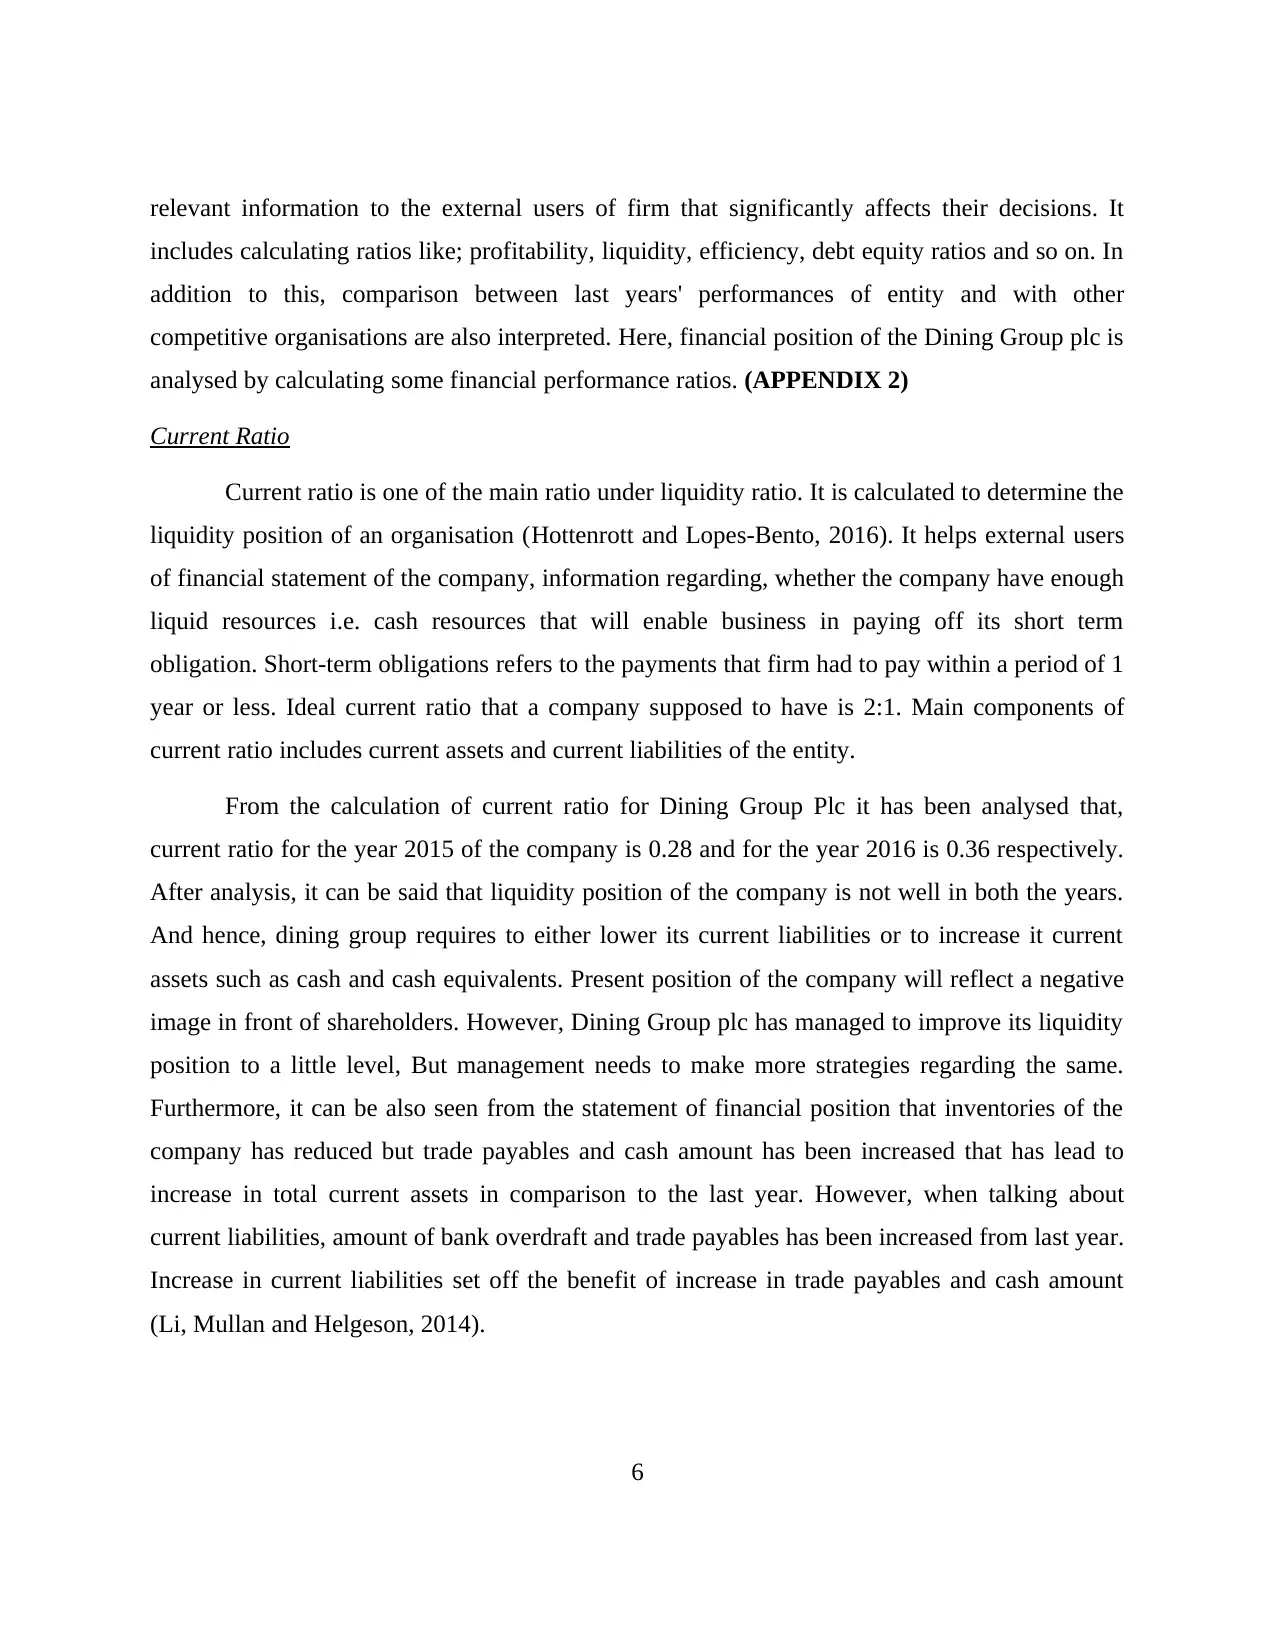
From the calculation of current ratio for Dining Group Plc it has been analysed that,
current ratio for the year 2015 of the company is 0.28 and for the year 2016 is 0.36 respectively.
After analysis, it can be said that liquidity position of the company is not well in both the years.
And hence, dining group requires to either lower its current liabilities or to increase it current
assets such as cash and cash equivalents. Present position of the company will reflect a negative
image in front of shareholders. However, Dining Group plc has managed to improve its liquidity
position to a little level, But management needs to make more strategies regarding the same.
Furthermore, it can be also seen from the statement of financial position that inventories of the
company has reduced but trade payables and cash amount has been increased that has lead to
increase in total current assets in comparison to the last year. However, when talking about
current liabilities, amount of bank overdraft and trade payables has been increased from last year.
Increase in current liabilities set off the benefit of increase in trade payables and cash amount
(Li, Mullan and Helgeson, 2014).
6
includes calculating ratios like; profitability, liquidity, efficiency, debt equity ratios and so on. In
addition to this, comparison between last years' performances of entity and with other
competitive organisations are also interpreted. Here, financial position of the Dining Group plc is
analysed by calculating some financial performance ratios. (APPENDIX 2)
Current Ratio
Current ratio is one of the main ratio under liquidity ratio. It is calculated to determine the
liquidity position of an organisation (Hottenrott and Lopes‐Bento, 2016). It helps external users
of financial statement of the company, information regarding, whether the company have enough
liquid resources i.e. cash resources that will enable business in paying off its short term
obligation. Short-term obligations refers to the payments that firm had to pay within a period of 1
year or less. Ideal current ratio that a company supposed to have is 2:1. Main components of
current ratio includes current assets and current liabilities of the entity.
From the calculation of current ratio for Dining Group Plc it has been analysed that,
current ratio for the year 2015 of the company is 0.28 and for the year 2016 is 0.36 respectively.
After analysis, it can be said that liquidity position of the company is not well in both the years.
And hence, dining group requires to either lower its current liabilities or to increase it current
assets such as cash and cash equivalents. Present position of the company will reflect a negative
image in front of shareholders. However, Dining Group plc has managed to improve its liquidity
position to a little level, But management needs to make more strategies regarding the same.
Furthermore, it can be also seen from the statement of financial position that inventories of the
company has reduced but trade payables and cash amount has been increased that has lead to
increase in total current assets in comparison to the last year. However, when talking about
current liabilities, amount of bank overdraft and trade payables has been increased from last year.
Increase in current liabilities set off the benefit of increase in trade payables and cash amount
(Li, Mullan and Helgeson, 2014).
6
⊘ This is a preview!⊘
Do you want full access?
Subscribe today to unlock all pages.
Trusted by 1+ million students worldwide
2015 2016
0
0.05
0.1
0.15
0.2
0.25
0.3
0.35
0.4
0.28
0.36
Quick Ratio
It is also known as acid test ratio. It is the another ratio under liquidity ratio that is used to
determine the ability of a business to pay-off its short term debt (Magni, 2015). Unlike current
assets which consists of all the current assets, it considers liquid assets which consists of all the
current assets excluding inventories and prepaid expenses. Ideal quick ratio that a company
supposed to have is 1.2:1.
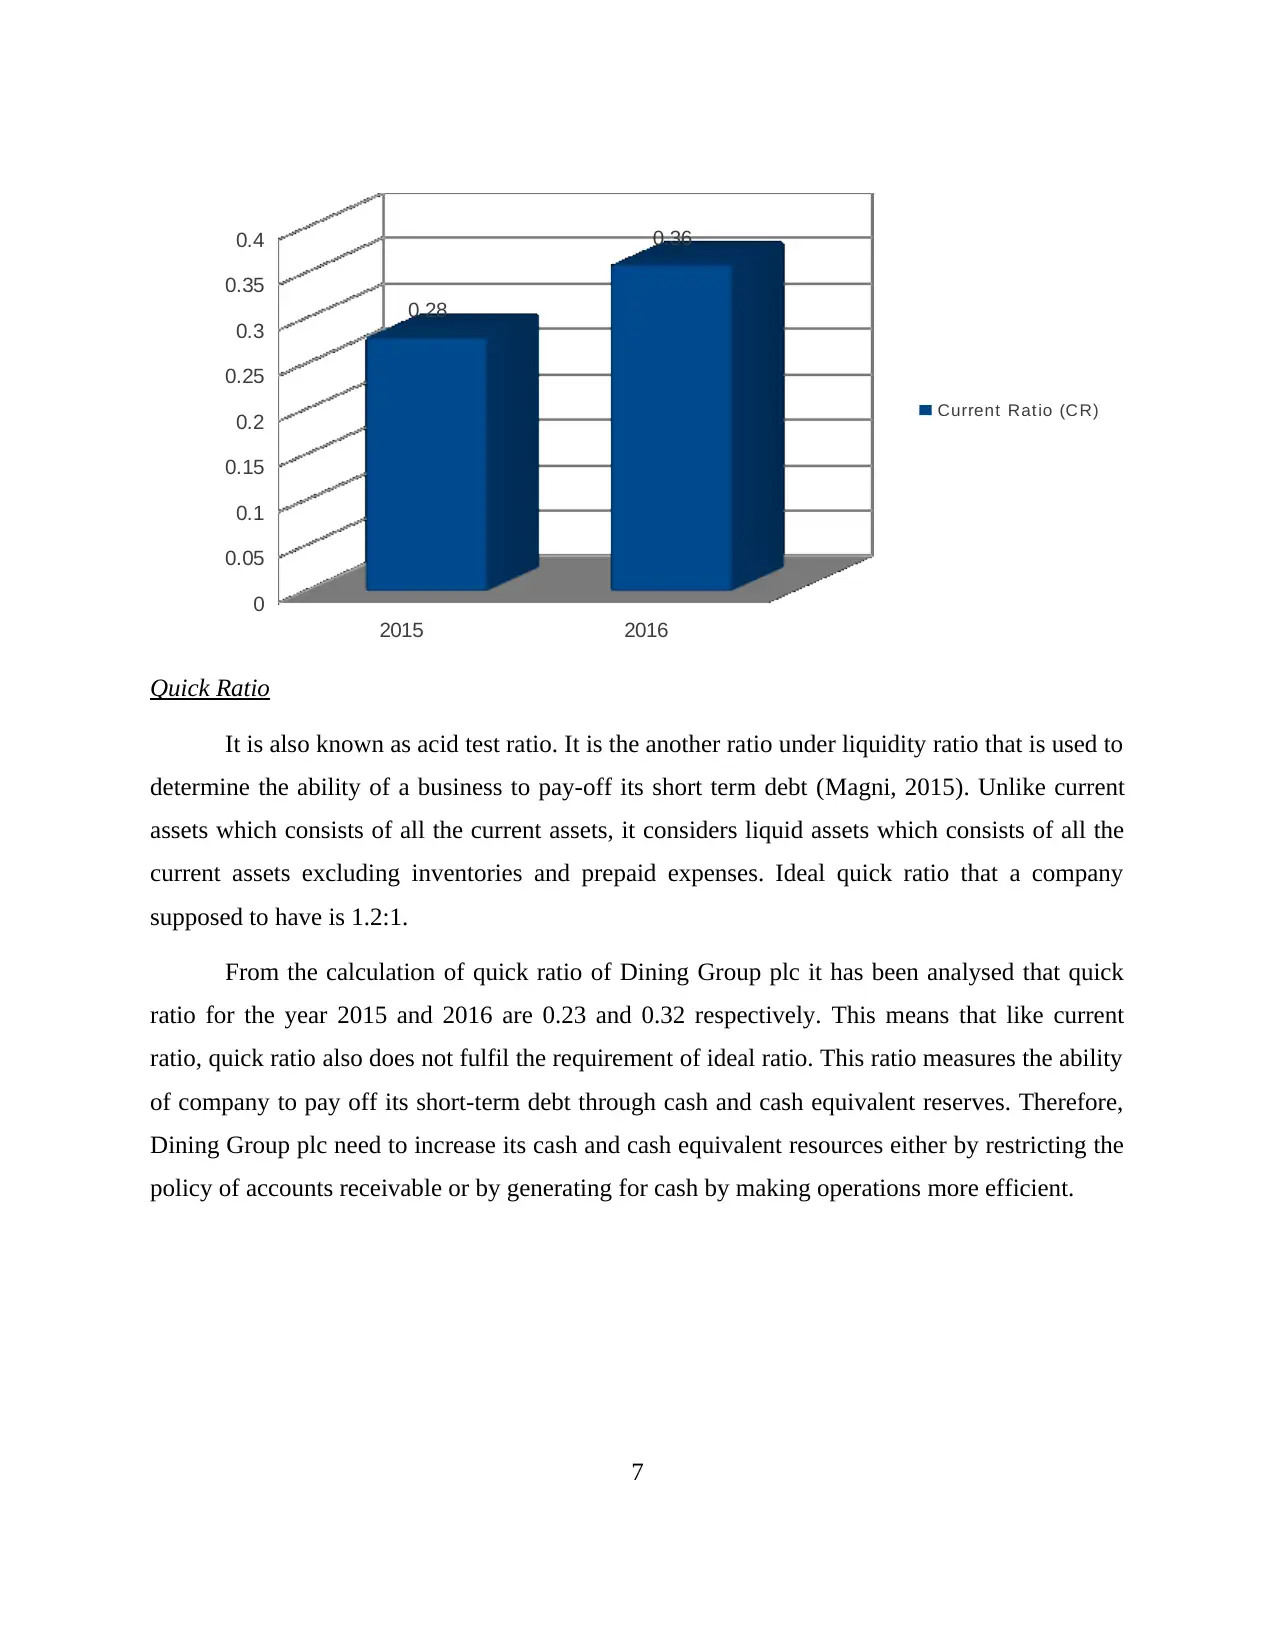
From the calculation of quick ratio of Dining Group plc it has been analysed that quick
ratio for the year 2015 and 2016 are 0.23 and 0.32 respectively. This means that like current
ratio, quick ratio also does not fulfil the requirement of ideal ratio. This ratio measures the ability
of company to pay off its short-term debt through cash and cash equivalent reserves. Therefore,
Dining Group plc need to increase its cash and cash equivalent resources either by restricting the
policy of accounts receivable or by generating for cash by making operations more efficient.
7
Current Ratio (CR)
0
0.05
0.1
0.15
0.2
0.25
0.3
0.35
0.4
0.28
0.36
Quick Ratio
It is also known as acid test ratio. It is the another ratio under liquidity ratio that is used to
determine the ability of a business to pay-off its short term debt (Magni, 2015). Unlike current
assets which consists of all the current assets, it considers liquid assets which consists of all the
current assets excluding inventories and prepaid expenses. Ideal quick ratio that a company
supposed to have is 1.2:1.
From the calculation of quick ratio of Dining Group plc it has been analysed that quick
ratio for the year 2015 and 2016 are 0.23 and 0.32 respectively. This means that like current
ratio, quick ratio also does not fulfil the requirement of ideal ratio. This ratio measures the ability
of company to pay off its short-term debt through cash and cash equivalent reserves. Therefore,
Dining Group plc need to increase its cash and cash equivalent resources either by restricting the
policy of accounts receivable or by generating for cash by making operations more efficient.
7
Current Ratio (CR)
Paraphrase This Document
Need a fresh take? Get an instant paraphrase of this document with our AI Paraphraser

2015 2016
0
0.05
0.1
0.15
0.2
0.25
0.3
0.35
0.23
0.32
Debt to Equity ratio
Debt-equity ratio is calculated to determine the financial performance of the firm and is
one of the main ratio under efficiency ratio. It mainly measures efficiency of company to pay off
its long term debts (Marks and et.al., 2015). It compares total debt of a business to its total
equity. The main purpose of calculation of this ratio is that it provides percentage of company
financing that comes from investors and creditors. If debt-equity ratio of the company is high,
this means that more creditor financing or bank loan are used than investor financing.
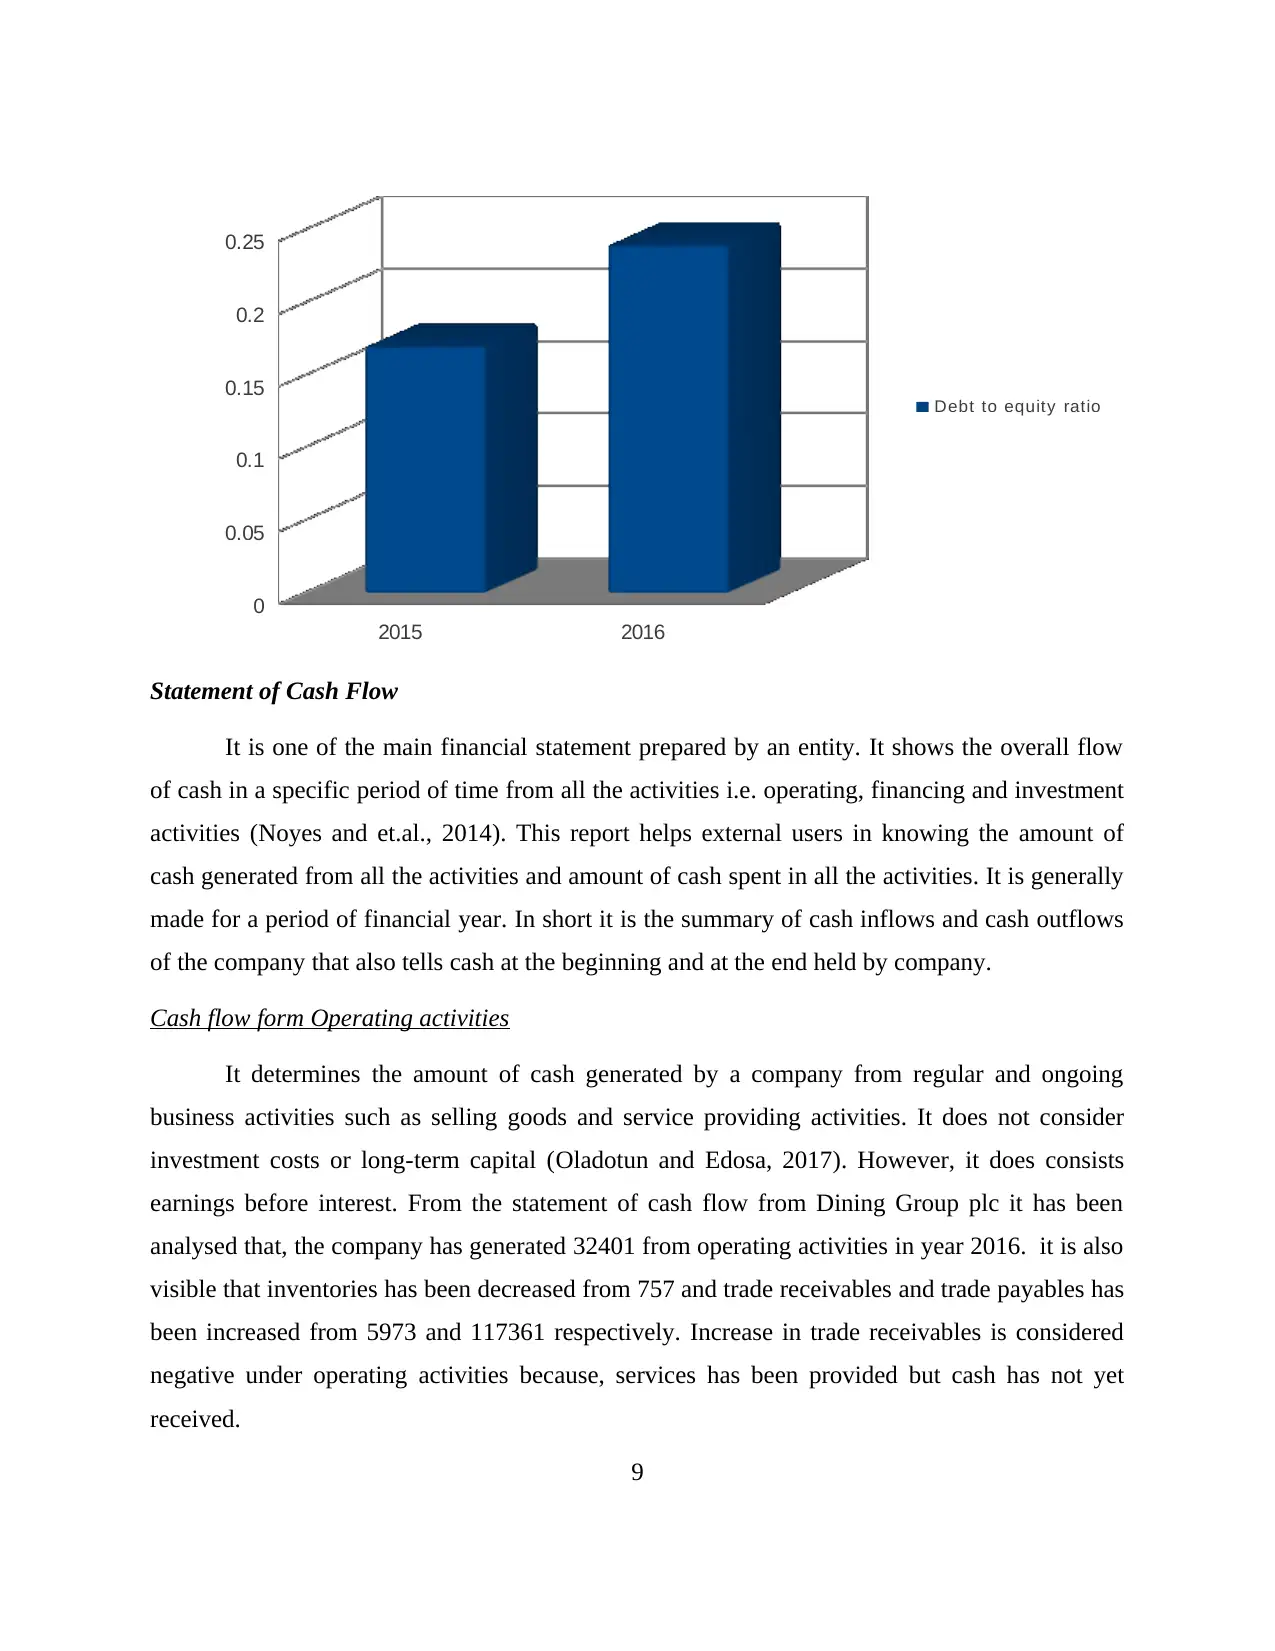
The debt-equity ratio of Dining Group plc shows 0.17 in year 2015 and 0.24 in year
2016. This means as comparison to 2015, company has increased more of its finance through
bank loan and other creditors.
8
Q uic k ratio
0
0.05
0.1
0.15
0.2
0.25
0.3
0.35
0.23
0.32
Debt to Equity ratio
Debt-equity ratio is calculated to determine the financial performance of the firm and is
one of the main ratio under efficiency ratio. It mainly measures efficiency of company to pay off
its long term debts (Marks and et.al., 2015). It compares total debt of a business to its total
equity. The main purpose of calculation of this ratio is that it provides percentage of company
financing that comes from investors and creditors. If debt-equity ratio of the company is high,
this means that more creditor financing or bank loan are used than investor financing.
The debt-equity ratio of Dining Group plc shows 0.17 in year 2015 and 0.24 in year
2016. This means as comparison to 2015, company has increased more of its finance through
bank loan and other creditors.
8
Q uic k ratio
2015 2016
0
0.05
0.1
0.15
0.2
0.25
Statement of Cash Flow
It is one of the main financial statement prepared by an entity. It shows the overall flow
of cash in a specific period of time from all the activities i.e. operating, financing and investment
activities (Noyes and et.al., 2014). This report helps external users in knowing the amount of
cash generated from all the activities and amount of cash spent in all the activities. It is generally
made for a period of financial year. In short it is the summary of cash inflows and cash outflows
of the company that also tells cash at the beginning and at the end held by company.
Cash flow form Operating activities
It determines the amount of cash generated by a company from regular and ongoing
business activities such as selling goods and service providing activities. It does not consider
investment costs or long-term capital (Oladotun and Edosa, 2017). However, it does consists
earnings before interest. From the statement of cash flow from Dining Group plc it has been
analysed that, the company has generated 32401 from operating activities in year 2016. it is also
visible that inventories has been decreased from 757 and trade receivables and trade payables has
been increased from 5973 and 117361 respectively. Increase in trade receivables is considered
negative under operating activities because, services has been provided but cash has not yet
received.
9
Debt to equity ratio
⊘ This is a preview!⊘
Do you want full access?
Subscribe today to unlock all pages.
Trusted by 1+ million students worldwide
1 out of 23
Related Documents


Your All-in-One AI-Powered Toolkit for Academic Success.
+13062052269
info@desklib.com
Available 24*7 on WhatsApp / Email
![[object Object]](/_next/static/media/star-bottom.7253800d.svg)
Unlock your academic potential
Copyright © 2020–2026 A2Z Services. All Rights Reserved. Developed and managed by ZUCOL.