Report: Discount Rate and Inflation Rate Analysis in Treasury Bonds
VerifiedAdded on 2021/06/15
|6
|810
|119
Report
AI Summary
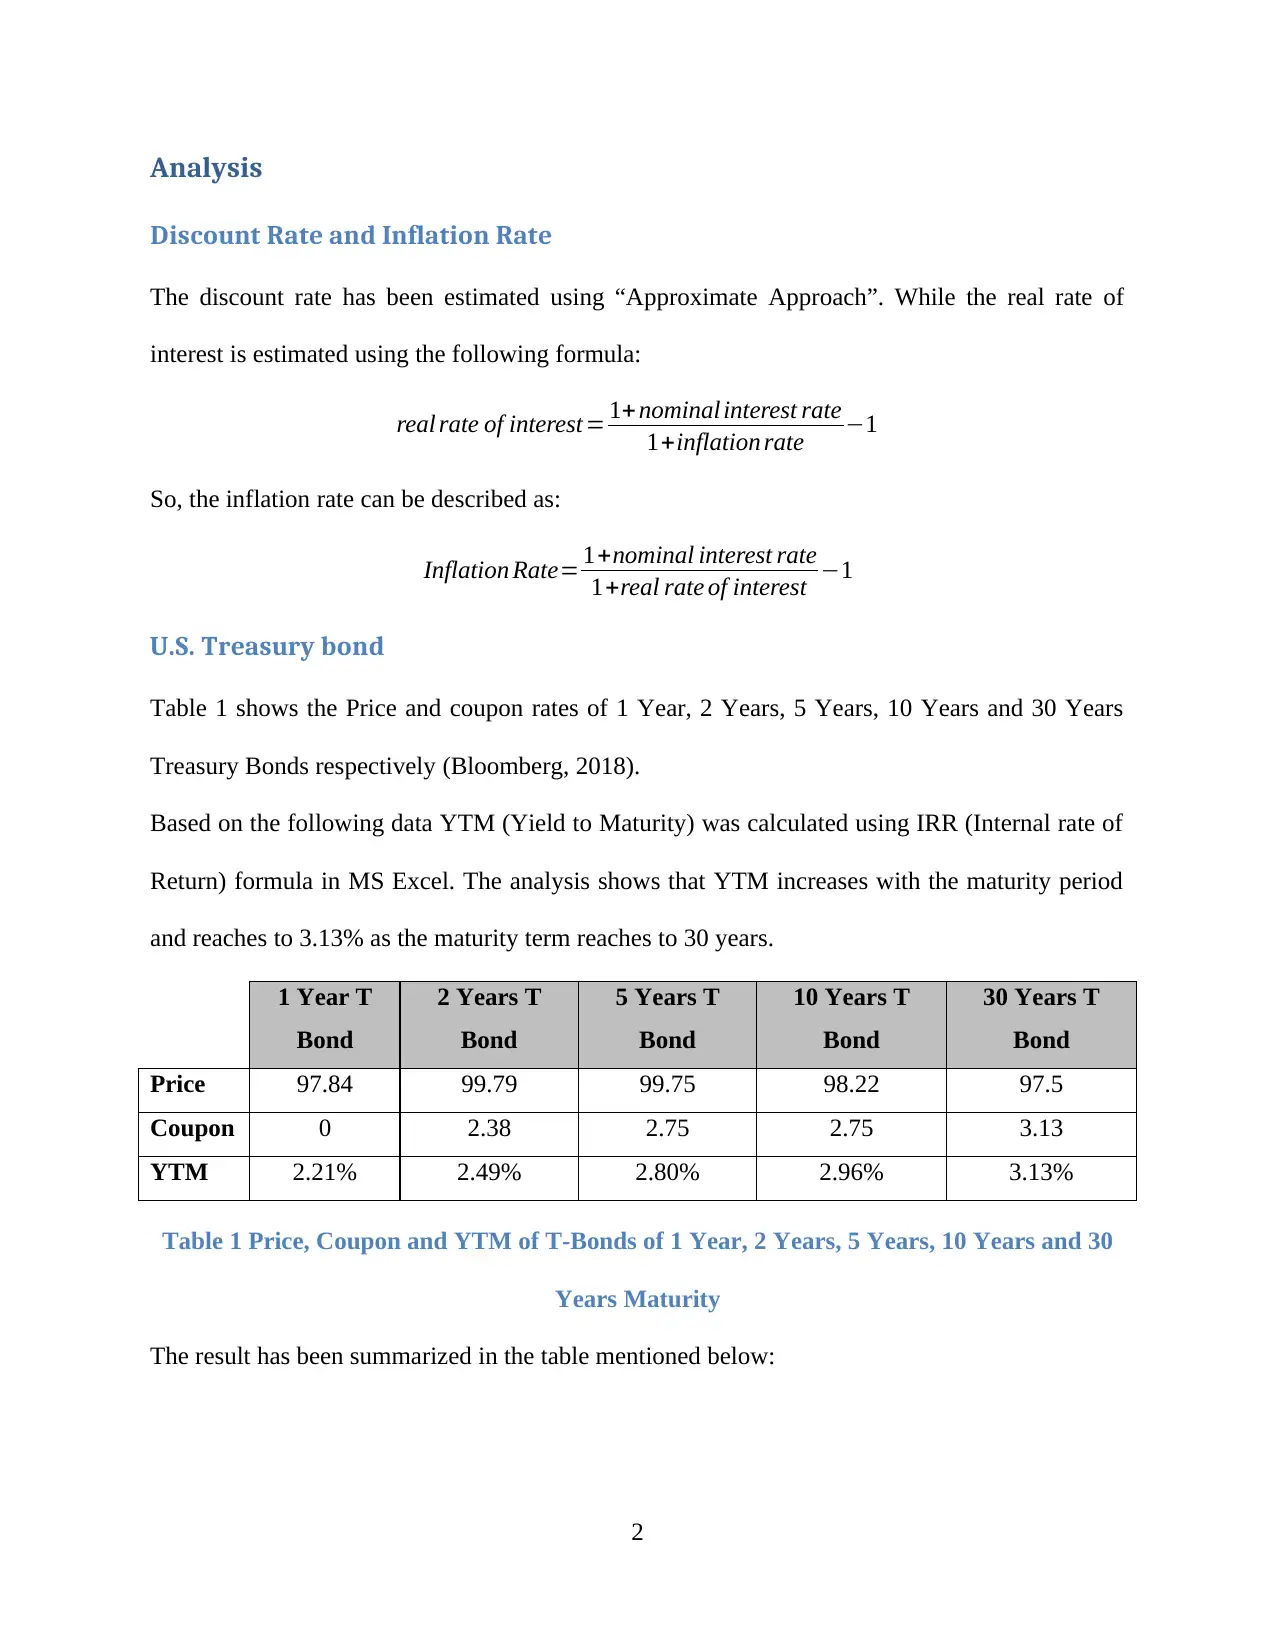
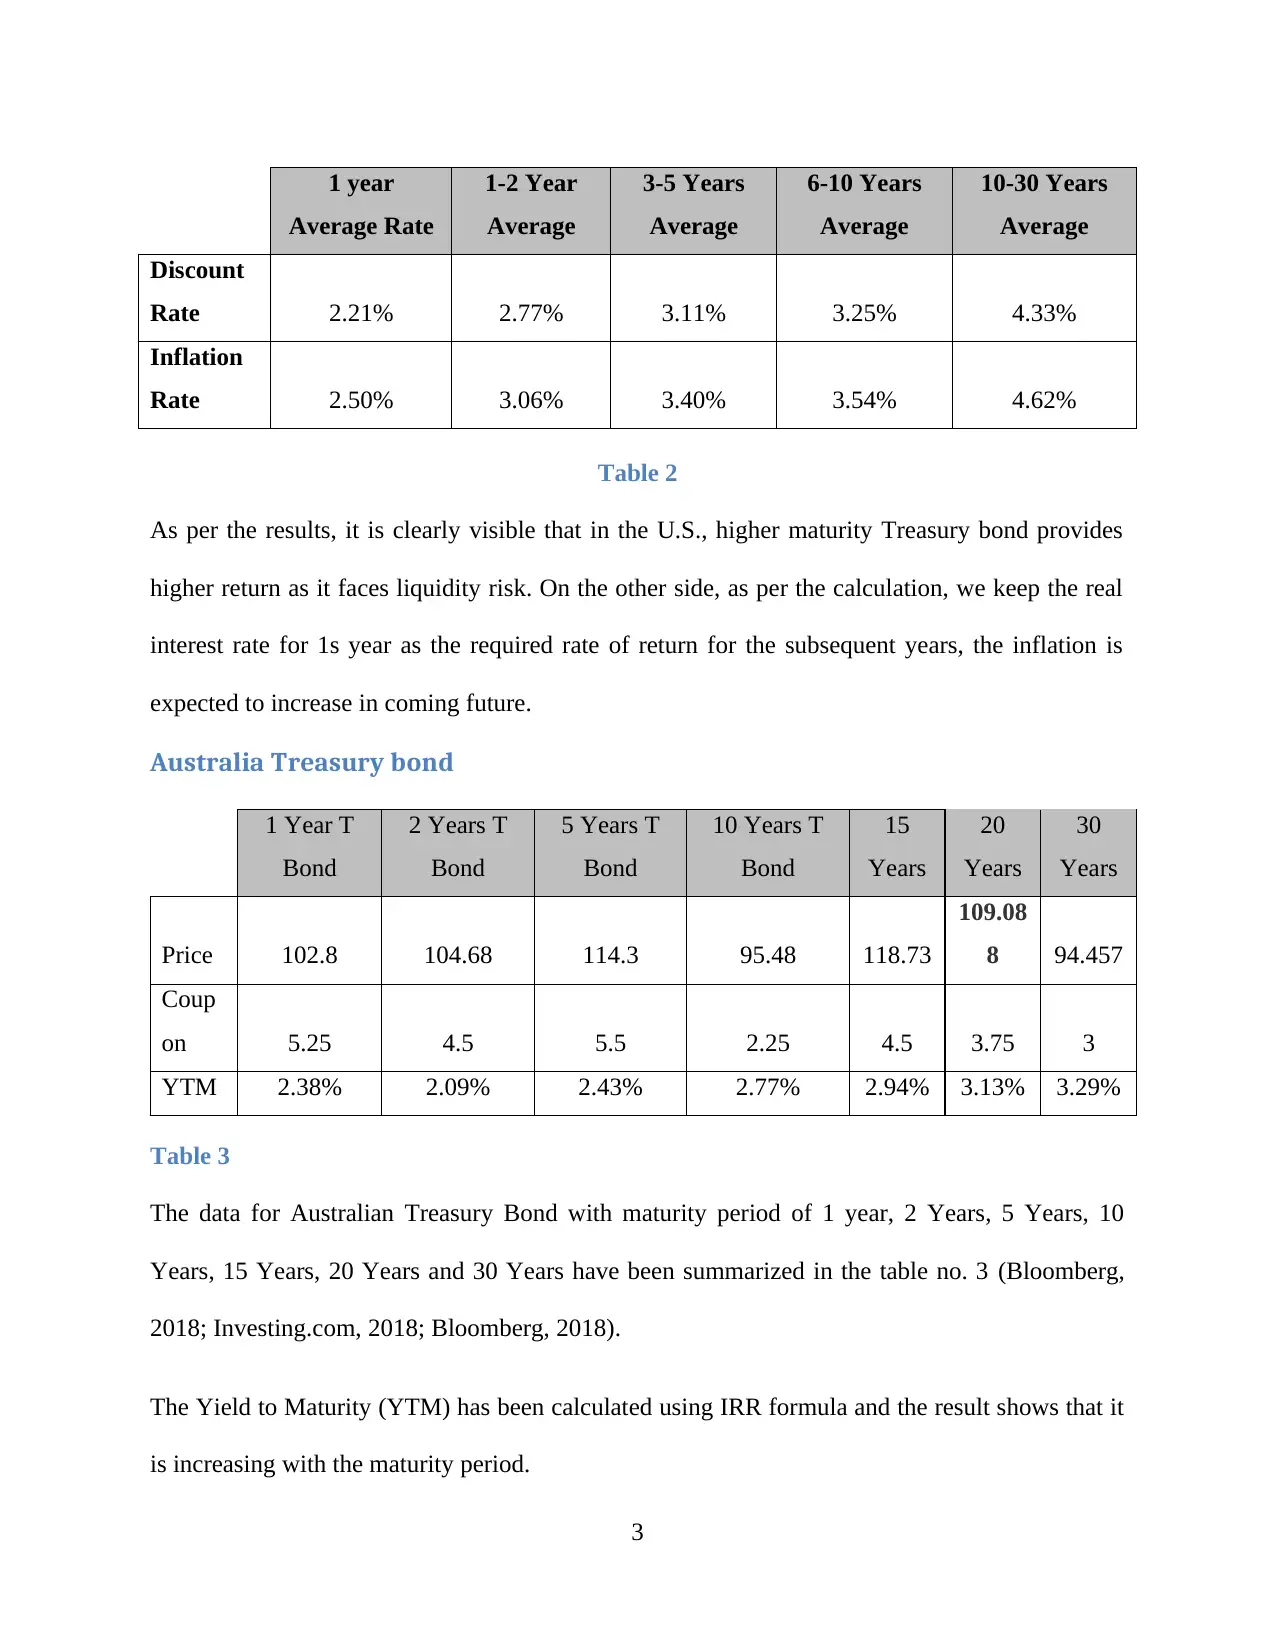
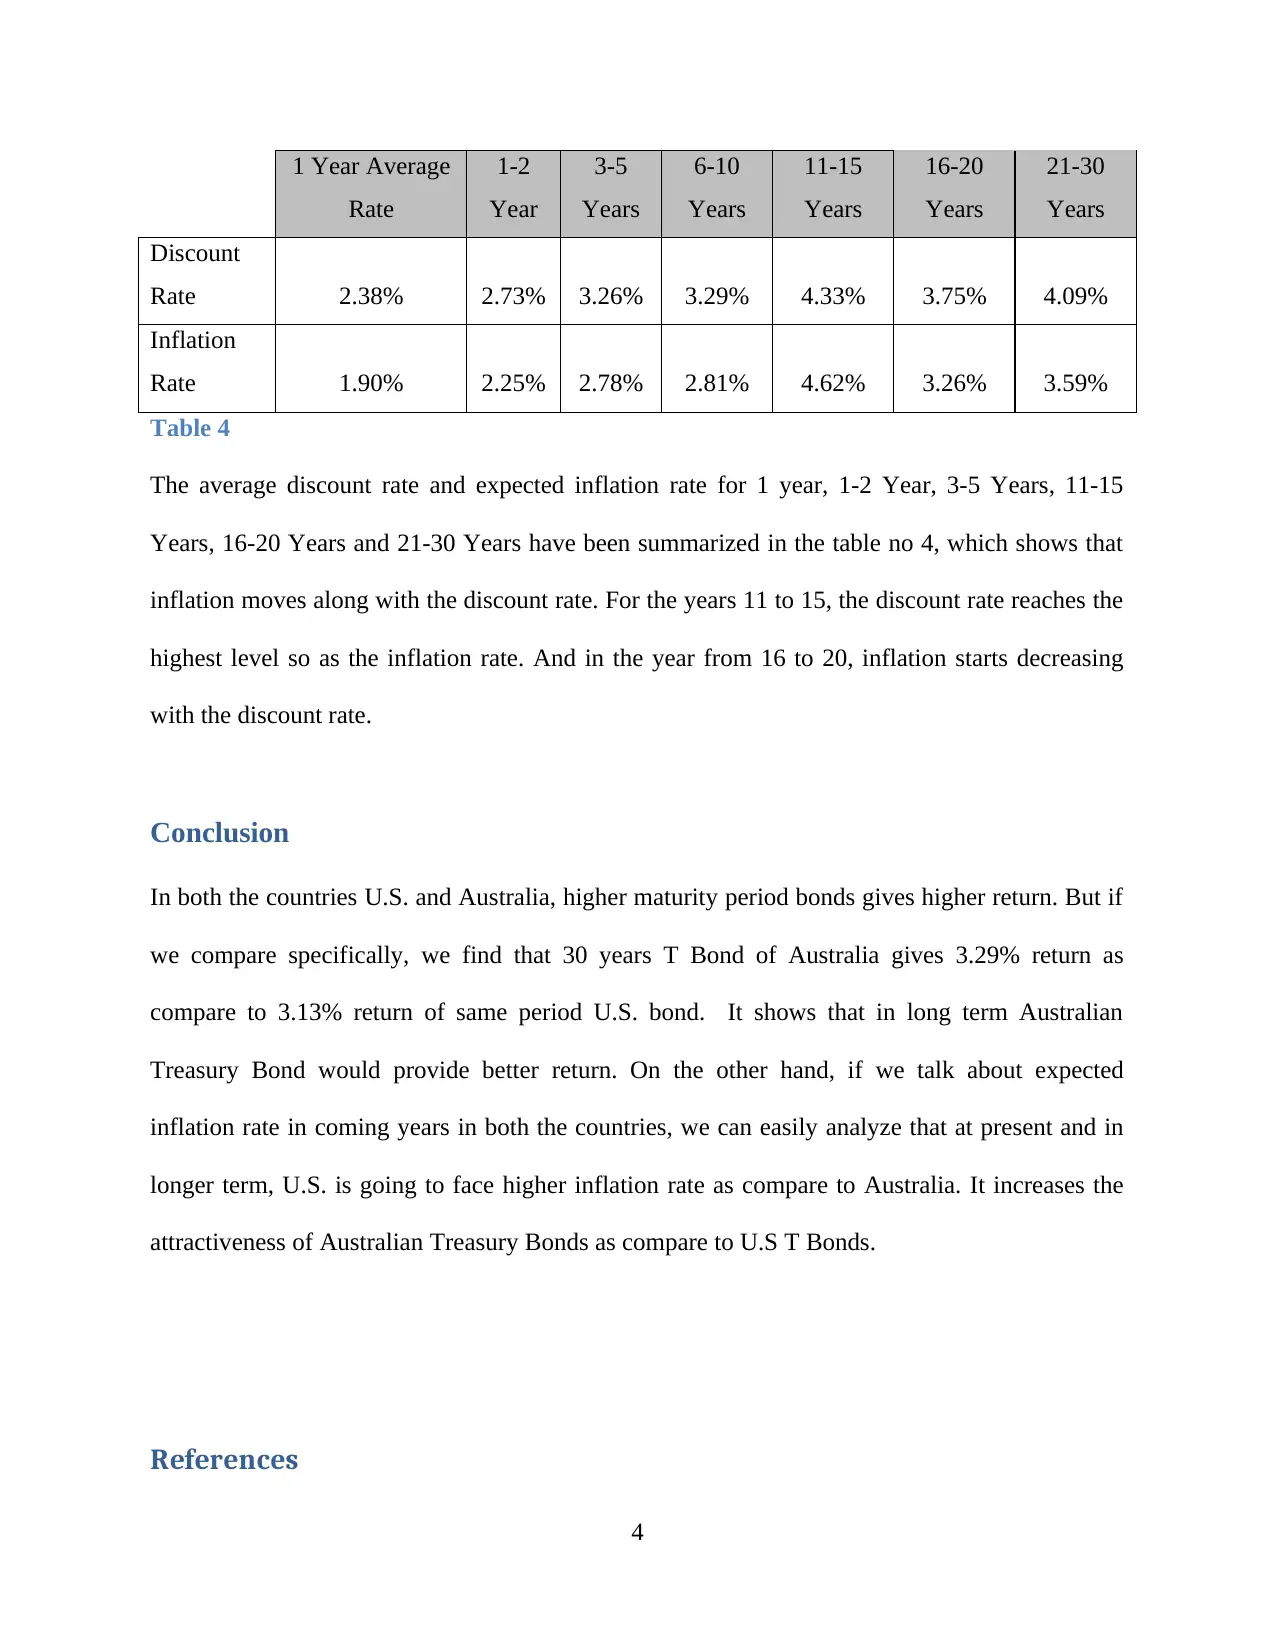
This report analyzes discount rates and inflation using data from U.S. and Australian Treasury bonds. It calculates the Yield to Maturity (YTM) for various maturity periods, demonstrating the relationship between maturity and return. The report compares the discount and inflation rates of the two countries, concluding that Australian Treasury bonds may offer better long-term returns due to potentially lower inflation. The analysis includes tables summarizing the price, coupon rates, and YTM for both U.S. and Australian bonds, providing a comprehensive overview of the financial instruments and their performance. The report also employs the "Approximate Approach" to estimate the discount rate and uses a formula to calculate the real rate of interest and inflation rate.

Principle of Finance
Paraphrase This Document
Need a fresh take? Get an instant paraphrase of this document with our AI Paraphraser

Contents
Analysis...........................................................................................................................................3
Discount Rate and Inflation Rate.................................................................................................3
U.S. Treasury bond......................................................................................................................3
Australia Treasury bond...............................................................................................................4
Conclusion.......................................................................................................................................5
References........................................................................................................................................6
1

Analysis
Discount Rate and Inflation Rate
The discount rate has been estimated using “Approximate Approach”. While the real rate of
interest is estimated using the following formula:
real rate of interest = 1+ nominal interest rate
1+inflation rate −1
So, the inflation rate can be described as:
Inflation Rate= 1+nominal interest rate
1+real rate of interest −1
U.S. Treasury bond
Table 1 shows the Price and coupon rates of 1 Year, 2 Years, 5 Years, 10 Years and 30 Years
Treasury Bonds respectively (Bloomberg, 2018).
Based on the following data YTM (Yield to Maturity) was calculated using IRR (Internal rate of
Return) formula in MS Excel. The analysis shows that YTM increases with the maturity period
and reaches to 3.13% as the maturity term reaches to 30 years.
1 Year T
Bond
2 Years T
Bond
5 Years T
Bond
10 Years T
Bond
30 Years T
Bond
Price 97.84 99.79 99.75 98.22 97.5
Coupon 0 2.38 2.75 2.75 3.13
YTM 2.21% 2.49% 2.80% 2.96% 3.13%
Table 1 Price, Coupon and YTM of T-Bonds of 1 Year, 2 Years, 5 Years, 10 Years and 30
Years Maturity
The result has been summarized in the table mentioned below:
2
⊘ This is a preview!⊘
Do you want full access?
Subscribe today to unlock all pages.

Trusted by 1+ million students worldwide

Table 2
As per the results, it is clearly visible that in the U.S., higher maturity Treasury bond provides
higher return as it faces liquidity risk. On the other side, as per the calculation, we keep the real
interest rate for 1s year as the required rate of return for the subsequent years, the inflation is
expected to increase in coming future.
Australia Treasury bond
1 Year T
Bond
2 Years T
Bond
5 Years T
Bond
10 Years T
Bond
15
Years
20
Years
30
Years
Price 102.8 104.68 114.3 95.48 118.73
109.08
8 94.457
Coup
on 5.25 4.5 5.5 2.25 4.5 3.75 3
YTM 2.38% 2.09% 2.43% 2.77% 2.94% 3.13% 3.29%
Table 3
The data for Australian Treasury Bond with maturity period of 1 year, 2 Years, 5 Years, 10
Years, 15 Years, 20 Years and 30 Years have been summarized in the table no. 3 (Bloomberg,
2018; Investing.com, 2018; Bloomberg, 2018).
The Yield to Maturity (YTM) has been calculated using IRR formula and the result shows that it
is increasing with the maturity period.
3
1 year
Average Rate
1-2 Year
Average
3-5 Years
Average
6-10 Years
Average
10-30 Years
Average
Discount
Rate 2.21% 2.77% 3.11% 3.25% 4.33%
Inflation
Rate 2.50% 3.06% 3.40% 3.54% 4.62%
Paraphrase This Document
Need a fresh take? Get an instant paraphrase of this document with our AI Paraphraser

1 Year Average
Rate
1-2
Year
3-5
Years
6-10
Years
11-15
Years
16-20
Years
21-30
Years
Discount
Rate 2.38% 2.73% 3.26% 3.29% 4.33% 3.75% 4.09%
Inflation
Rate 1.90% 2.25% 2.78% 2.81% 4.62% 3.26% 3.59%
Table 4
The average discount rate and expected inflation rate for 1 year, 1-2 Year, 3-5 Years, 11-15
Years, 16-20 Years and 21-30 Years have been summarized in the table no 4, which shows that
inflation moves along with the discount rate. For the years 11 to 15, the discount rate reaches the
highest level so as the inflation rate. And in the year from 16 to 20, inflation starts decreasing
with the discount rate.
Conclusion
In both the countries U.S. and Australia, higher maturity period bonds gives higher return. But if
we compare specifically, we find that 30 years T Bond of Australia gives 3.29% return as
compare to 3.13% return of same period U.S. bond. It shows that in long term Australian
Treasury Bond would provide better return. On the other hand, if we talk about expected
inflation rate in coming years in both the countries, we can easily analyze that at present and in
longer term, U.S. is going to face higher inflation rate as compare to Australia. It increases the
attractiveness of Australian Treasury Bonds as compare to U.S T Bonds.
References
4

Bloomberg, 2018. Australian Rates & Bonds. [Online] Available at:
https://www.bloomberg.com/markets/rates-bonds/government-bonds/australia [Accessed 28
April 2018].
Bloomberg, 2018. United States Rates and Bonds. [Online] Available at:
https://www.bhttps://www.bloomberg.com/markets/rates-bonds/government-bonds/
usloomberg.com/markets/rates-bonds/government-bonds/us [Accessed 30 April 2018].
Investing.com, 2018. Australia 30-Year Bond Yield. [Online] Available at:
https://www.investing.com/rates-bonds/australia-30-year [Accessed 29 April 2018].
5
⊘ This is a preview!⊘
Do you want full access?
Subscribe today to unlock all pages.

Trusted by 1+ million students worldwide
1 out of 6
Your All-in-One AI-Powered Toolkit for Academic Success.
+13062052269
info@desklib.com
Available 24*7 on WhatsApp / Email
Unlock your academic potential
Copyright © 2020–2025 A2Z Services. All Rights Reserved. Developed and managed by ZUCOL.