Equity Valuation Report: Discounted Cash Flow Analysis and Stages
VerifiedAdded on 2020/07/22
|9
|1720
|32
Report
AI Summary
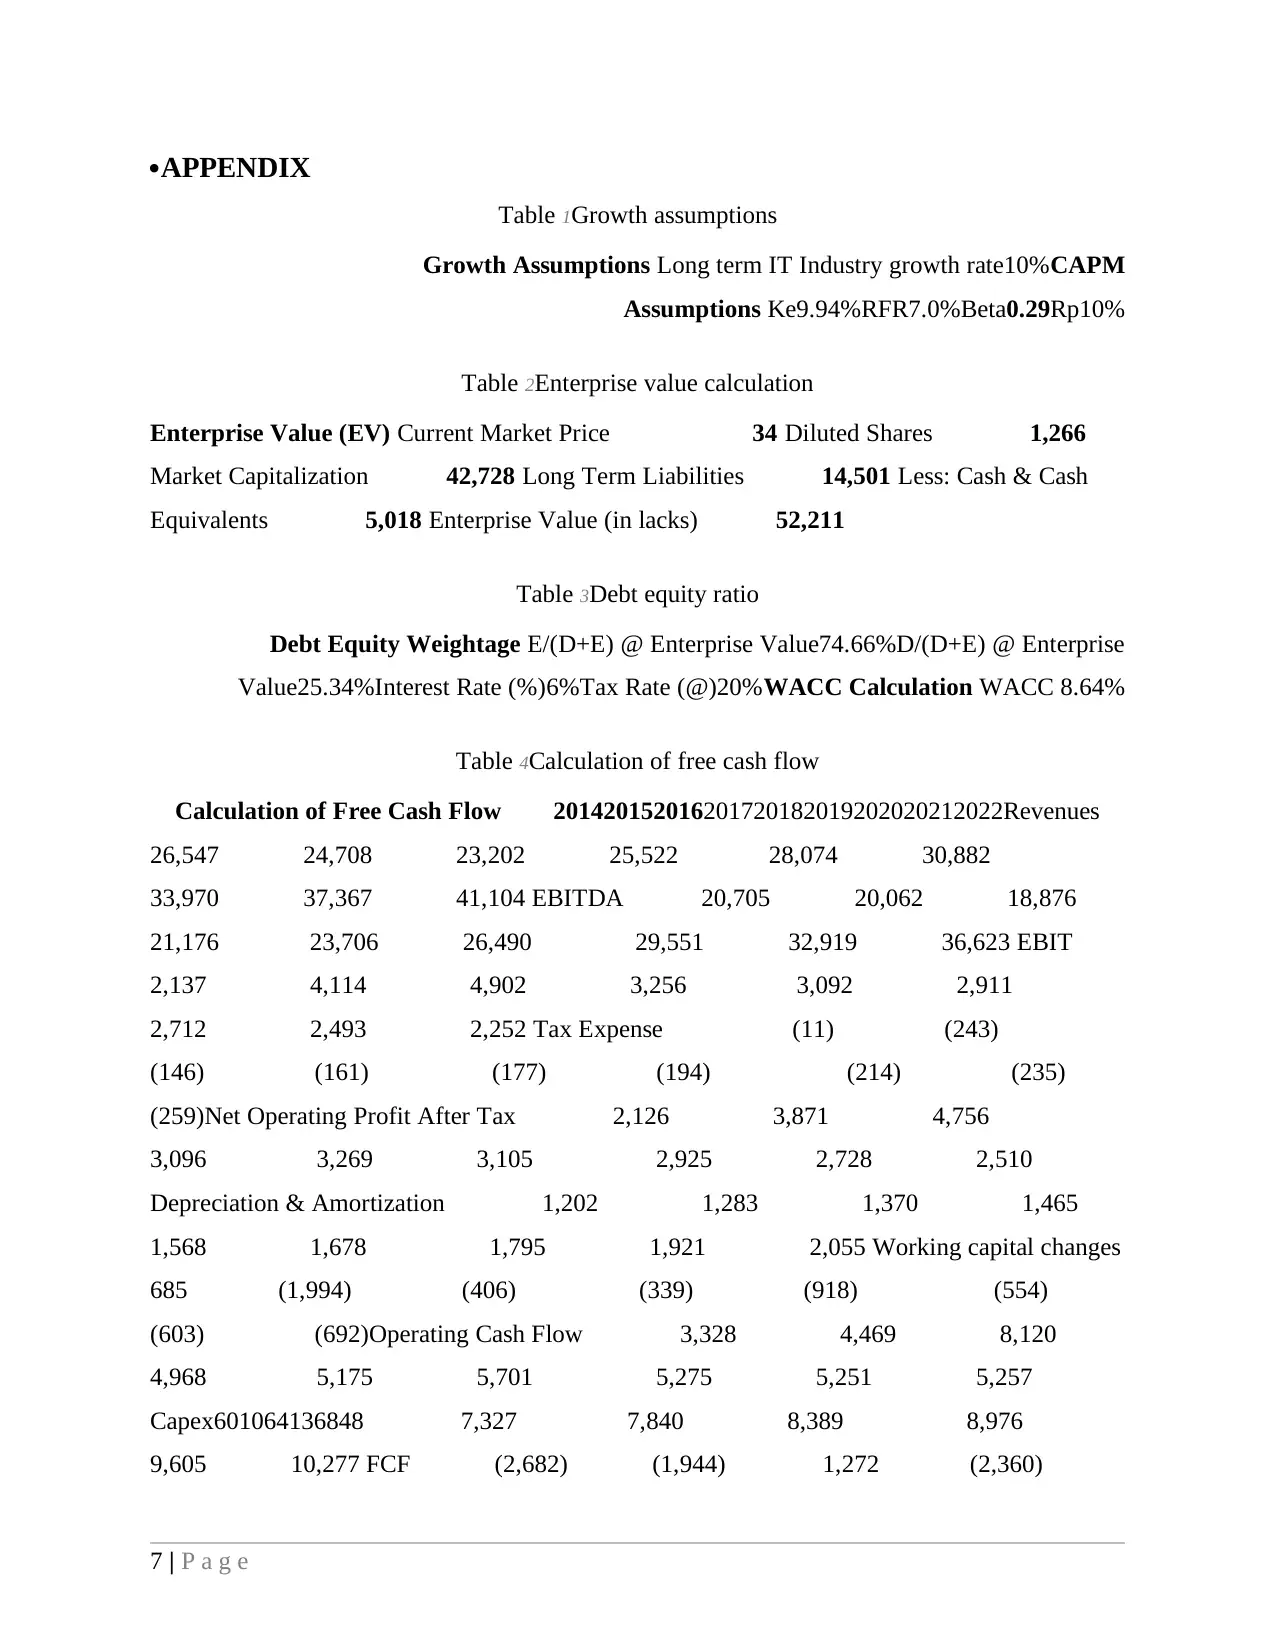
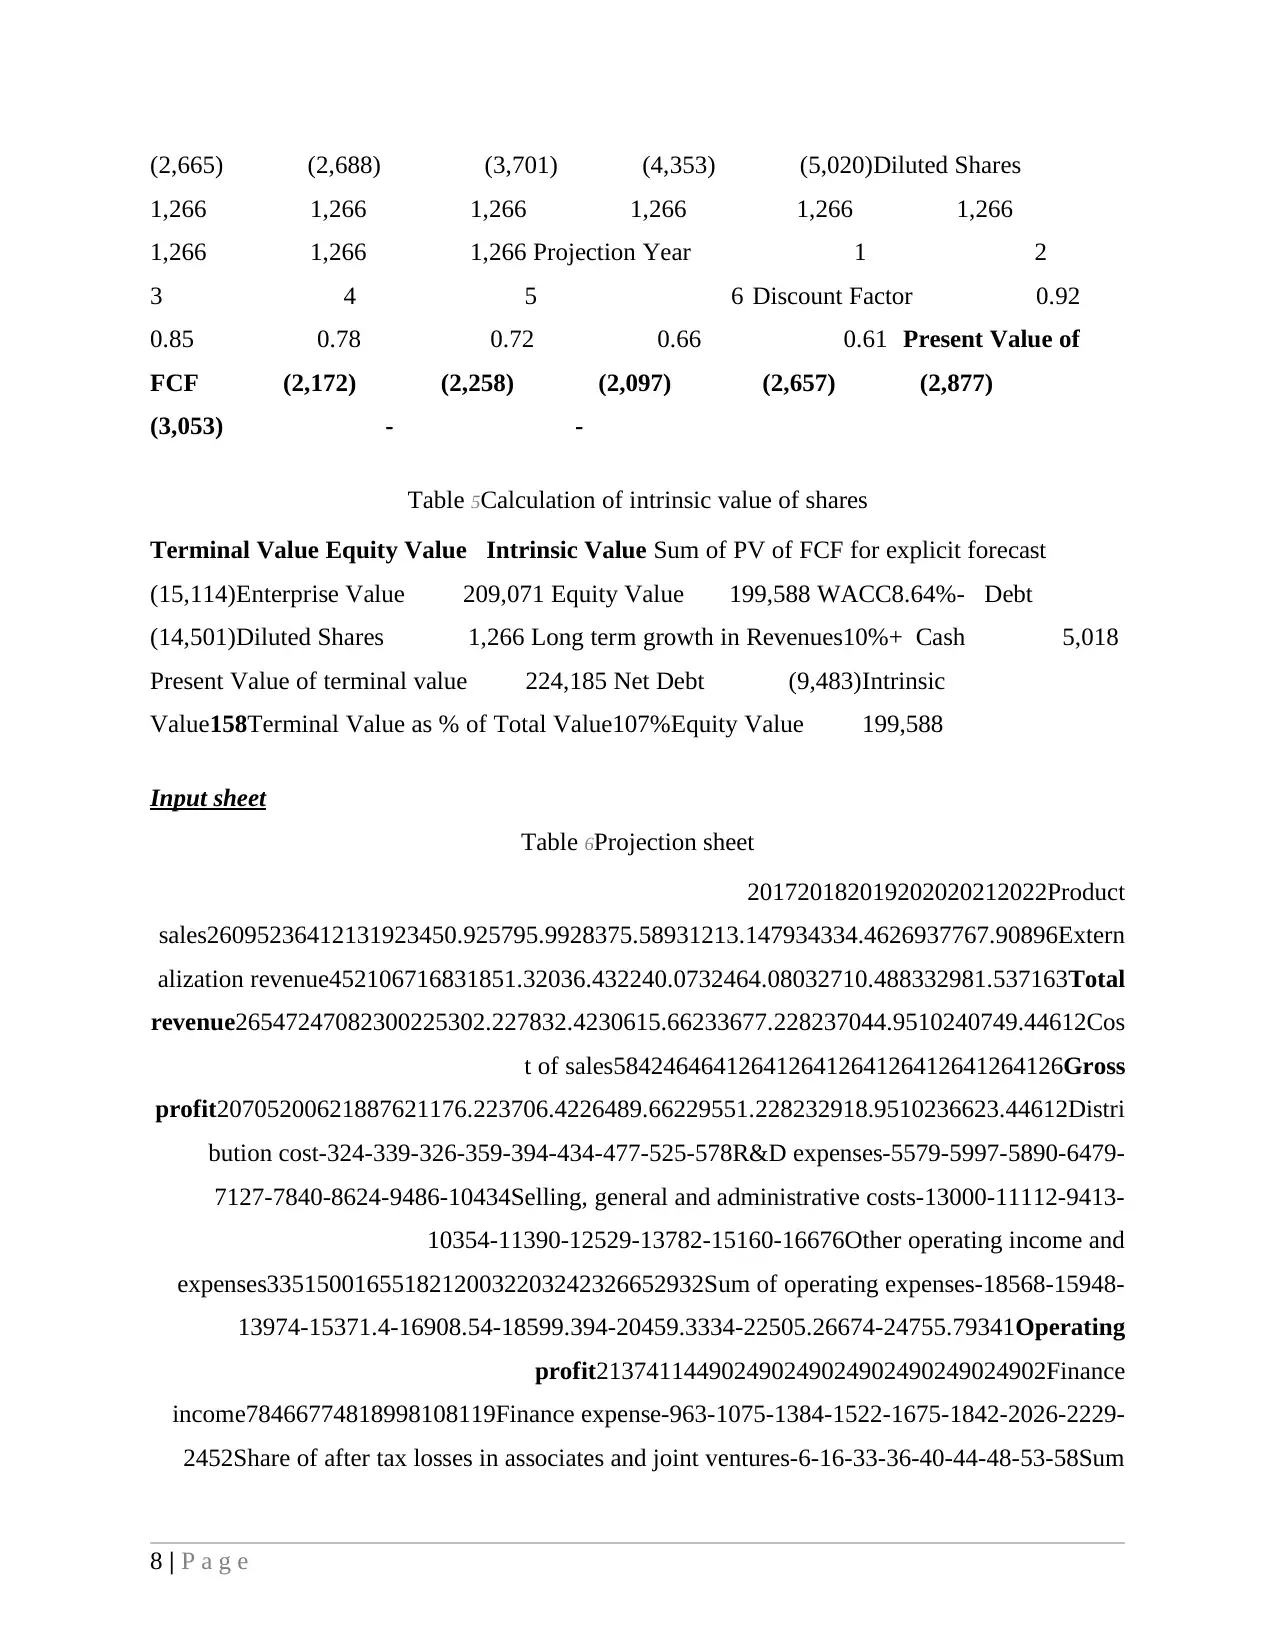
This report presents an equity valuation analysis using the discounted cash flow (DCF) method. It details the stages involved, including calculating beta, weighted average cost of capital (WACC), revenue and net operating profit after tax, operating cash flow, and capital expenditures (CAPEX). The...
Read More
Contribute Materials
Your contribution can guide someone’s learning journey. Share your
documents today.

CORPORATE FINANCIAL
INFORMATION
INFORMATION
Secure Best Marks with AI Grader
Need help grading? Try our AI Grader for instant feedback on your assignments.

TABLE OF CONTENTS
Way in which valuation method work and purpose of each stage in valuation model...................3
Evaluating assumptions................................................................................................................ 4
REFERENCES............................................................................................................................ 6
APPENDIX................................................................................................................................. 7

·Way in which valuation method work and purpose of each stage in valuation
model
In the present research study discounted cash flow valuation method is used. Under this
model first of all free cash flows are computed. Free cash flow refers to the amount that is
generated by considering all sort of expenses in the business whether same are operating, non
operating, capital expenditures and working capital changes. It can be said that all sort of cash
inflow and outflow amount are taken in to account in order to compute free cash flow amount
for computing fair value of shares (Hellman and Fröberg, 2016). After computing free cash flow
estimated values of mentioned variable are discounted at WACC rate which is also known as
weighted average cost of capital. Enterprise value is computed on the basis of present value of
terminal value and sum of present value of free cash flows. Same is used to calculate equity
value which is divided number of shares issued and by doing so share price of each share is
computed in context of the business firm. In this way entire valuation method work.
Stages of the equity valuation is given below.
·Calculation of beta value: Main purpose of performing this stage is to get input for
computing cost of equity. In this regard CAPM model is applied and under this by
considering risk free rate of return, beta and return that market may generate cost of
equity is computed.
·Computing weighted average cost of capital: Weighted average cost of capital is
computed to identify overall cost of capital. The other main purpose of performing this
task is to identify rate that can be used to compute overall cost of capital for computing
present value of cash flows (Jackson, 2016).
·Estimating revenue and net operating profit after tax: It is the another important stage
of valuation and under this main purpose is to make estimation of revenue so that finally
free cash flow can be calculated in the model (Enterpise and equity values, 2017). This
value is further used to compute fair value of shares. Net operating profit after tax is
computed to reveal the impact of consideration of CAPEX, working capital changes and
depreciation on the free cash flow.
3 | P a g e

·Computing operating cash flow: Main purpose of computing operating cash flow is to
reveal the impact on cash flows that is observed due to inclusion of working capital
changes and depreciation in computation of free cash flows.
·CAPEX: Like above main aim of inclusion of CAPEX in model is to reflect the impact
that CAPEX have on free cash flows. Thus, it can be said that by including CAPEX in
model one can identify that after meeting all sort of expenses which amount of money
remain in the business (Johnstone, 2016). It can be said that there is significant
importance of the CAPEX in the equity valuation model.
·Discounting of cash flows: In this stage discounting of cash flows is done by using
discounting rate. This is one of the important stage of the valuation model because in
same present value of cash flows is computed and by considering same value of equity is
computed. It can be said that there is significant importance of this stage.
·Calculation of equity value and intrinsic value of shares: In this stage equity value is
computed and main purpose of performing this stage is to identify the real value of
equity by considering final value of same. In this regard shareholder equity value is
computed an d same is divided by number of shares issued to find out real value of
shares.
These are the stages that are performed in the equity valuation model. It can be
observed that it is very important to perform all these stages because each of these stages
reflects a lot of things about business firm and prove helpful for management in terms of
decision making in respect to determining fair value of shares.
·Evaluating assumptions
Some assumptions that are already given in the relevant material are explained below.
·Risk free rate of return: Rate of UK guilt 5 year fund is 0.50 and same in case of UK
guilt 10 year fund is 4.25. It can be observed that in the reference material RFR of 4% is
taken in to account which seems inappropriate. This is because in the current report
projection is done for 5 years and accordingly RFR must be 0.50. But RFR of 4.25 is
used which is related to UK 10 year guilt and duration for which valuation done is 5
years. Thus, wrong RFR is taken in model.
4 | P a g e
Secure Best Marks with AI Grader
Need help grading? Try our AI Grader for instant feedback on your assignments.

·FTSE shares return: FTSE shares return is taken is 10% which is appropriate because
in last on year time period FTSE gives return of 13% and 10% is nearby to it. Hence, it
can be said that appropriate return is taken in to consideration.
·Cost of debt 6%: Cost of debt can be considered reasonable because in UK if loan is
taken within range of £1000-£1999 interest rate of 7.9% is charged. 3.3% is charged for
debt amount which is more then £25000. There is difference of only 3% and it can be
said that to some extent reasonable cost of debt is taken. In case loan is taken at flexible
interest rate cost of debt may increase to 6%.
Assumptions evaluation
·Revenue growth rate: Revenue growth rate of 10% is taken for projection because in
past year's revenue declined at rate of 10%. Some projects of AstraZeneca are on pipeline
and it is expected that on execution of relevant projects will lead to growth in earning of
10% in upcoming years.
·Expenses growth rate: Big decline is not observed in case of expenses as part of sales
on yearly basis. Hence, relevant rates are kept constant in the model.
5 | P a g e

·REFERENCES
Books and journals
Hellman, N and Fröberg, E., 2016. The impact of IFRS goodwill reporting on financial analysts'
equity valuation judgements: some experimental evidence. Accounting & Finance. 56(1).
pp.113-157.
Jackson, A., 2016. The Impact of IFRS Goodwill Reporting on Financial Analysts' Equity
Valuation Judgements: Some Experimental Evidence (Digest Summary): N. Hellman, P.
Andersson & E. Fröberg, Accounting & Finance, Vol. 56, No. 1 (March 2016). CFA
Digest, 46(8).pp. 113-157.
Johnstone, D., 2016. Advances in Equity Valuation: Research on Accounting Valuation. Abacus.
52(1). pp.1-4.
Online
Enterpise and equity values, 2017. [Online]. Available throuh:<
http://macabacus.com/valuation/dcf/enterprise-equity-values>. [Accessed on 8th July
2017].
6 | P a g e

·APPENDIX
Table 1Growth assumptions
Growth Assumptions Long term IT Industry growth rate10%CAPM
Assumptions Ke9.94%RFR7.0%Beta0.29Rp10%
Table 2Enterprise value calculation
Enterprise Value (EV) Current Market Price 34 Diluted Shares 1,266
Market Capitalization 42,728 Long Term Liabilities 14,501 Less: Cash & Cash
Equivalents 5,018 Enterprise Value (in lacks) 52,211
Table 3Debt equity ratio
Debt Equity Weightage E/(D+E) @ Enterprise Value74.66%D/(D+E) @ Enterprise
Value25.34%Interest Rate (%)6%Tax Rate (@)20%WACC Calculation WACC 8.64%
Table 4Calculation of free cash flow
Calculation of Free Cash Flow 201420152016201720182019202020212022Revenues
26,547 24,708 23,202 25,522 28,074 30,882
33,970 37,367 41,104 EBITDA 20,705 20,062 18,876
21,176 23,706 26,490 29,551 32,919 36,623 EBIT
2,137 4,114 4,902 3,256 3,092 2,911
2,712 2,493 2,252 Tax Expense (11) (243)
(146) (161) (177) (194) (214) (235)
(259)Net Operating Profit After Tax 2,126 3,871 4,756
3,096 3,269 3,105 2,925 2,728 2,510
Depreciation & Amortization 1,202 1,283 1,370 1,465
1,568 1,678 1,795 1,921 2,055 Working capital changes
685 (1,994) (406) (339) (918) (554)
(603) (692)Operating Cash Flow 3,328 4,469 8,120
4,968 5,175 5,701 5,275 5,251 5,257
Capex601064136848 7,327 7,840 8,389 8,976
9,605 10,277 FCF (2,682) (1,944) 1,272 (2,360)
7 | P a g e
Paraphrase This Document
Need a fresh take? Get an instant paraphrase of this document with our AI Paraphraser

(2,665) (2,688) (3,701) (4,353) (5,020)Diluted Shares
1,266 1,266 1,266 1,266 1,266 1,266
1,266 1,266 1,266 Projection Year 1 2
3 4 5 6 Discount Factor 0.92
0.85 0.78 0.72 0.66 0.61 Present Value of
FCF (2,172) (2,258) (2,097) (2,657) (2,877)
(3,053) - -
Table 5Calculation of intrinsic value of shares
Terminal Value Equity Value Intrinsic Value Sum of PV of FCF for explicit forecast
(15,114)Enterprise Value 209,071 Equity Value 199,588 WACC8.64%- Debt
(14,501)Diluted Shares 1,266 Long term growth in Revenues10%+ Cash 5,018
Present Value of terminal value 224,185 Net Debt (9,483)Intrinsic
Value158Terminal Value as % of Total Value107%Equity Value 199,588
Input sheet
Table 6Projection sheet
201420152016201720182019202020212022Product
sales26095236412131923450.925795.9928375.58931213.147934334.4626937767.90896Extern
alization revenue452106716831851.32036.432240.0732464.08032710.488332981.537163Total
revenue26547247082300225302.227832.4230615.66233677.228237044.9510240749.44612Cos
t of sales584246464126412641264126412641264126Gross
profit20705200621887621176.223706.4226489.66229551.228232918.9510236623.44612Distri
bution cost-324-339-326-359-394-434-477-525-578R&D expenses-5579-5997-5890-6479-
7127-7840-8624-9486-10434Selling, general and administrative costs-13000-11112-9413-
10354-11390-12529-13782-15160-16676Other operating income and
expenses33515001655182120032203242326652932Sum of operating expenses-18568-15948-
13974-15371.4-16908.54-18599.394-20459.3334-22505.26674-24755.79341Operating
profit213741144902490249024902490249024902Finance
income78466774818998108119Finance expense-963-1075-1384-1522-1675-1842-2026-2229-
2452Share of after tax losses in associates and joint ventures-6-16-33-36-40-44-48-53-58Sum
8 | P a g e

of non-operating expenses-891-1045-1350-1485-1634-1797-1977-2174-2392Profit before
tax124630693552341732693105292527282510 Taxation -11-243-146-161-177-194-214-
235-259Profit for the period123528263406325630922911271224932252
9 | P a g e
tax124630693552341732693105292527282510 Taxation -11-243-146-161-177-194-214-
235-259Profit for the period123528263406325630922911271224932252
9 | P a g e
1 out of 9
Related Documents

Your All-in-One AI-Powered Toolkit for Academic Success.
+13062052269
info@desklib.com
Available 24*7 on WhatsApp / Email
Unlock your academic potential
© 2024 | Zucol Services PVT LTD | All rights reserved.