Discrete Mathematics Assignment: Venn Diagrams, Statistics
VerifiedAdded on 2021/04/24
|12
|1207
|167
Homework Assignment
AI Summary
This document presents a comprehensive solution to a discrete mathematics assignment, addressing various concepts. The solution begins with Venn diagrams to illustrate set theory problems, calculating the number of students participating in different activities. It then moves on to statistical analysis, constructing frequency tables, calculating the median, standard deviation, and drawing an ogive graph. Probability problems are solved, exploring conditional probabilities and the probability of events. The assignment further delves into calculus, solving integration problems and sketching graphs. Finally, it concludes with linear algebra, solving a system of linear equations using Cramer's rule to determine the cost of different items. The document provides detailed steps, formulas, and calculations, offering a complete guide to the assignment's solutions.
Discrete Mathematics
Student Name
Institution Name
Student Name
Institution Name
Paraphrase This Document
Need a fresh take? Get an instant paraphrase of this document with our AI Paraphraser
Question 1
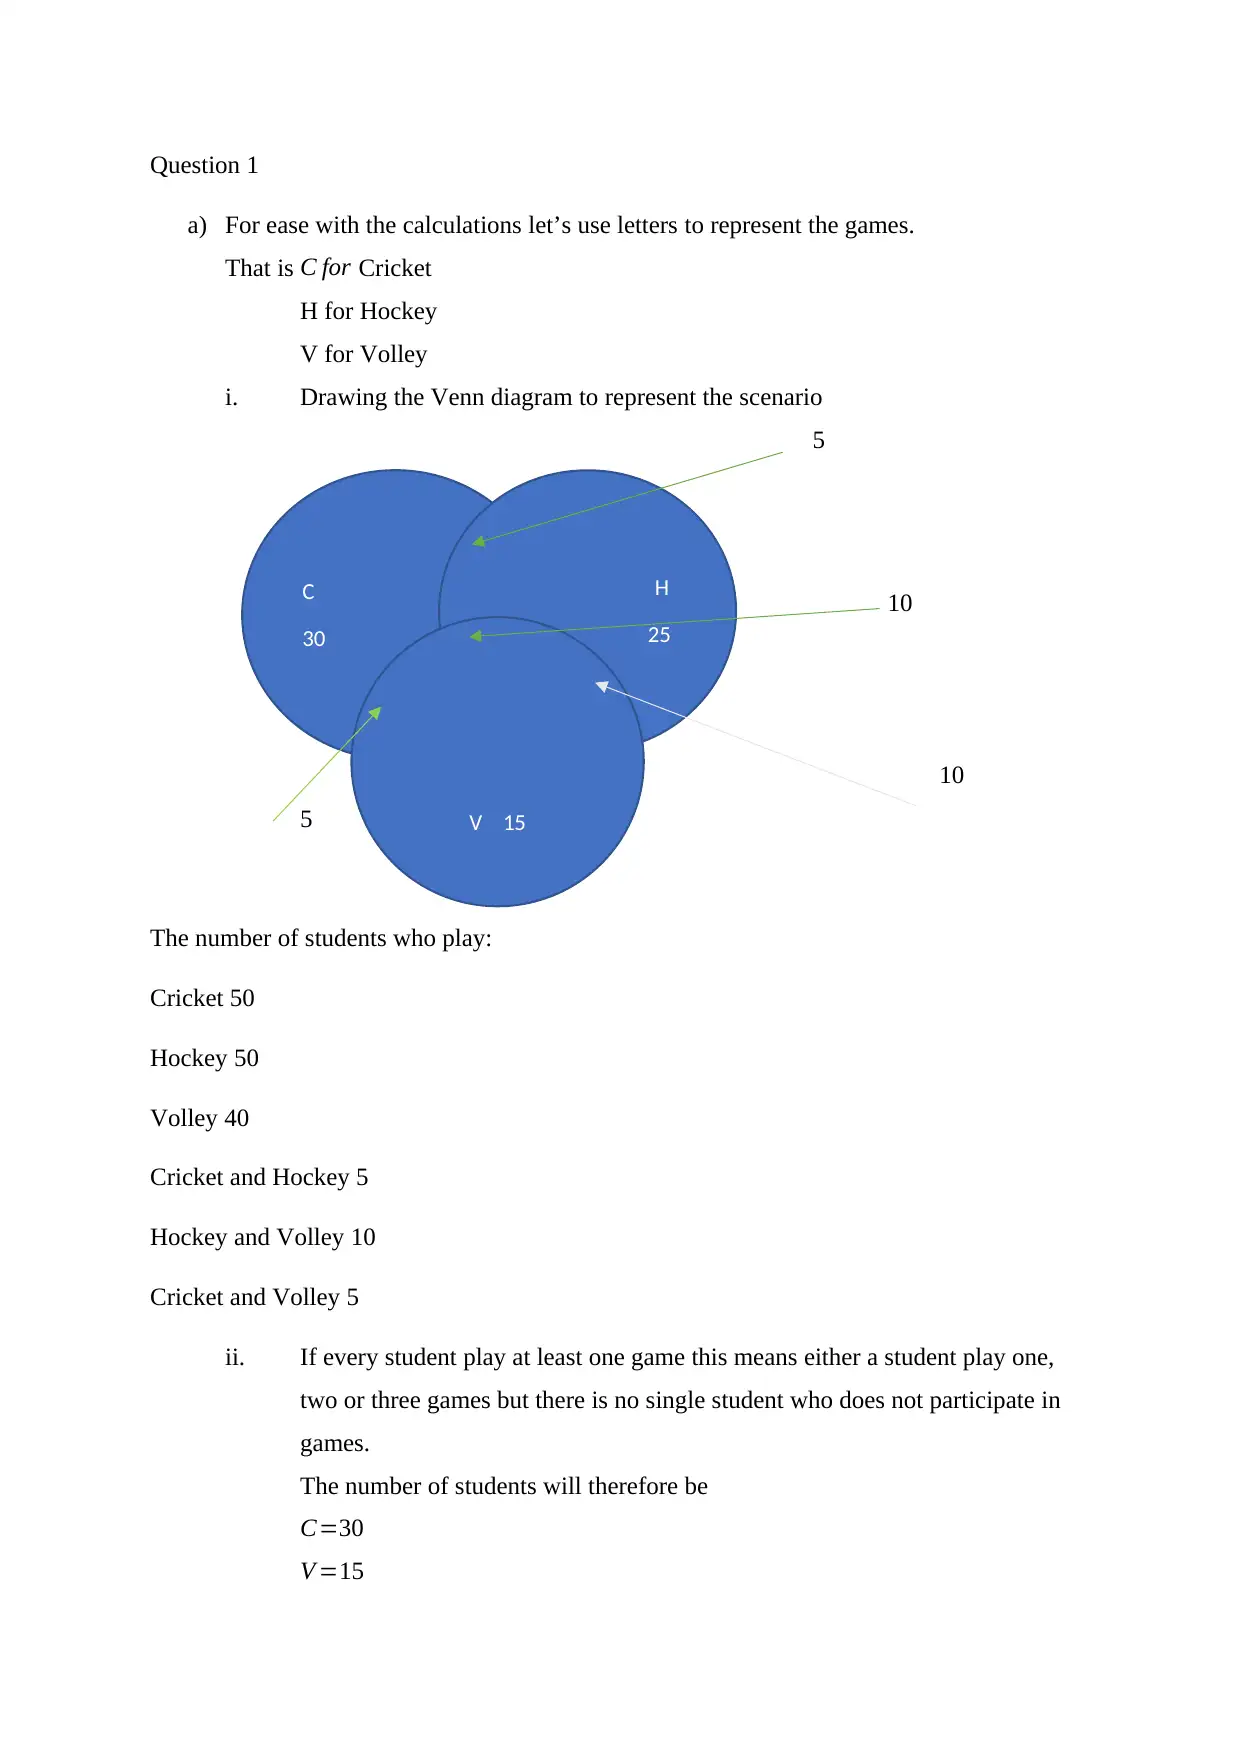
a) For ease with the calculations let’s use letters to represent the games.
That is C for Cricket
H for Hockey
V for Volley
i. Drawing the Venn diagram to represent the scenario
5
30333 10
10
5
The number of students who play:
Cricket 50
Hockey 50
Volley 40
Cricket and Hockey 5
Hockey and Volley 10
Cricket and Volley 5
ii. If every student play at least one game this means either a student play one,
two or three games but there is no single student who does not participate in
games.
The number of students will therefore be
C=30
V =15
C
30
H
25
V 15
V
H=25
C∧H=5
H∧V =10
C∧V =5
all three games=10
This gives the total number of students to be 100
iii. The number of students who play cricket only
Total playing cricket is 50, all three games are played by 10 students.
Cricket and hockey 5 students and finally cricket and volley 5 students.
Hence cricket only will be
50− ( 5+5+10 )=30 students
iv. The number of students who are playing hockey and volleyball only, but no
cricket are 10 students.
This number can be obtained directly from the Venn diagram by checking the
intersection of H and V.
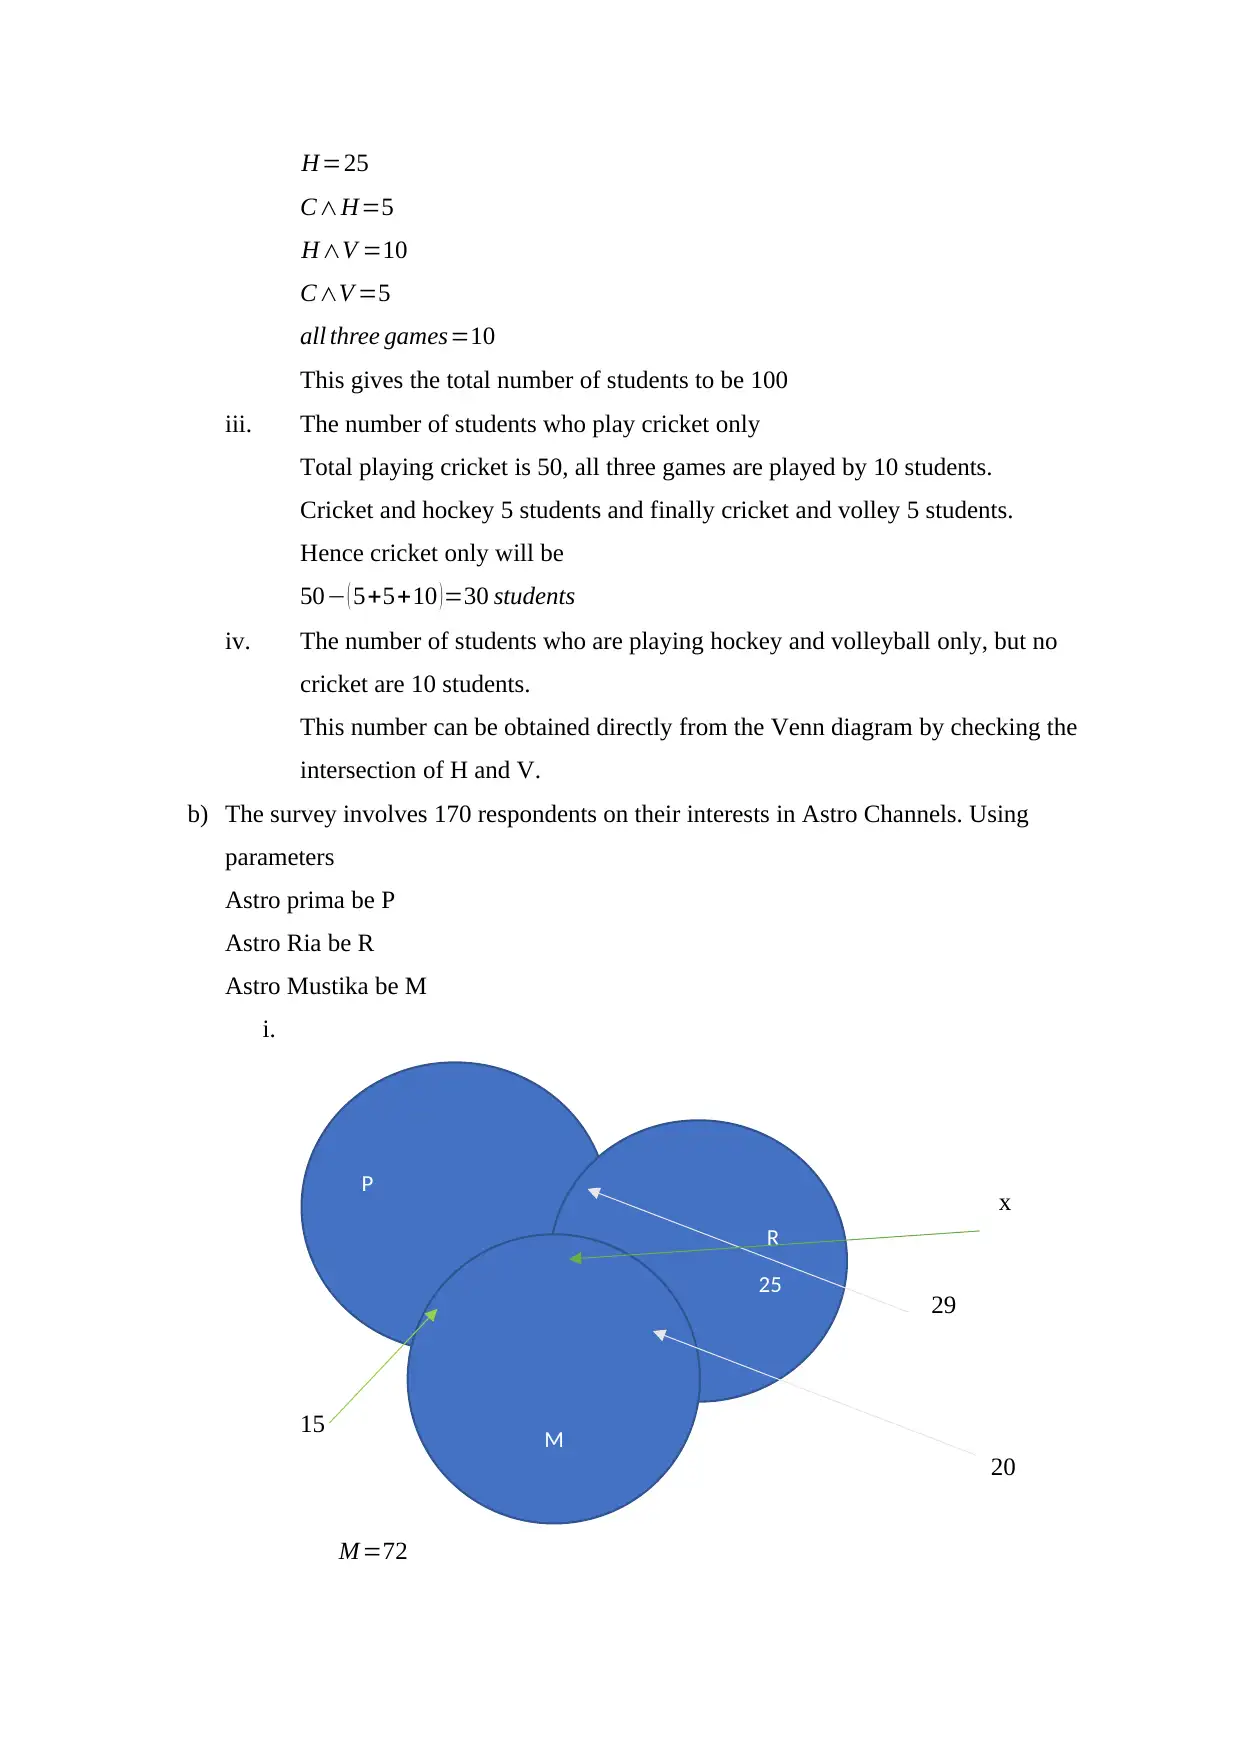
b) The survey involves 170 respondents on their interests in Astro Channels. Using
parameters
Astro prima be P
Astro Ria be R
Astro Mustika be M
i.
5 x
29
15
20
M =72
P
R
25
M
V
C∧H=5
H∧V =10
C∧V =5
all three games=10
This gives the total number of students to be 100
iii. The number of students who play cricket only
Total playing cricket is 50, all three games are played by 10 students.
Cricket and hockey 5 students and finally cricket and volley 5 students.
Hence cricket only will be
50− ( 5+5+10 )=30 students
iv. The number of students who are playing hockey and volleyball only, but no
cricket are 10 students.
This number can be obtained directly from the Venn diagram by checking the
intersection of H and V.
b) The survey involves 170 respondents on their interests in Astro Channels. Using
parameters
Astro prima be P
Astro Ria be R
Astro Mustika be M
i.
5 x
29
15
20
M =72
P
R
25
M
V
⊘ This is a preview!⊘
Do you want full access?
Subscribe today to unlock all pages.
Trusted by 1+ million students worldwide
P=78
R=78
R∧M =20
P and M¿ 15
P∧R=29
Total 170 respondents
ii. Assuming no respondent like all the 3 channels that means the value of x is
zero. Then the number of respondents who like Astro Musika only will be
Total who like Astro Musika¿ 72
Then R∧M =20
And P∧M =15
M only will therefore be 72− ( 15+ 20 )=37 respondents
iii. The number of respondents who like at least 2 channels.
P∧R=29
P∧M =15
M ∧R=20
Total will be 64 respondents
iv. Respondents who like P∧M =15, this value can be observed directly from
the Venn diagram.
Question 2
a.
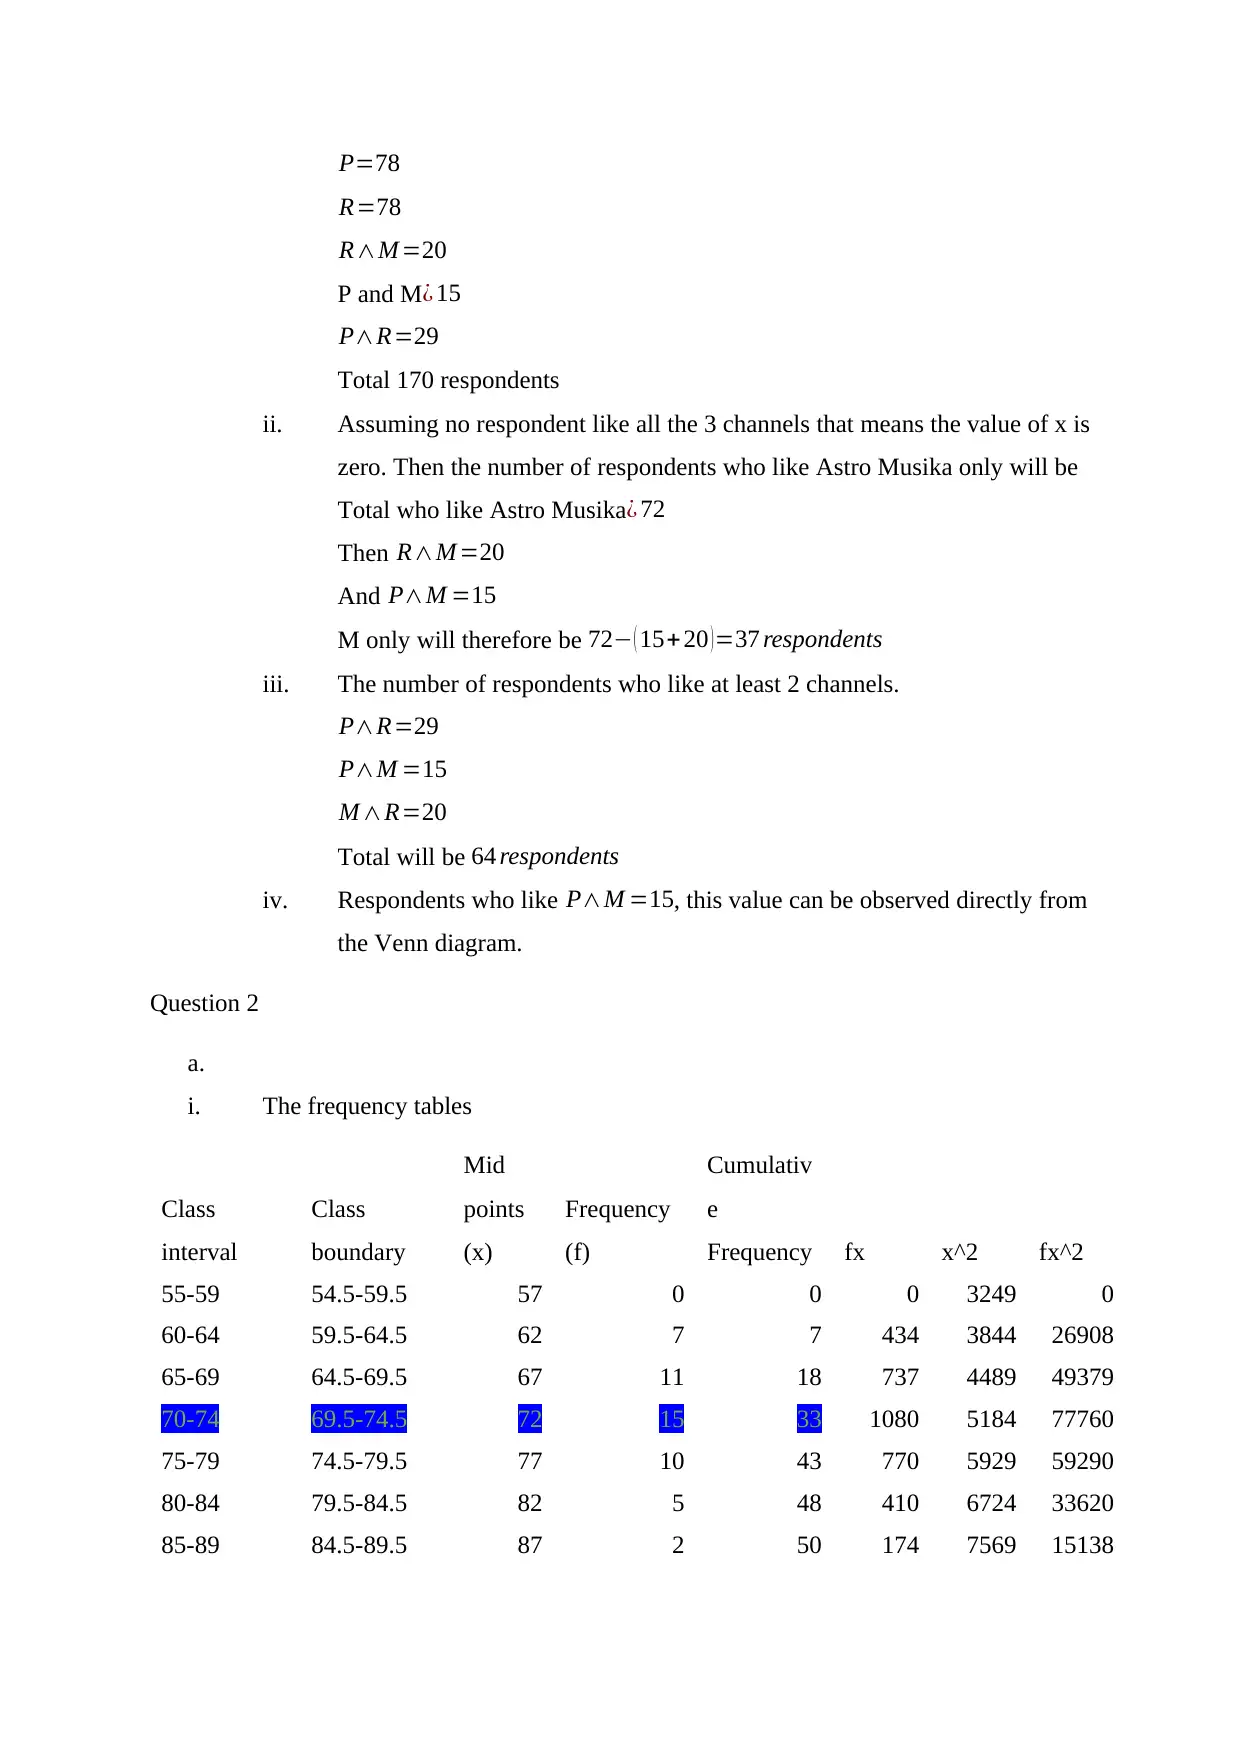
i. The frequency tables
Class
interval
Class
boundary
Mid
points
(x)
Frequency
(f)
Cumulativ
e
Frequency fx x^2 fx^2
55-59 54.5-59.5 57 0 0 0 3249 0
60-64 59.5-64.5 62 7 7 434 3844 26908
65-69 64.5-69.5 67 11 18 737 4489 49379
70-74 69.5-74.5 72 15 33 1080 5184 77760
75-79 74.5-79.5 77 10 43 770 5929 59290
80-84 79.5-84.5 82 5 48 410 6724 33620
85-89 84.5-89.5 87 2 50 174 7569 15138
R=78
R∧M =20
P and M¿ 15
P∧R=29
Total 170 respondents
ii. Assuming no respondent like all the 3 channels that means the value of x is
zero. Then the number of respondents who like Astro Musika only will be
Total who like Astro Musika¿ 72
Then R∧M =20
And P∧M =15
M only will therefore be 72− ( 15+ 20 )=37 respondents
iii. The number of respondents who like at least 2 channels.
P∧R=29
P∧M =15
M ∧R=20
Total will be 64 respondents
iv. Respondents who like P∧M =15, this value can be observed directly from
the Venn diagram.
Question 2
a.
i. The frequency tables
Class
interval
Class
boundary
Mid
points
(x)
Frequency
(f)
Cumulativ
e
Frequency fx x^2 fx^2
55-59 54.5-59.5 57 0 0 0 3249 0
60-64 59.5-64.5 62 7 7 434 3844 26908
65-69 64.5-69.5 67 11 18 737 4489 49379
70-74 69.5-74.5 72 15 33 1080 5184 77760
75-79 74.5-79.5 77 10 43 770 5929 59290
80-84 79.5-84.5 82 5 48 410 6724 33620
85-89 84.5-89.5 87 2 50 174 7569 15138
Paraphrase This Document
Need a fresh take? Get an instant paraphrase of this document with our AI Paraphraser
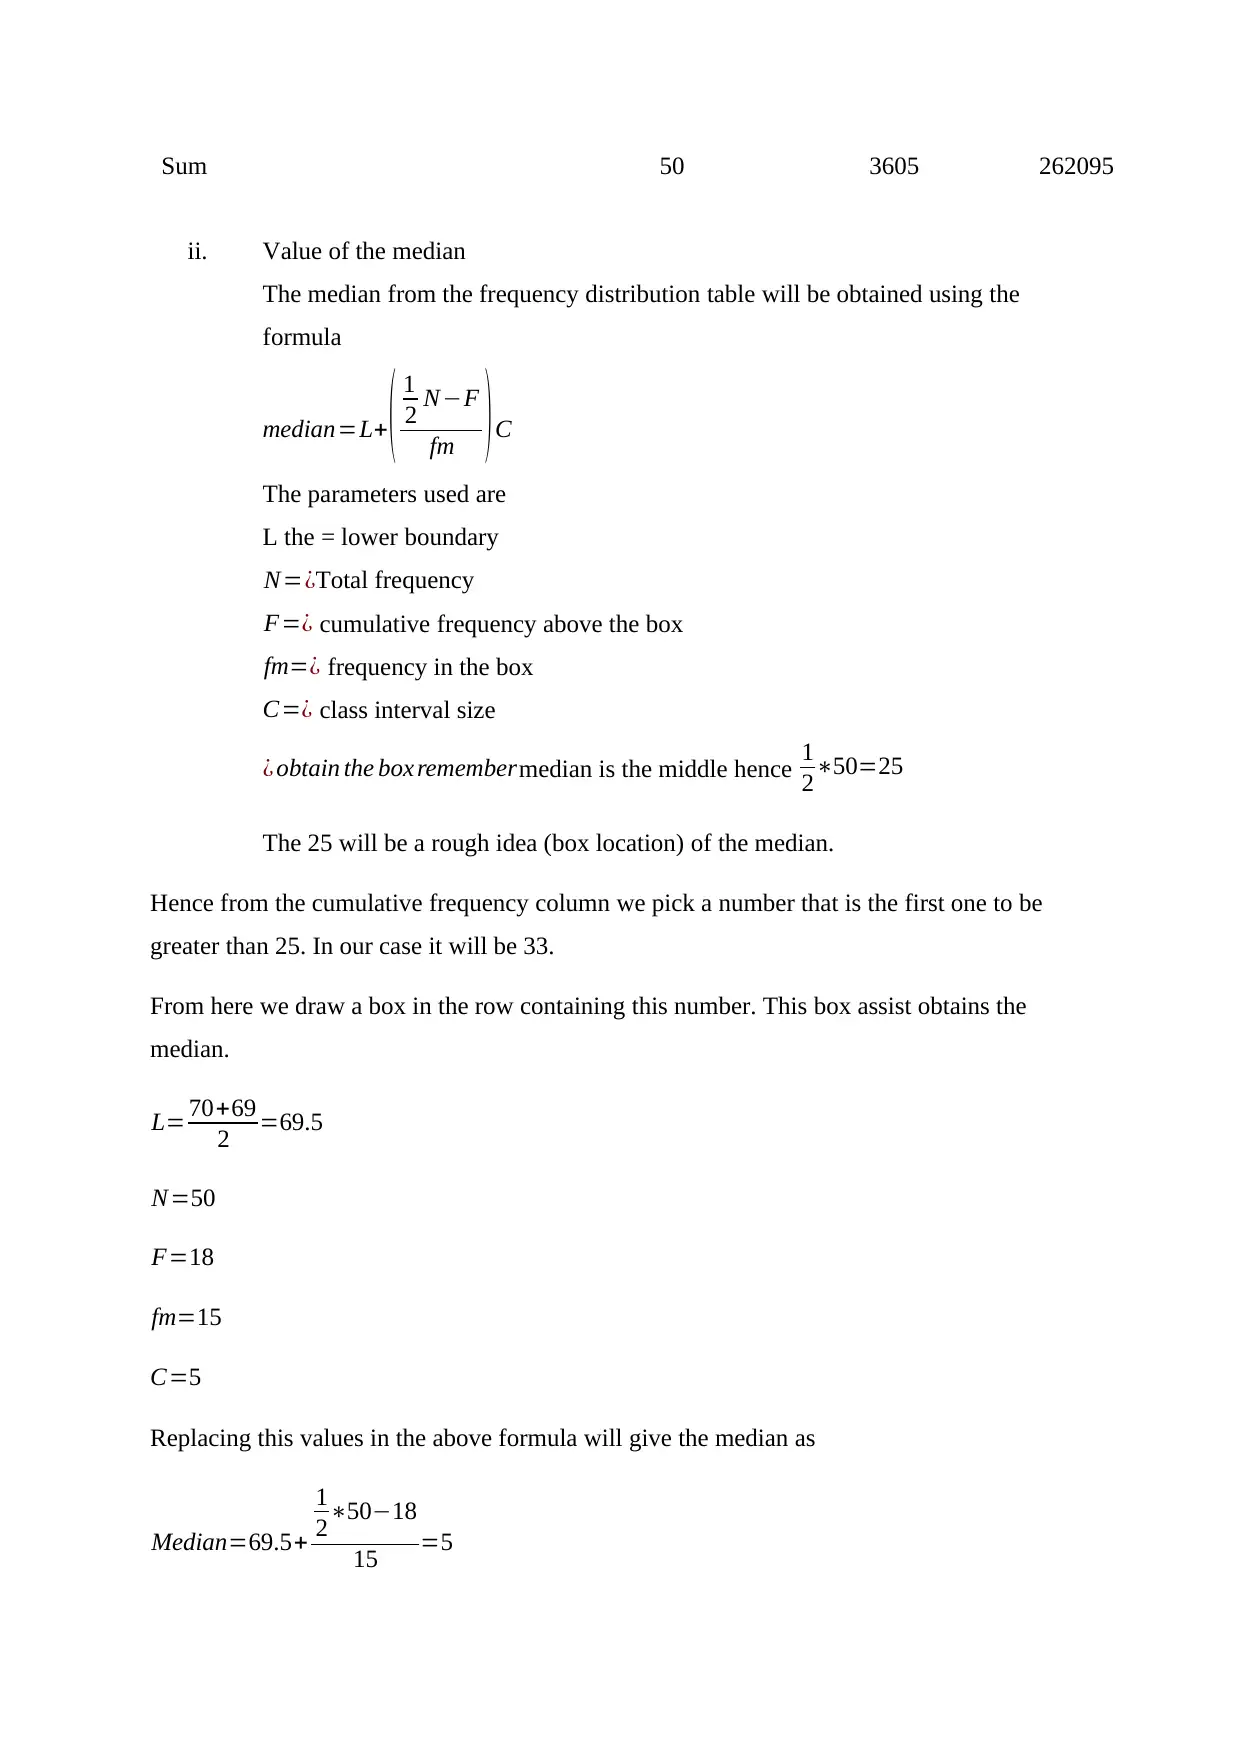
Sum 50 3605 262095
ii. Value of the median
The median from the frequency distribution table will be obtained using the
formula
median=L+ ( 1
2 N−F
fm ) C
The parameters used are
L the = lower boundary
N=¿Total frequency
F=¿ cumulative frequency above the box
fm=¿ frequency in the box
C=¿ class interval size
¿ obtain the box remembermedian is the middle hence 1
2∗50=25
The 25 will be a rough idea (box location) of the median.
Hence from the cumulative frequency column we pick a number that is the first one to be
greater than 25. In our case it will be 33.
From here we draw a box in the row containing this number. This box assist obtains the
median.
L= 70+69
2 =69.5
N=50
F=18
fm=15
C=5
Replacing this values in the above formula will give the median as
Median=69.5+
1
2∗50−18
15 =5
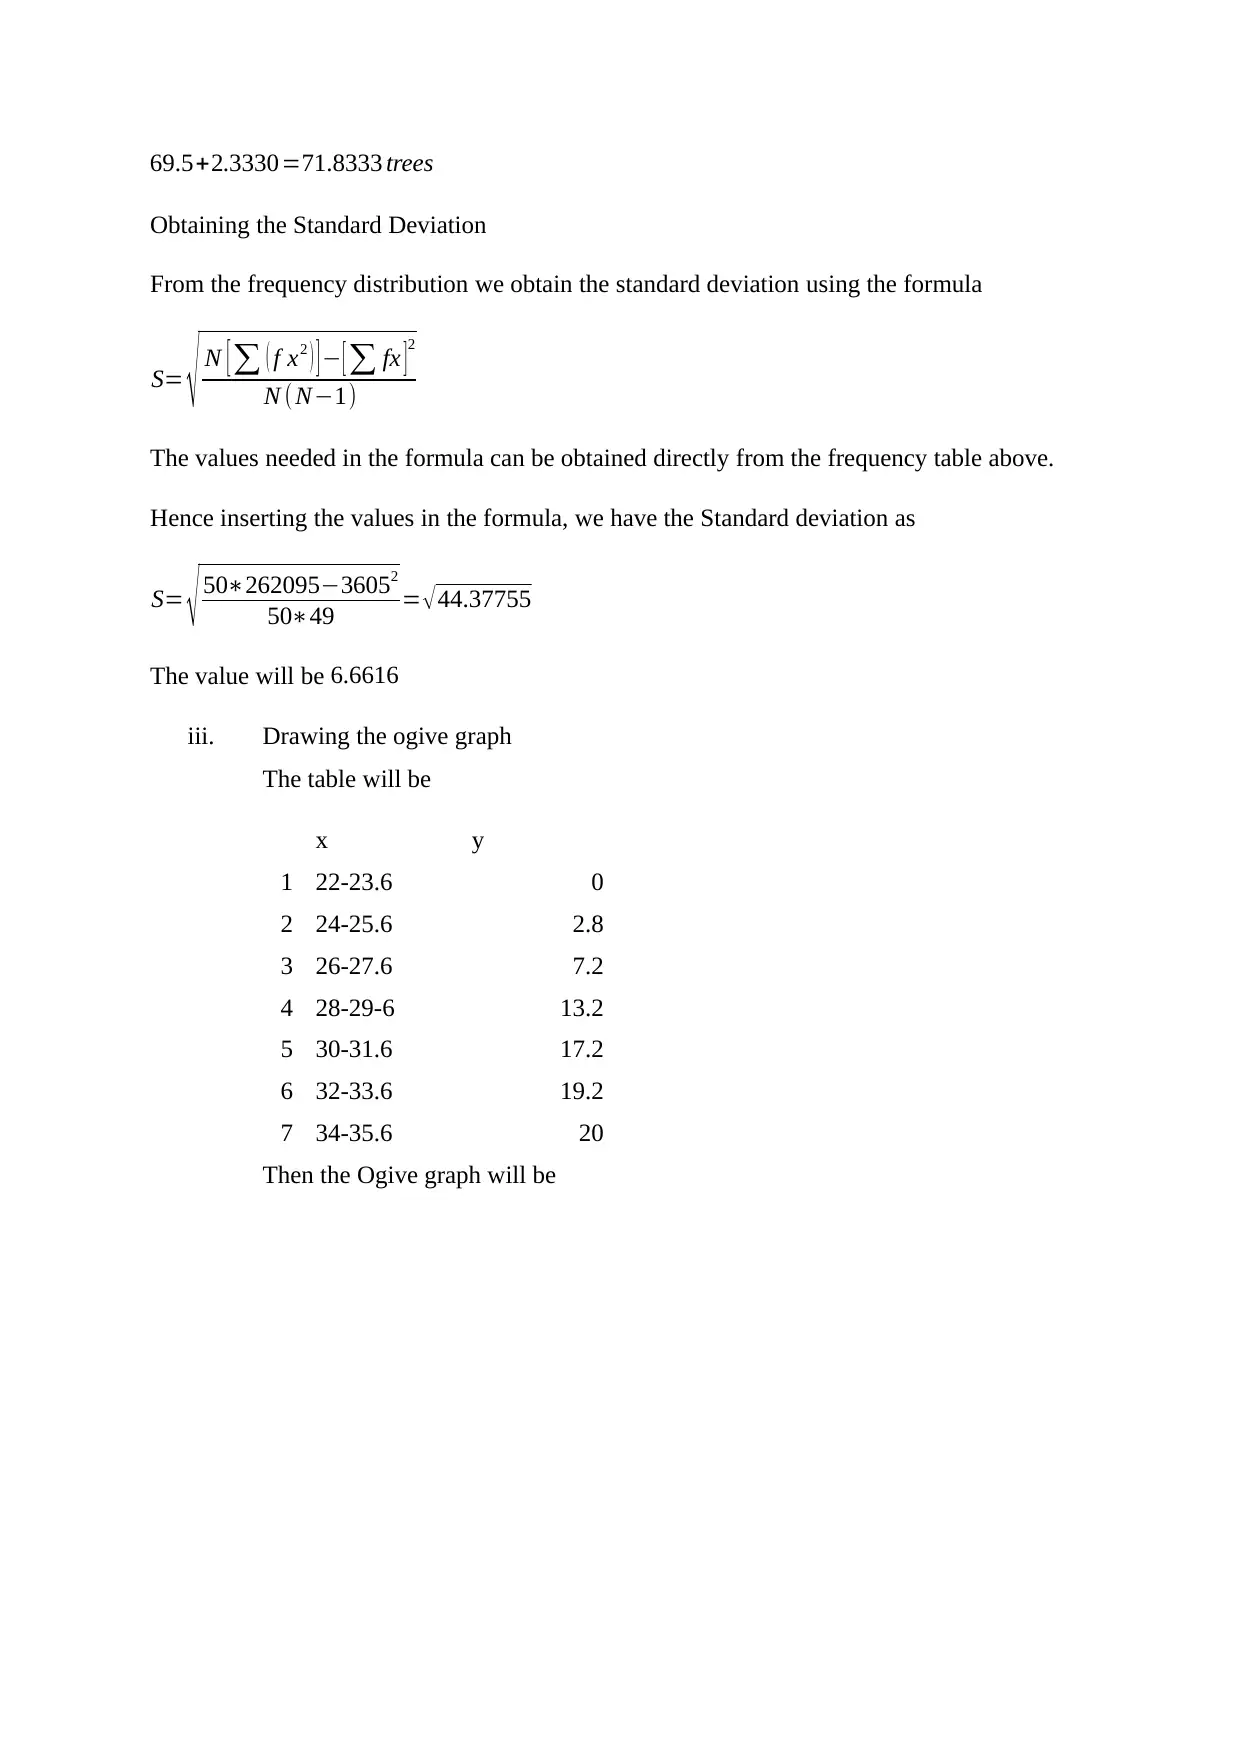
69.5+2.3330=71.8333 trees
Obtaining the Standard Deviation
From the frequency distribution we obtain the standard deviation using the formula
S= √ N [ ∑ ( f x2 ) ] − [ ∑ fx ]2
N ( N−1)
The values needed in the formula can be obtained directly from the frequency table above.
Hence inserting the values in the formula, we have the Standard deviation as
S= √ 50∗262095−36052
50∗49 = √ 44.37755
The value will be 6.6616
iii. Drawing the ogive graph
The table will be
x y
1 22-23.6 0
2 24-25.6 2.8
3 26-27.6 7.2
4 28-29-6 13.2
5 30-31.6 17.2
6 32-33.6 19.2
7 34-35.6 20
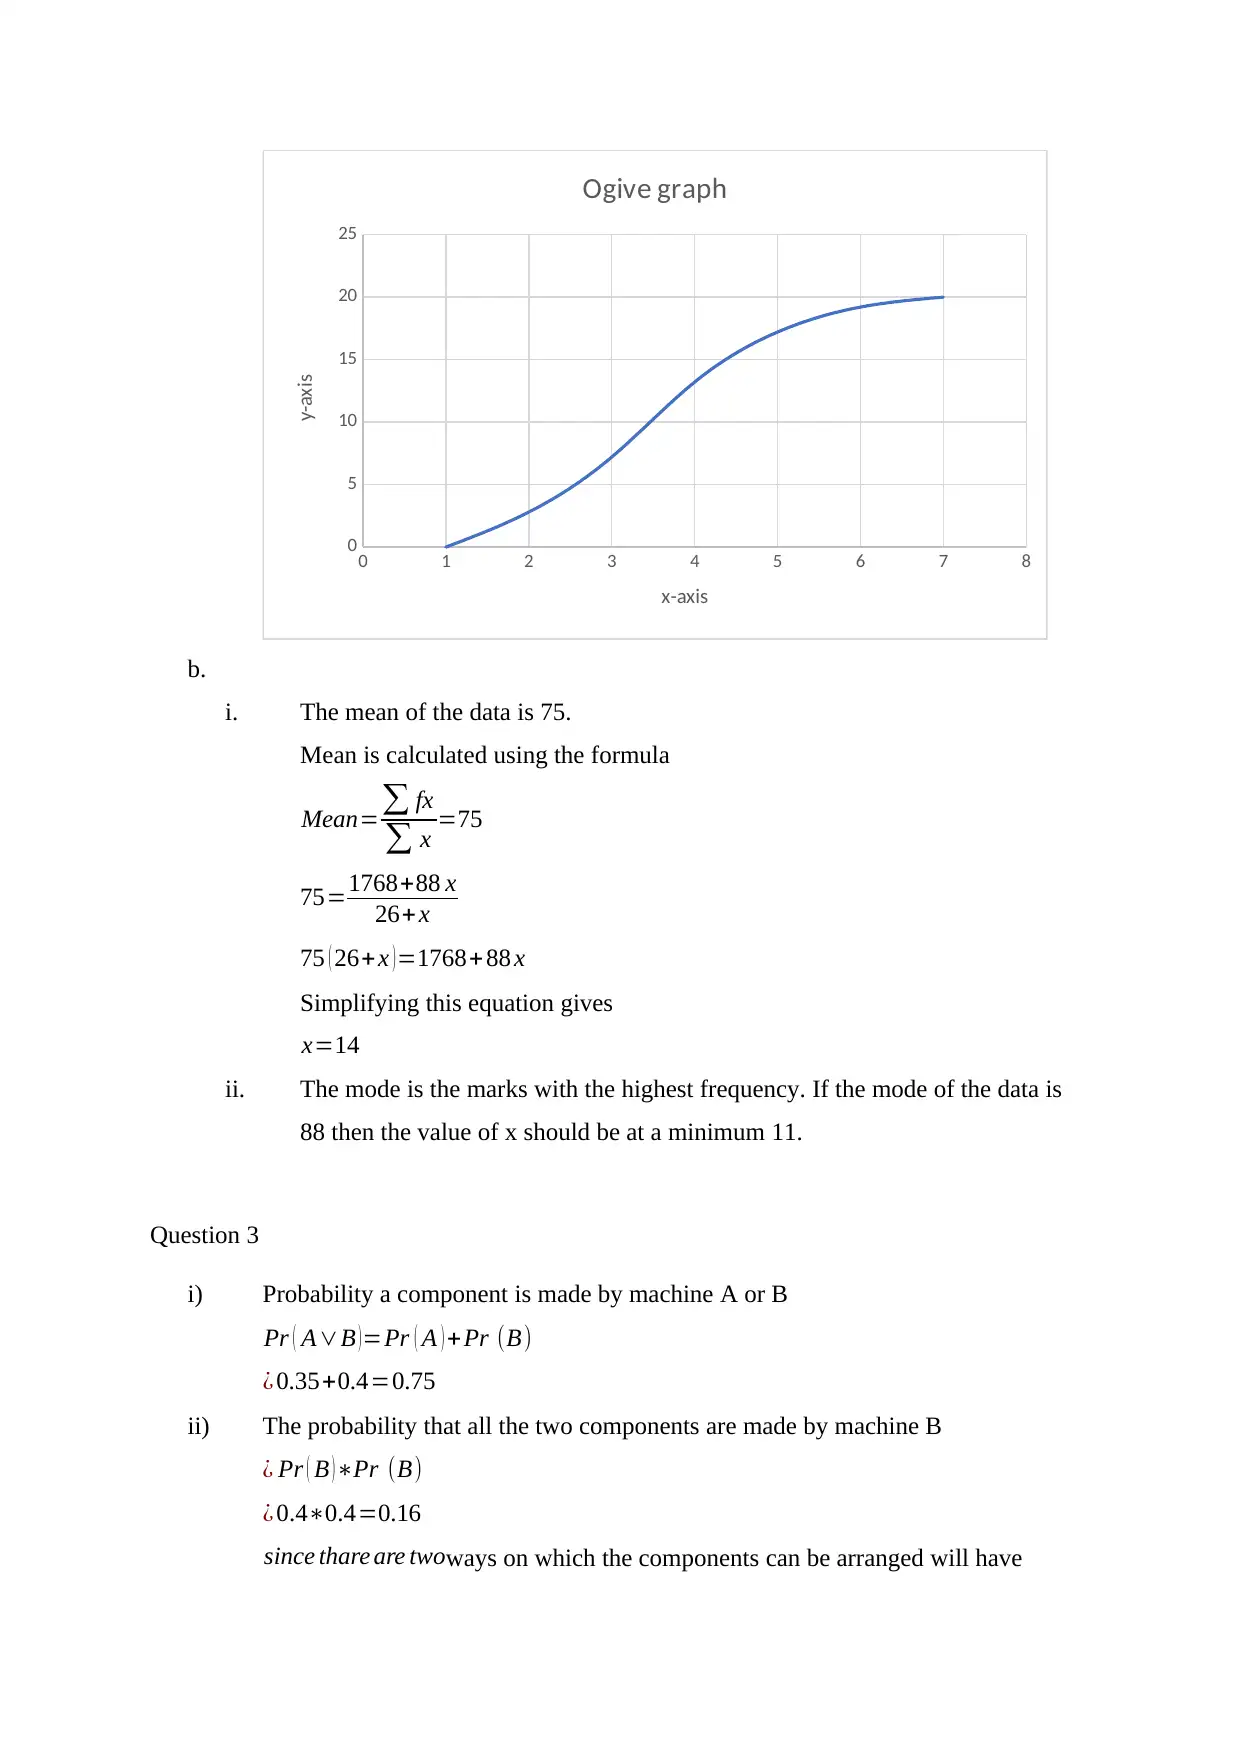
Then the Ogive graph will be
Obtaining the Standard Deviation
From the frequency distribution we obtain the standard deviation using the formula
S= √ N [ ∑ ( f x2 ) ] − [ ∑ fx ]2
N ( N−1)
The values needed in the formula can be obtained directly from the frequency table above.
Hence inserting the values in the formula, we have the Standard deviation as
S= √ 50∗262095−36052
50∗49 = √ 44.37755
The value will be 6.6616
iii. Drawing the ogive graph
The table will be
x y
1 22-23.6 0
2 24-25.6 2.8
3 26-27.6 7.2
4 28-29-6 13.2
5 30-31.6 17.2
6 32-33.6 19.2
7 34-35.6 20
Then the Ogive graph will be
⊘ This is a preview!⊘
Do you want full access?
Subscribe today to unlock all pages.
Trusted by 1+ million students worldwide
0 1 2 3 4 5 6 7 8
0
5
10
15
20
25
Ogive graph
x-axis
y-axis
b.
i. The mean of the data is 75.
Mean is calculated using the formula
Mean=∑ fx
∑ x =75
75=1768+88 x
26+x
75 ( 26+x )=1768+ 88 x
Simplifying this equation gives
x=14
ii. The mode is the marks with the highest frequency. If the mode of the data is
88 then the value of x should be at a minimum 11.
Question 3
i) Probability a component is made by machine A or B
Pr ( A∨B )=Pr ( A ) +Pr (B)
¿ 0.35+0.4=0.75
ii) The probability that all the two components are made by machine B
¿ Pr ( B ) ∗Pr (B)
¿ 0.4∗0.4=0.16
since thare are twoways on which the components can be arranged will have
Paraphrase This Document
Need a fresh take? Get an instant paraphrase of this document with our AI Paraphraser
0.162 =0.0256 as the definitive answer.
iii. The probability of A and B and C
Pr ( A∧B∧C )=Pr ( A )∗Pr ( B )∗pr ( C )=0.35∗0.4∗0.25
This gives 0.035
Since there are nine ways of arranging the products depending on which
machine produced them then the answer is raised to power 3 to give
0.0353 =0.000042875
iv. The probability of not acceptable
¿ P ( A∧not acceptable ) ∨P( B∧not acceptable)∨P (C∧not acceptable)
¿ ( 0.35∗0.07 ) + ( 0.4∗0.12 )+ ( 0.25∗0.02 )=0.0775
v. The probability of B given not acceptable
P (B∧not acceptable)
P ( not acceptable ) = 0.048
0.0775 =0.6194
vi. Probability of acceptable
Pr ( A∧acceptable ) + Pr ( B∧acceptable ) + Pr (C∧acceptable)
¿ ( 0.35∗0.093 ) + ( 0.4∗0.88 )+ ( 0.25∗0.98 )=0.9225
Pr ( AorB given acceptable)
¿ Pr ( AorB∧acceptable)
Pr (acceptable ) = 0.75∗0.9225
0.9225 =0.75
Question 4
a.
i. ∫
1
9
2 x2 +x2 √x−1
x2 dx
¿∫
1
9
2+ √ x−1
1 dx
¿ 31.0849
ii. ∫
2
3
( x3−2 x2 ) ( 1
x −5 )dx
¿∫
2
3
(−5 x3−9 x2−2 x) dx
¿−¿143.25
b. Sketching the graphs
-50 0 50 100 150 200 250 300 350 400
-50
-40
-30
-20
-10
0
10
20
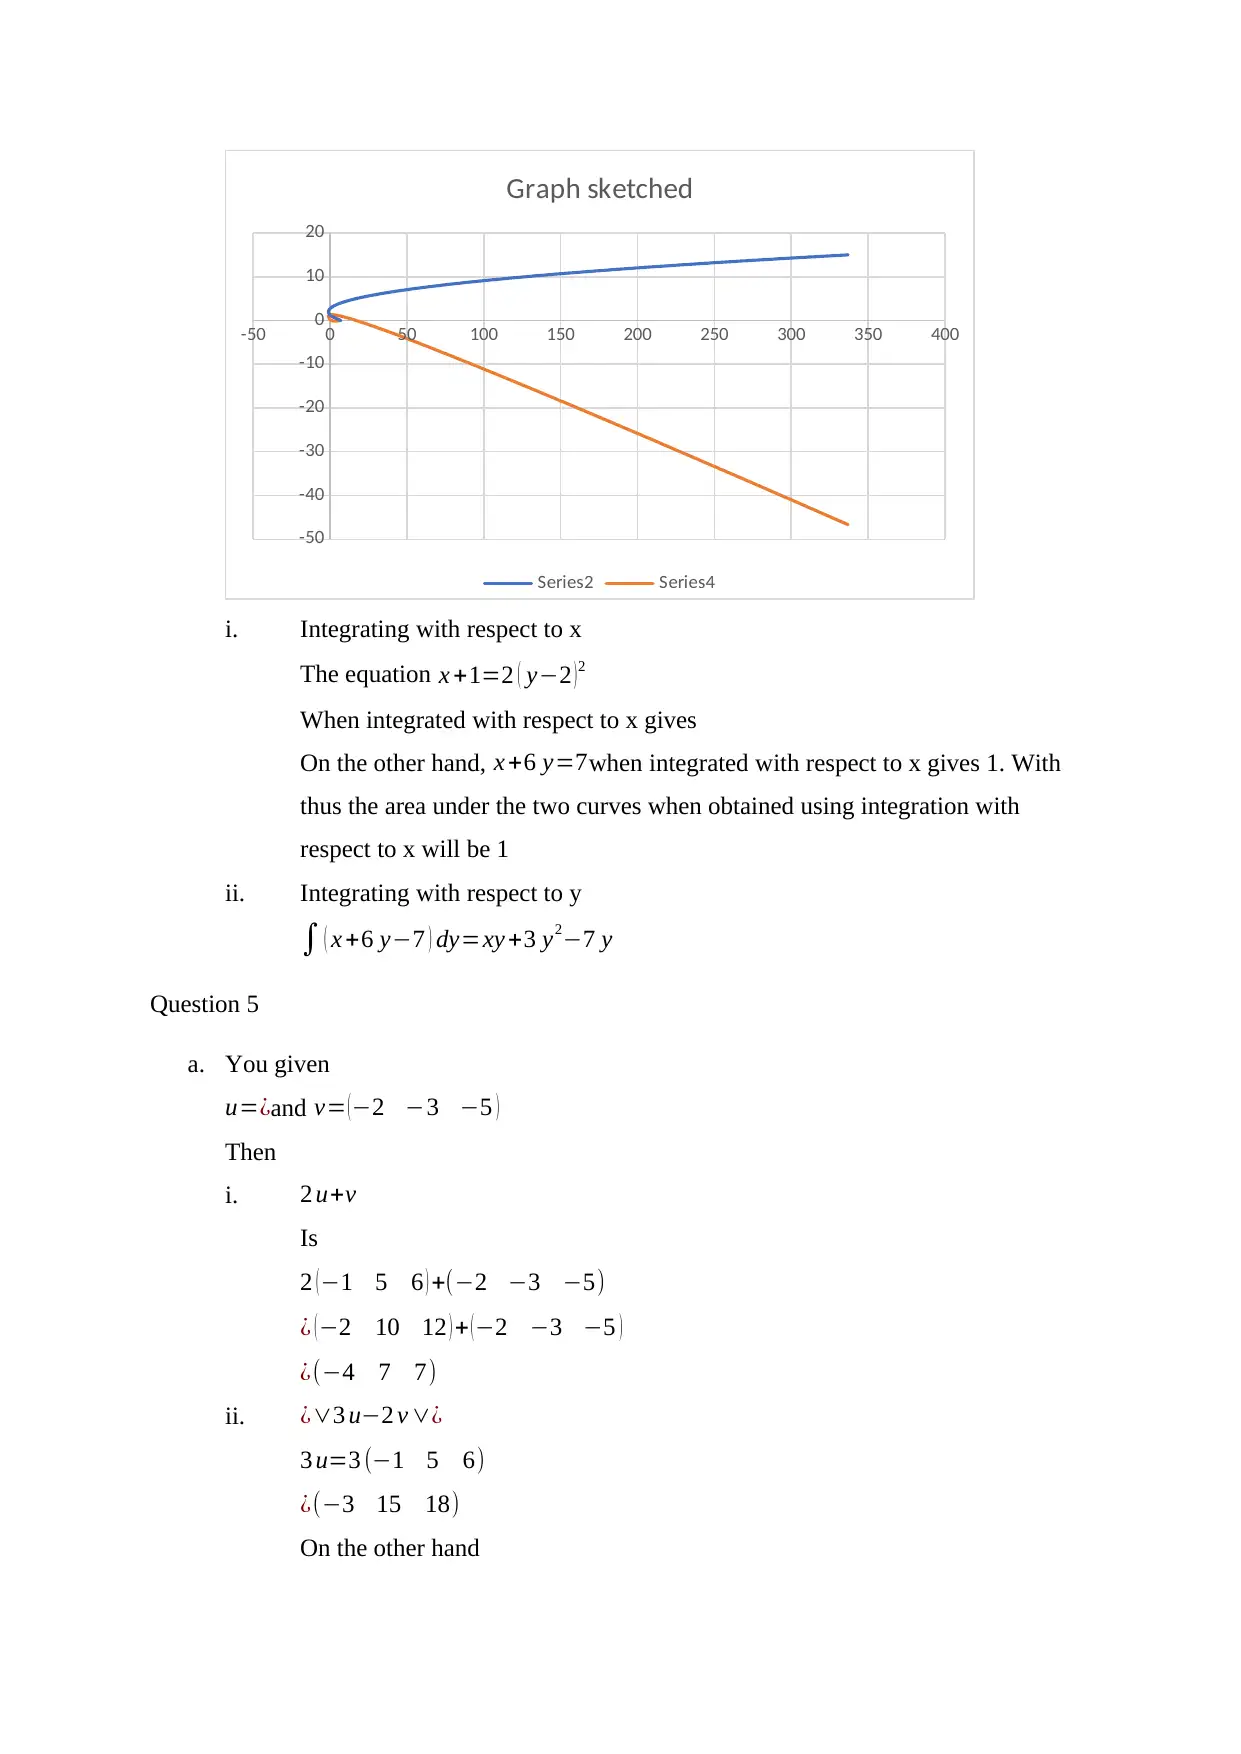
Graph sketched
Series2 Series4
i. Integrating with respect to x
The equation x +1=2 ( y−2 ) 2
When integrated with respect to x gives
On the other hand, x +6 y=7when integrated with respect to x gives 1. With
thus the area under the two curves when obtained using integration with
respect to x will be 1
ii. Integrating with respect to y
∫ ( x +6 y−7 ) dy=xy +3 y2−7 y
Question 5
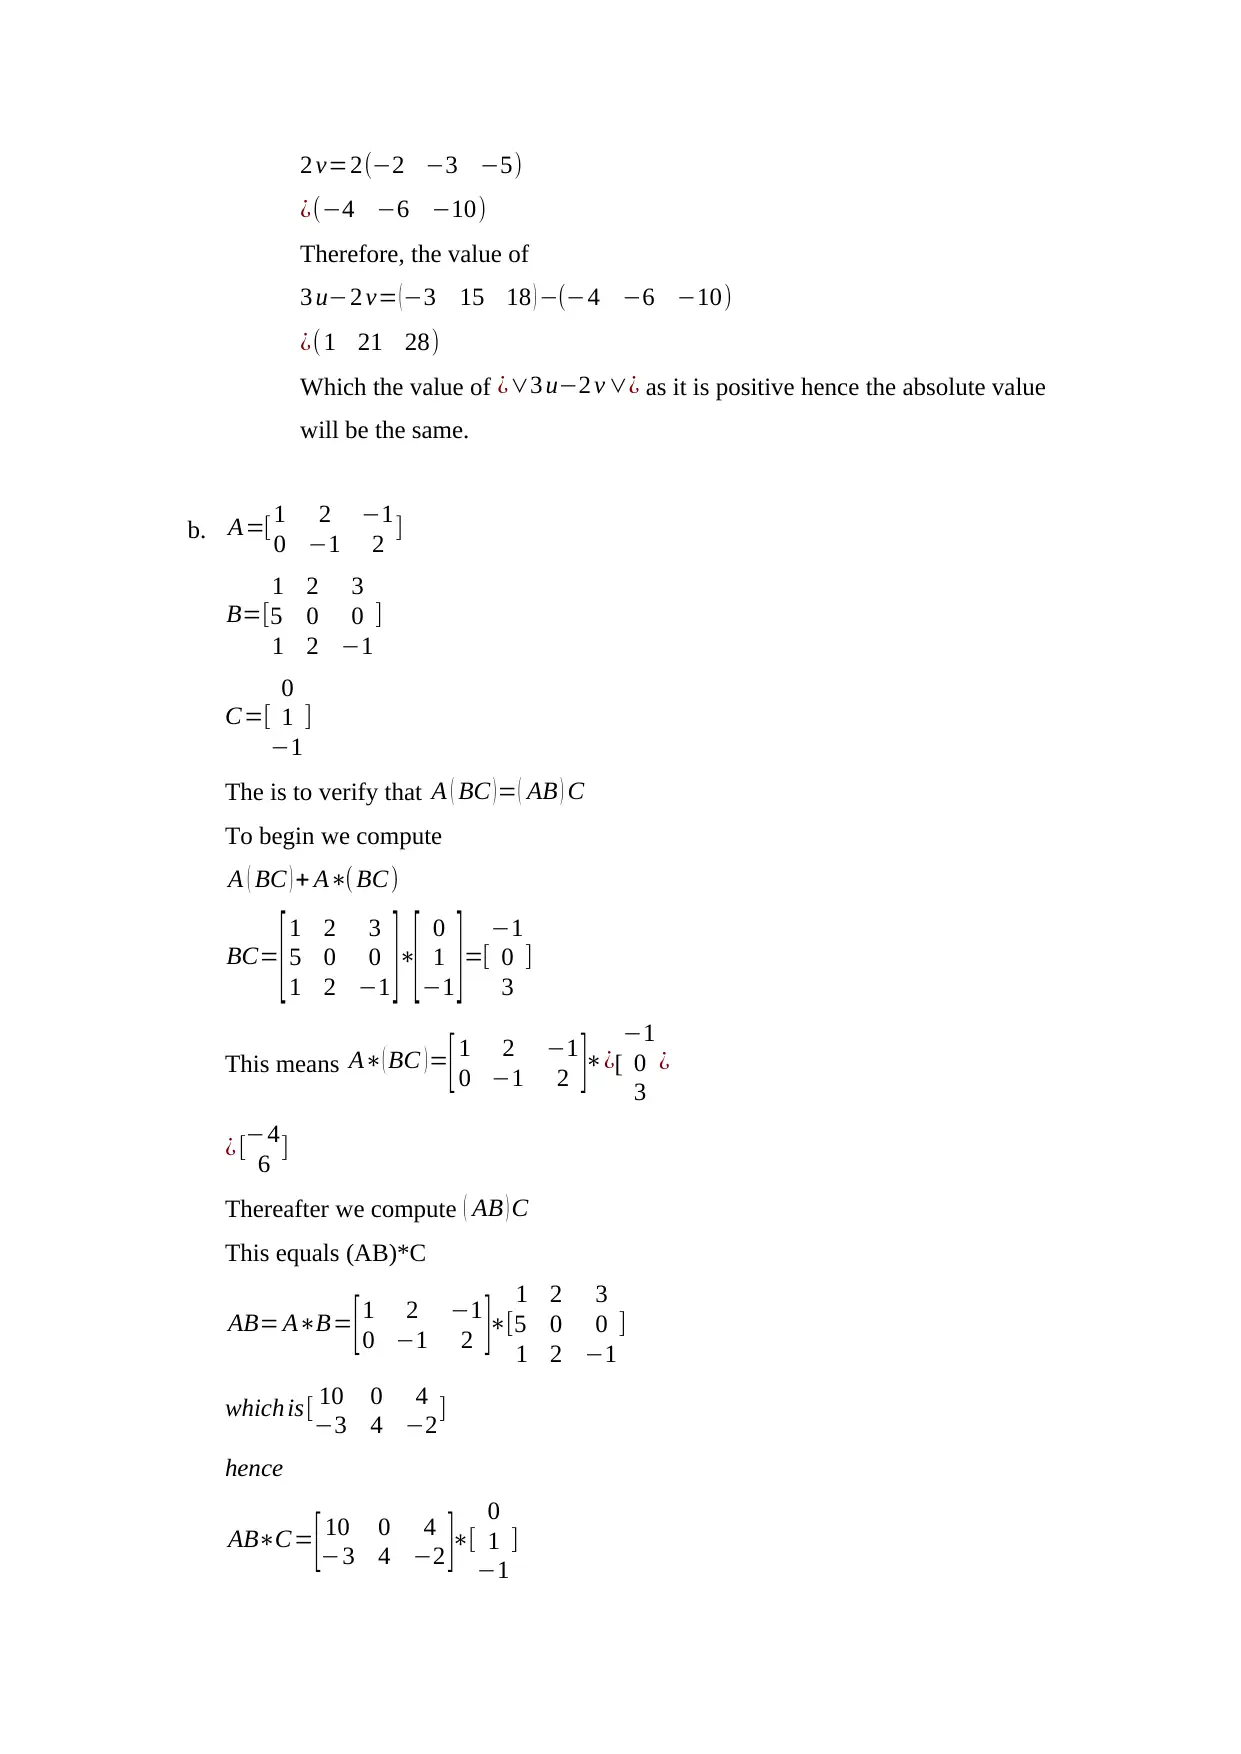
a. You given
u=¿and v= (−2 −3 −5 )
Then
i. 2 u+v
Is
2 ( −1 5 6 ) +(−2 −3 −5)
¿ (−2 10 12 ) + (−2 −3 −5 )
¿(−4 7 7)
ii. ¿∨3 u−2 v ∨¿
3 u=3 (−1 5 6)
¿(−3 15 18)
On the other hand
-50
-40
-30
-20
-10
0
10
20
Graph sketched
Series2 Series4
i. Integrating with respect to x
The equation x +1=2 ( y−2 ) 2
When integrated with respect to x gives
On the other hand, x +6 y=7when integrated with respect to x gives 1. With
thus the area under the two curves when obtained using integration with
respect to x will be 1
ii. Integrating with respect to y
∫ ( x +6 y−7 ) dy=xy +3 y2−7 y
Question 5
a. You given
u=¿and v= (−2 −3 −5 )
Then
i. 2 u+v
Is
2 ( −1 5 6 ) +(−2 −3 −5)
¿ (−2 10 12 ) + (−2 −3 −5 )
¿(−4 7 7)
ii. ¿∨3 u−2 v ∨¿
3 u=3 (−1 5 6)
¿(−3 15 18)
On the other hand
⊘ This is a preview!⊘
Do you want full access?
Subscribe today to unlock all pages.
Trusted by 1+ million students worldwide
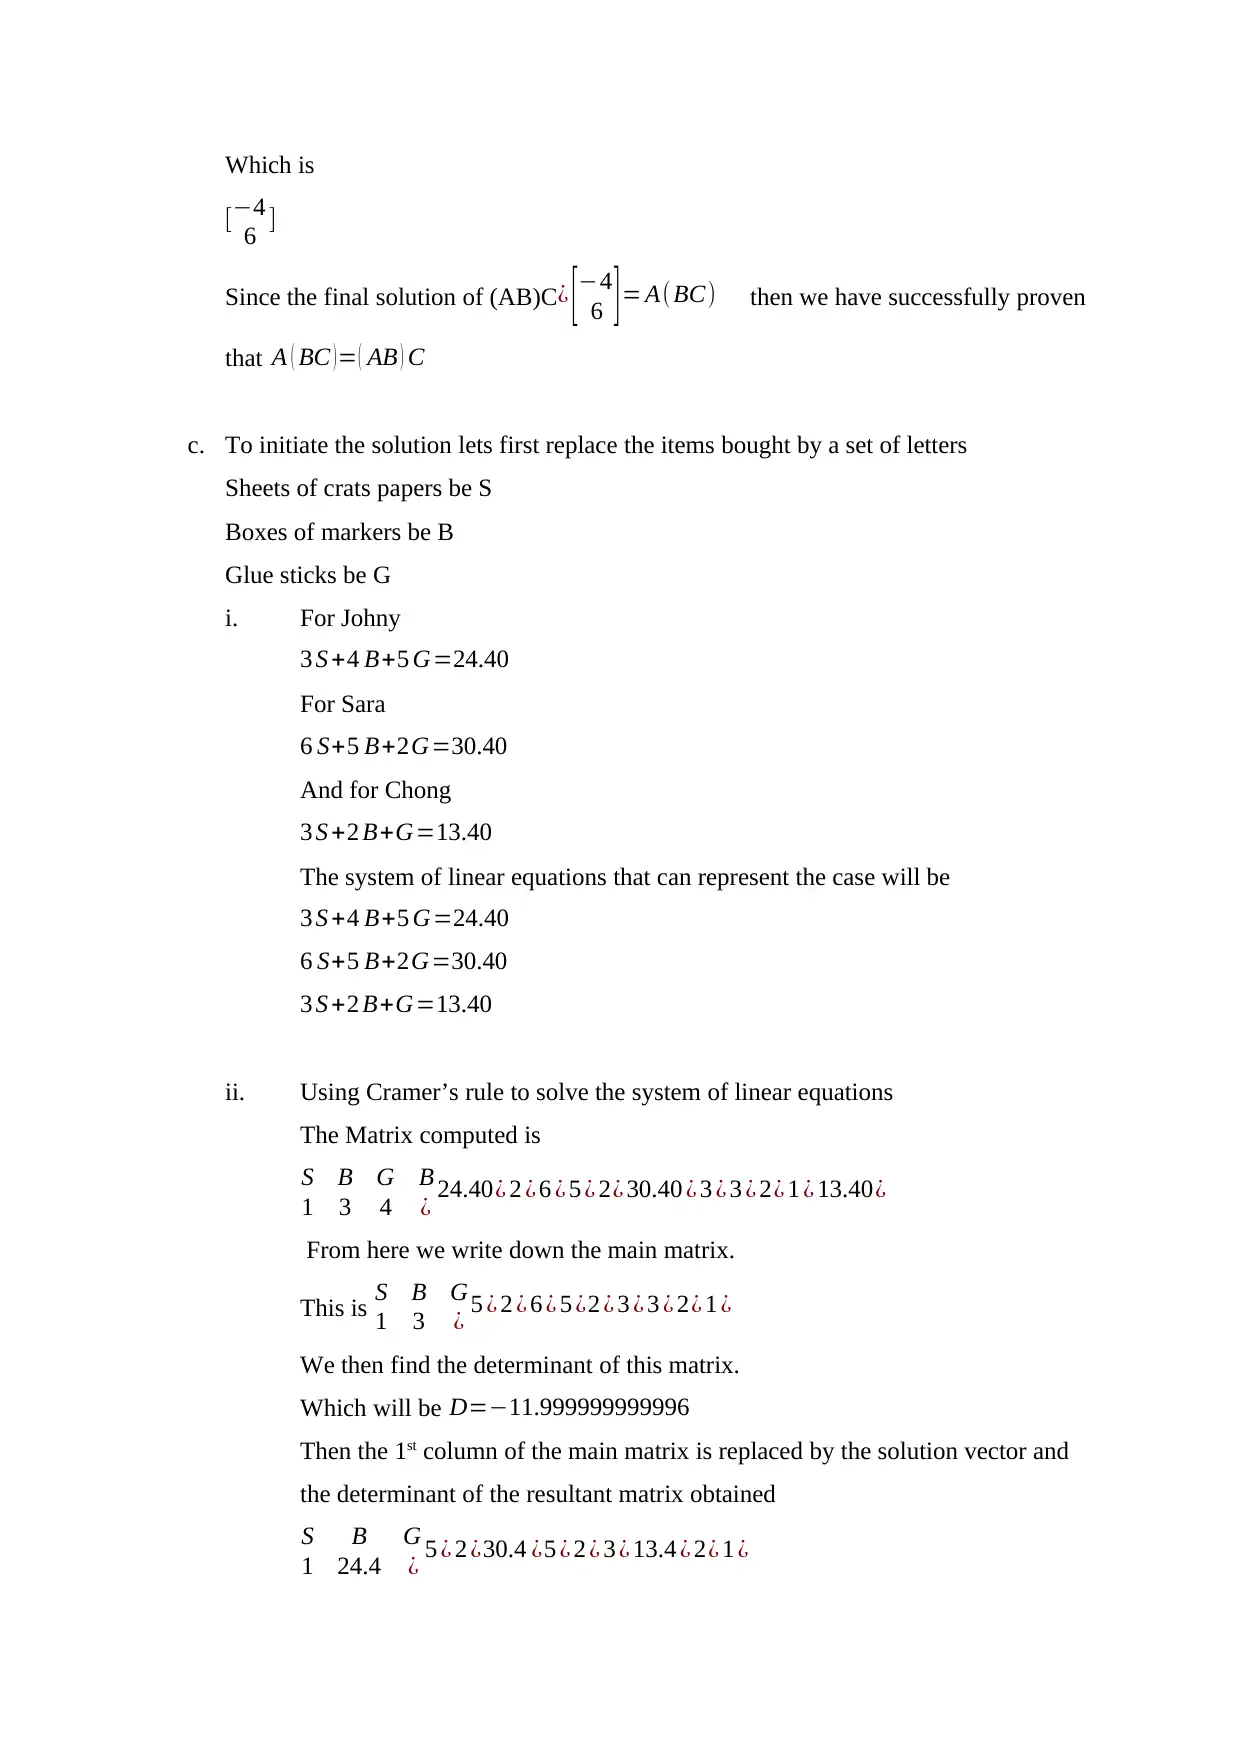
2 v=2(−2 −3 −5)
¿(−4 −6 −10)
Therefore, the value of
3 u−2 v= ( −3 15 18 ) −(−4 −6 −10)
¿( 1 21 28)
Which the value of ¿∨3 u−2 v ∨¿ as it is positive hence the absolute value
will be the same.
b. A=[1 2 −1
0 −1 2 ]
B=[
1 2 3
5 0 0
1 2 −1
]
C=[
0
1
−1
]
The is to verify that A ( BC )= ( AB ) C
To begin we compute
A ( BC ) + A∗( BC)
BC= [1 2 3
5 0 0
1 2 −1 ]∗
[ 0
1
−1 ]=[
−1
0
3
]
This means A∗( BC ) = [ 1 2 −1
0 −1 2 ]∗¿[
−1
0
3
¿
¿ [−4
6 ]
Thereafter we compute ( AB ) C
This equals (AB)*C
AB= A∗B= [1 2 −1
0 −1 2 ]∗[
1 2 3
5 0 0
1 2 −1
]
which is[ 10 0 4
−3 4 −2]
hence
AB∗C= [ 10 0 4
−3 4 −2 ]∗[
0
1
−1
]
Paraphrase This Document
Need a fresh take? Get an instant paraphrase of this document with our AI Paraphraser
Which is
[−4
6 ]
Since the final solution of (AB)C ¿ [−4
6 ] = A(BC) then we have successfully proven
that A ( BC )= ( AB ) C
c. To initiate the solution lets first replace the items bought by a set of letters
Sheets of crats papers be S
Boxes of markers be B
Glue sticks be G
i. For Johny
3 S +4 B+5 G=24.40
For Sara
6 S+5 B+2G=30.40
And for Chong
3 S +2 B+G=13.40
The system of linear equations that can represent the case will be
3 S +4 B+5 G=24.40
6 S+5 B+2G=30.40
3 S +2 B+G=13.40
ii. Using Cramer’s rule to solve the system of linear equations
The Matrix computed is
S B G B
1 3 4 ¿ 24.40¿ 2 ¿ 6 ¿ 5 ¿ 2¿ 30.40 ¿ 3 ¿ 3 ¿ 2¿ 1 ¿ 13.40¿
From here we write down the main matrix.
This is S B G
1 3 ¿ 5 ¿ 2 ¿ 6 ¿ 5 ¿2 ¿ 3 ¿ 3 ¿ 2¿ 1 ¿
We then find the determinant of this matrix.
Which will be D=−11.999999999996
Then the 1st column of the main matrix is replaced by the solution vector and
the determinant of the resultant matrix obtained
S B G
1 24.4 ¿ 5 ¿ 2 ¿30.4 ¿5 ¿ 2 ¿ 3 ¿ 13.4 ¿ 2¿ 1 ¿
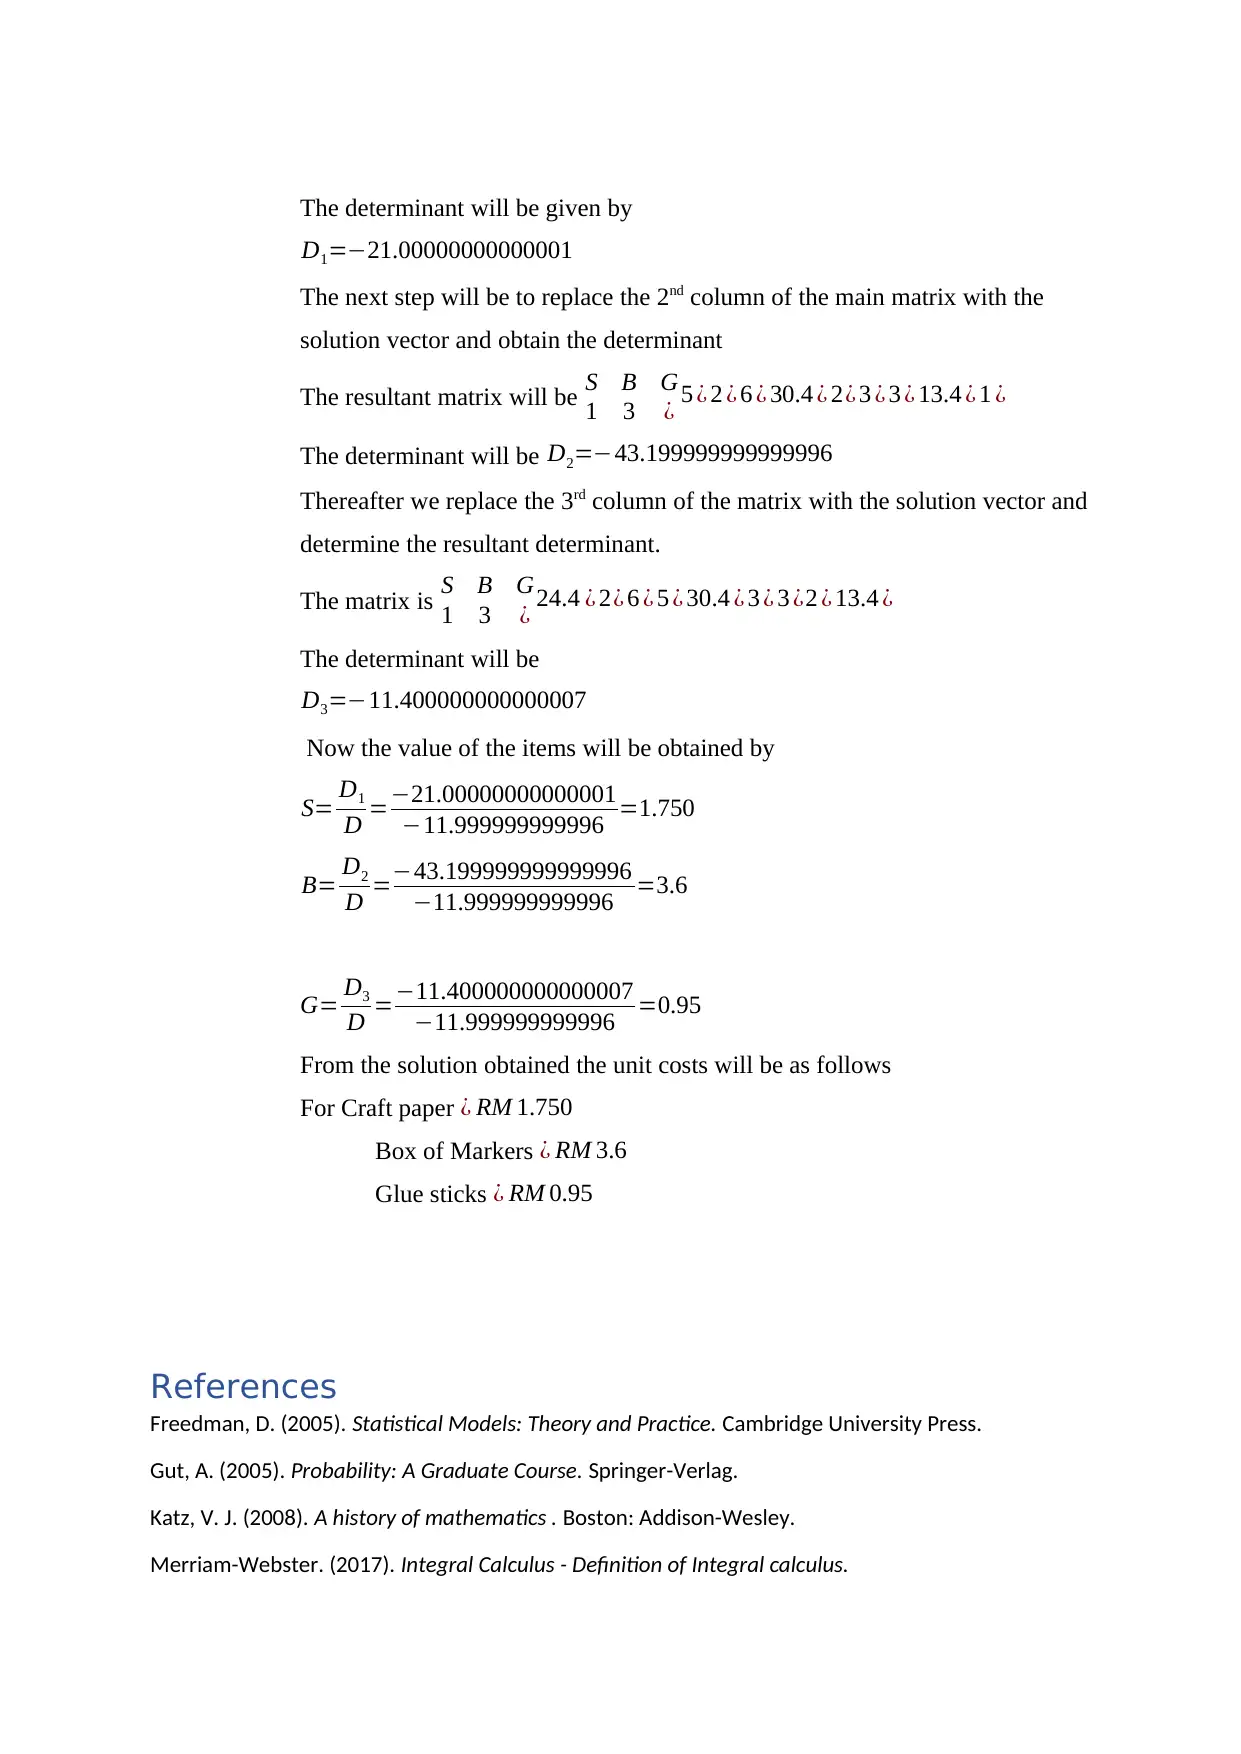
The determinant will be given by
D1=−21.00000000000001
The next step will be to replace the 2nd column of the main matrix with the
solution vector and obtain the determinant
The resultant matrix will be S B G
1 3 ¿ 5 ¿ 2 ¿ 6 ¿ 30.4 ¿ 2¿ 3 ¿ 3 ¿ 13.4 ¿ 1 ¿
The determinant will be D2=−43.199999999999996
Thereafter we replace the 3rd column of the matrix with the solution vector and
determine the resultant determinant.
The matrix is S B G
1 3 ¿ 24.4 ¿ 2¿ 6 ¿ 5 ¿ 30.4 ¿ 3 ¿ 3 ¿2 ¿ 13.4 ¿
The determinant will be
D3=−11.400000000000007
Now the value of the items will be obtained by
S= D1
D =−21.00000000000001
−11.999999999996 =1.750
B= D2
D =−43.199999999999996
−11.999999999996 =3.6
G= D3
D =−11.400000000000007
−11.999999999996 =0.95
From the solution obtained the unit costs will be as follows
For Craft paper ¿ RM 1.750
Box of Markers ¿ RM 3.6
Glue sticks ¿ RM 0.95
References
Freedman, D. (2005). Statistical Models: Theory and Practice. Cambridge University Press.
Gut, A. (2005). Probability: A Graduate Course. Springer-Verlag.
Katz, V. J. (2008). A history of mathematics . Boston: Addison-Wesley.
Merriam-Webster. (2017). Integral Calculus - Definition of Integral calculus.
⊘ This is a preview!⊘
Do you want full access?
Subscribe today to unlock all pages.
Trusted by 1+ million students worldwide
1 out of 12
Your All-in-One AI-Powered Toolkit for Academic Success.
+13062052269
info@desklib.com
Available 24*7 on WhatsApp / Email
![[object Object]](/_next/static/media/star-bottom.7253800d.svg)
Unlock your academic potential
Copyright © 2020–2026 A2Z Services. All Rights Reserved. Developed and managed by ZUCOL.