M&A Report: Disney's Acquisition of 21st Century Fox
VerifiedAdded on 2023/01/19
|19
|4253
|85
Report
AI Summary
This report provides a comprehensive analysis of the merger and acquisition between The Walt Disney Company and 21st Century Fox. It begins with an industry overview, highlighting the horizontal nature of the deal within the mass media sector and the market positions of both companies. The report examines the historical financial performance of both companies, including profitability, efficiency, liquidity, and capital structure ratios, and analyzes their stock prices and market capitalization. It explores the motivations behind the merger, focusing on Disney's strategic goals and the timeline of the deal. Furthermore, the report delves into the valuation of the merger, presenting free cash flow calculations to determine the equity value of 21st Century Fox. The analysis includes a discussion of defenses and strategies employed, along with the advantages and disadvantages of the merger. Finally, the report touches on the post-acquisition performance and concludes with a list of relevant references.
Running Head: Merger and Acquisition
1
Project Report: Merger and Acquisition
1
Project Report: Merger and Acquisition
Paraphrase This Document
Need a fresh take? Get an instant paraphrase of this document with our AI Paraphraser
Merger and Acquisition
2
Contents
Industry overview.............................................................................................................3
Participants in merger.......................................................................................................4
Historical financial performance of target and bidder firm..............................................4
Motivation for merger.......................................................................................................8
Timeline of the deal..........................................................................................................8
Valuation of merger..........................................................................................................9
Defenses and strategies employed..................................................................................16
Advantages and disadvantages of merger.......................................................................16
Post acquisition performance..........................................................................................17
References.......................................................................................................................18
Merger and Acquisition
3
Industry overview:
21st century fox has been acquired by The Walt Disney Company on 20th March 2019.
21st century fox was an American international company which operates its business under
the mass media industry whereas on other hand, The Walt Disney Company is also an
American organization which is performing its operation under the mass media industry.
Hence, it has been found that the deal was horizontal merger. Horizontal merger explains that
a company acquires the corporation which produces or offers the same products and the
services in the market1.
In case of mass media industry, it has been found that The Walt Disney Company is
the leader in the American market with highest market capital and market share. The
company has expanded its market at global level and grabbed the international market as
well. The market share of target and bidding company is 2.97% and 14.36% respectively in
the market which explains a large growth for Target Company in case of merging with the
bidder company2. There were no specific government rules and regulations in this merger
deal. The main motto behind the merger was expanding the business and grabs more
international market. The case was not motivated by any regulation change or any
government rule.
In case of previous data of Mass media industry, it has been found that there are
various companies performing under the industry and their growth rate is quite higher. There
was tough competition in the market for the Walt Disney Company as the competitor of the
company was implementing new strategies to improve their market share and expand the
business. Hence, company has decided to merge with the 21st century fox Inc to grab the
market. There are various competitors in the market and the entire competing tough with the
Walt Disney Company3. They could affect the market at any time because of higher market
shares.
1 Mandell, Lewis, and Linda Schmid Klein. "The impact of financial literacy education
on subsequent financial behavior." Journal of Financial Counseling and Planning 20,
no. 1 (2009).
2 “Business Insider”, 21st century fox inc, Accessed April 26, 2019,
https://markets.businessinsider.com/stocks/foxa-stock
⊘ This is a preview!⊘
Do you want full access?
Subscribe today to unlock all pages.
Trusted by 1+ million students worldwide
Merger and Acquisition
4
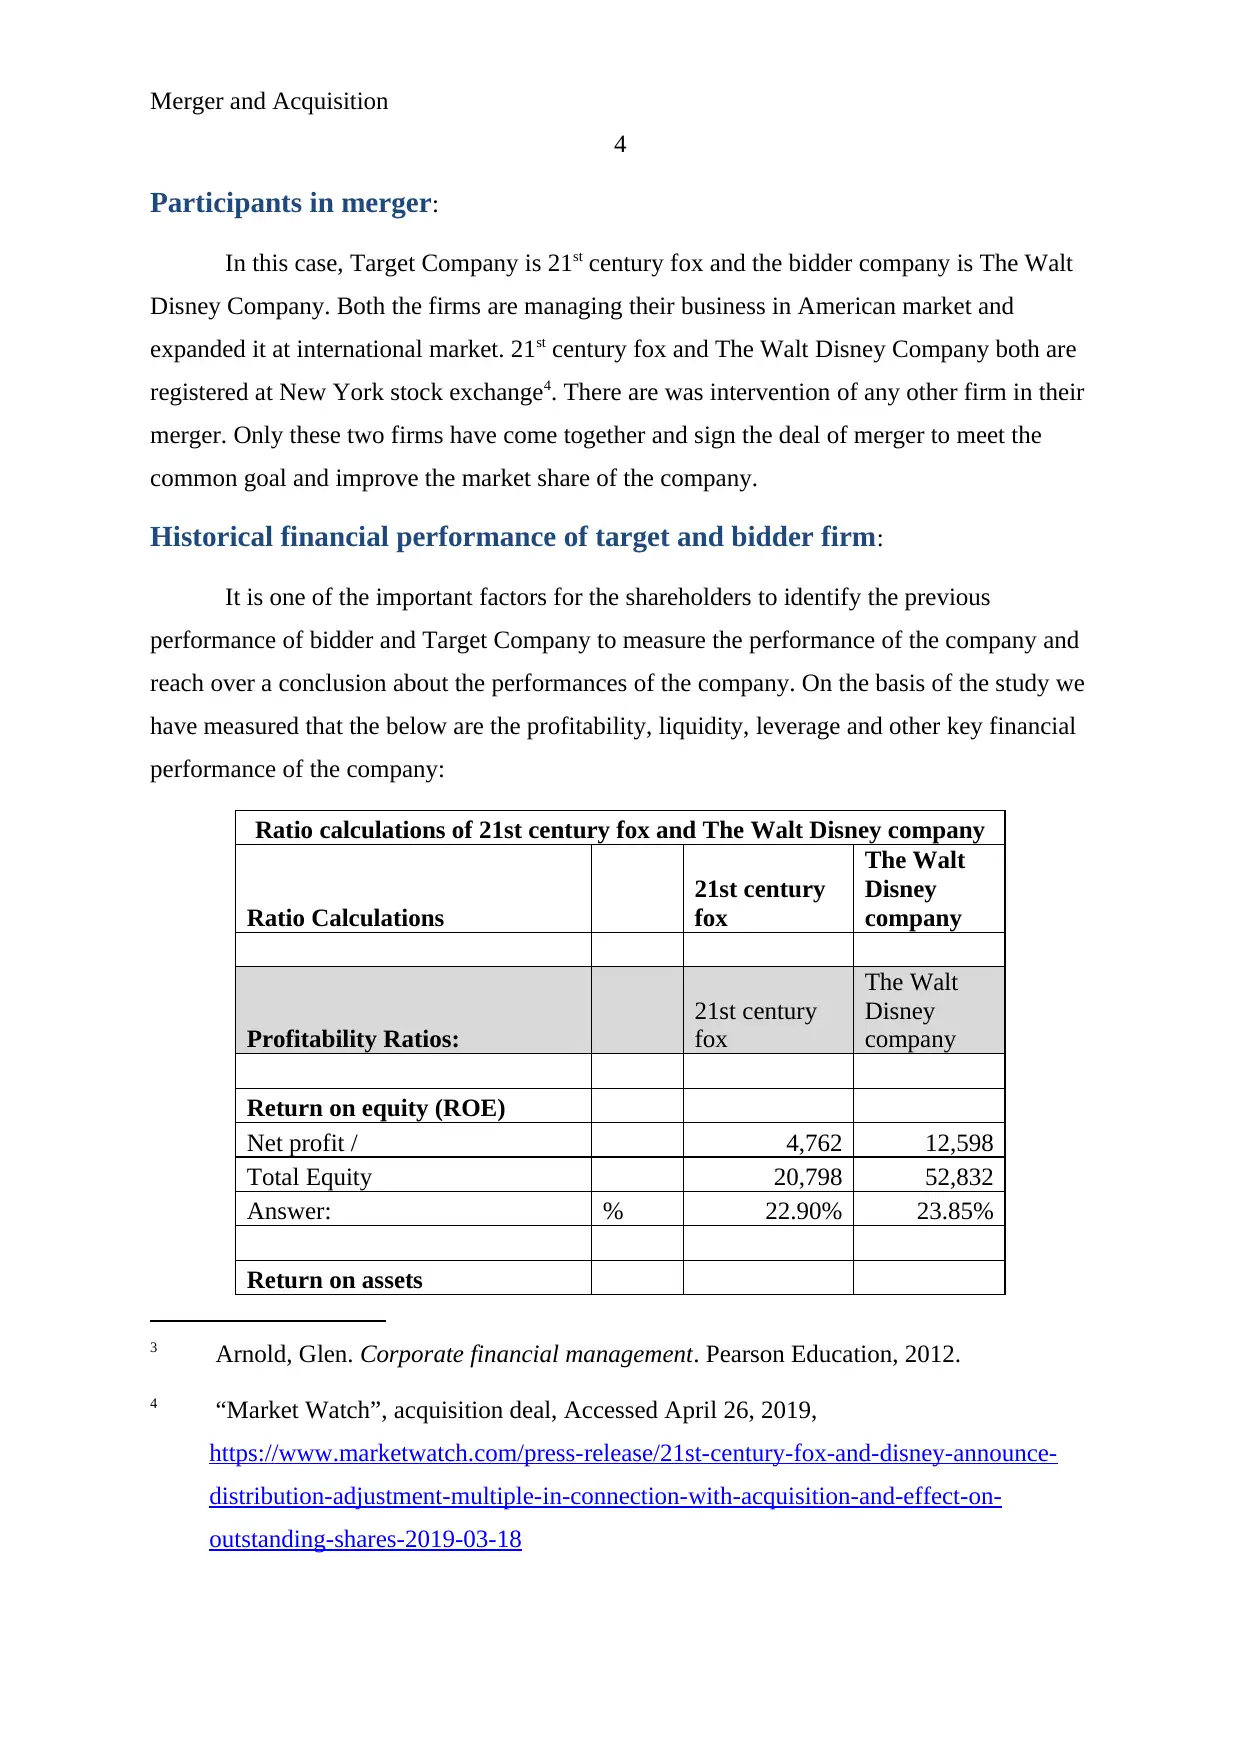
Participants in merger:
In this case, Target Company is 21st century fox and the bidder company is The Walt
Disney Company. Both the firms are managing their business in American market and
expanded it at international market. 21st century fox and The Walt Disney Company both are
registered at New York stock exchange4. There are was intervention of any other firm in their
merger. Only these two firms have come together and sign the deal of merger to meet the
common goal and improve the market share of the company.
Historical financial performance of target and bidder firm:
It is one of the important factors for the shareholders to identify the previous
performance of bidder and Target Company to measure the performance of the company and
reach over a conclusion about the performances of the company. On the basis of the study we
have measured that the below are the profitability, liquidity, leverage and other key financial
performance of the company:
Ratio calculations of 21st century fox and The Walt Disney company
Ratio Calculations
21st century
fox
The Walt
Disney
company
Profitability Ratios:
21st century
fox
The Walt
Disney
company
Return on equity (ROE)
Net profit / 4,762 12,598
Total Equity 20,798 52,832
Answer: % 22.90% 23.85%
Return on assets
3 Arnold, Glen. Corporate financial management. Pearson Education, 2012.
4 “Market Watch”, acquisition deal, Accessed April 26, 2019,
https://www.marketwatch.com/press-release/21st-century-fox-and-disney-announce-
distribution-adjustment-multiple-in-connection-with-acquisition-and-effect-on-
outstanding-shares-2019-03-18
4
Participants in merger:
In this case, Target Company is 21st century fox and the bidder company is The Walt
Disney Company. Both the firms are managing their business in American market and
expanded it at international market. 21st century fox and The Walt Disney Company both are
registered at New York stock exchange4. There are was intervention of any other firm in their
merger. Only these two firms have come together and sign the deal of merger to meet the
common goal and improve the market share of the company.
Historical financial performance of target and bidder firm:
It is one of the important factors for the shareholders to identify the previous
performance of bidder and Target Company to measure the performance of the company and
reach over a conclusion about the performances of the company. On the basis of the study we
have measured that the below are the profitability, liquidity, leverage and other key financial
performance of the company:
Ratio calculations of 21st century fox and The Walt Disney company
Ratio Calculations
21st century
fox
The Walt
Disney
company
Profitability Ratios:
21st century
fox
The Walt
Disney
company
Return on equity (ROE)
Net profit / 4,762 12,598
Total Equity 20,798 52,832
Answer: % 22.90% 23.85%
Return on assets
3 Arnold, Glen. Corporate financial management. Pearson Education, 2012.
4 “Market Watch”, acquisition deal, Accessed April 26, 2019,
https://www.marketwatch.com/press-release/21st-century-fox-and-disney-announce-
distribution-adjustment-multiple-in-connection-with-acquisition-and-effect-on-
outstanding-shares-2019-03-18
Paraphrase This Document
Need a fresh take? Get an instant paraphrase of this document with our AI Paraphraser
Merger and Acquisition
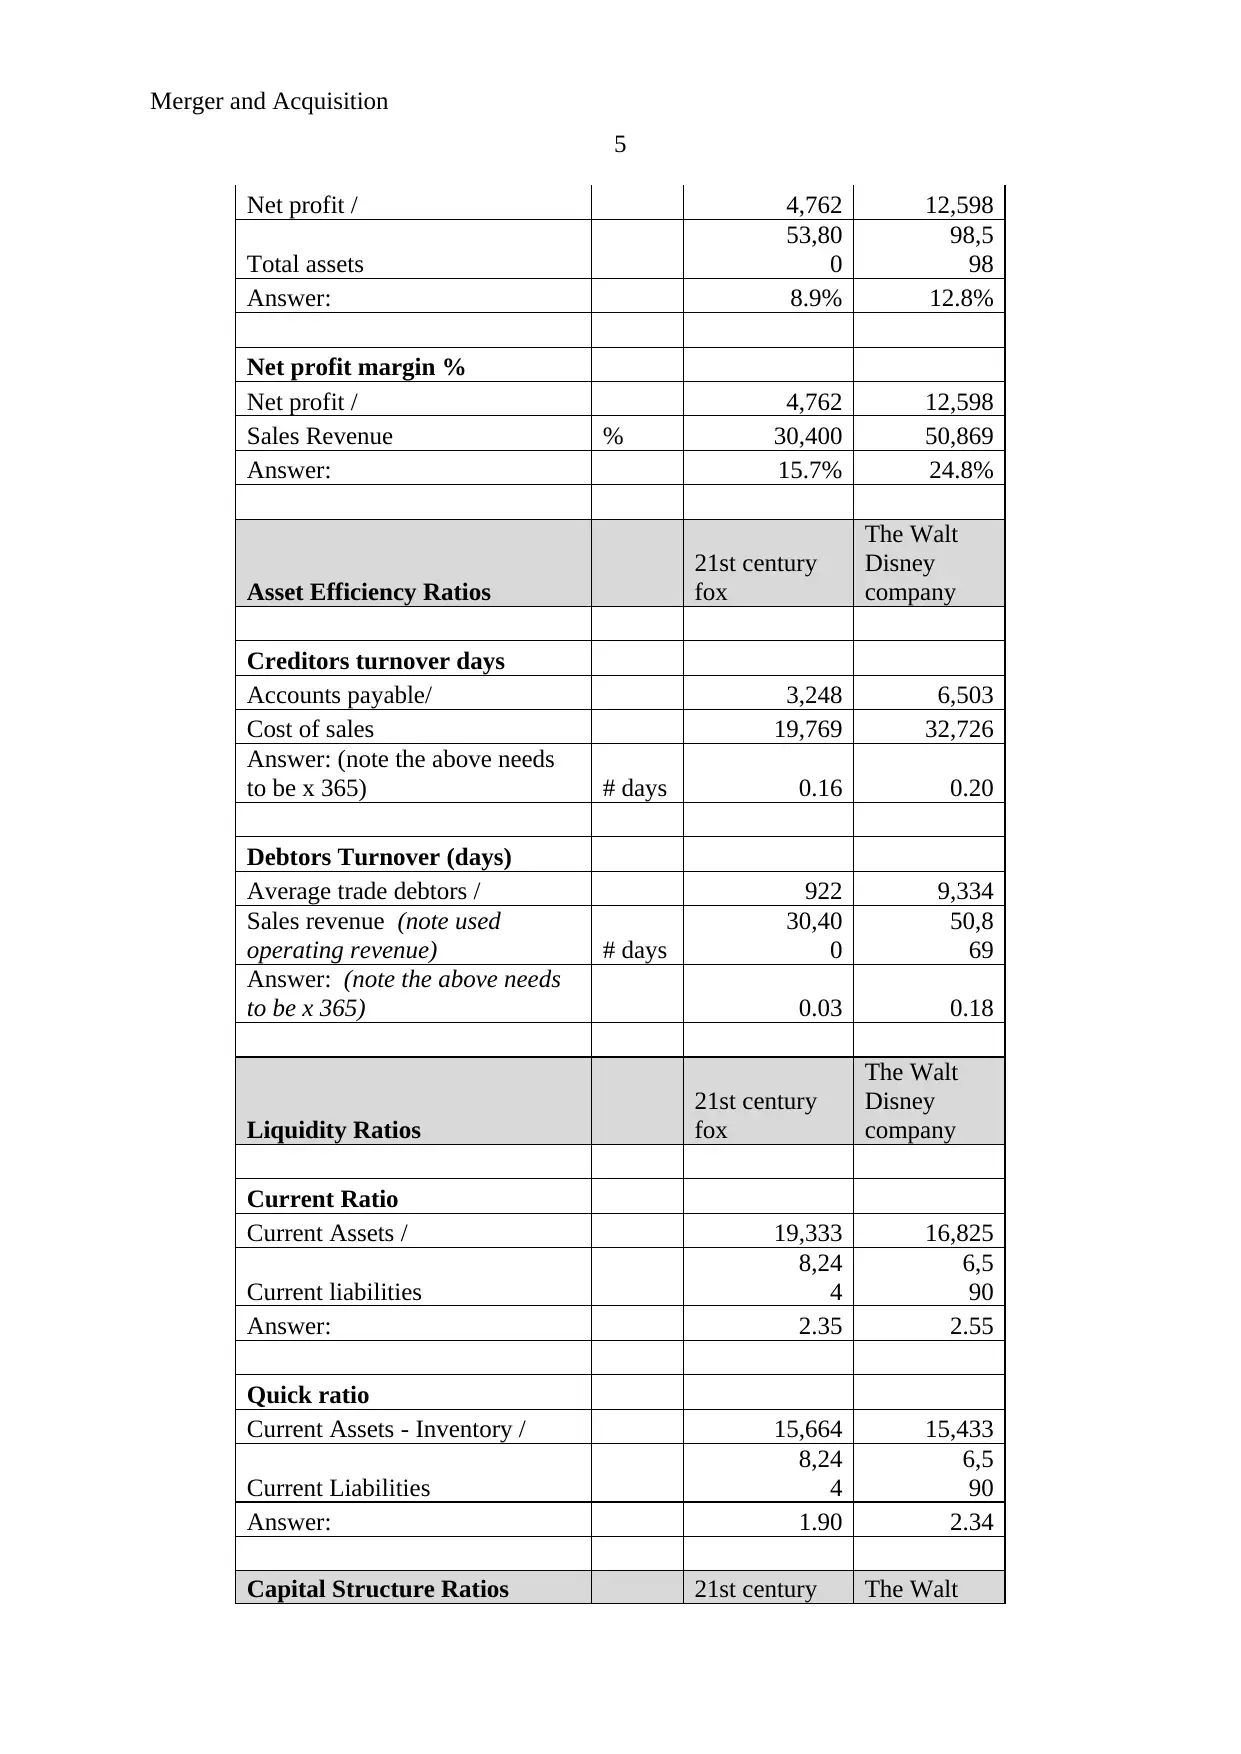
5
Net profit / 4,762 12,598
Total assets
53,80
0
98,5
98
Answer: 8.9% 12.8%
Net profit margin %
Net profit / 4,762 12,598
Sales Revenue % 30,400 50,869
Answer: 15.7% 24.8%
Asset Efficiency Ratios
21st century
fox
The Walt
Disney
company
Creditors turnover days
Accounts payable/ 3,248 6,503
Cost of sales 19,769 32,726
Answer: (note the above needs
to be x 365) # days 0.16 0.20
Debtors Turnover (days)
Average trade debtors / 922 9,334
Sales revenue (note used
operating revenue) # days
30,40
0
50,8
69
Answer: (note the above needs
to be x 365) 0.03 0.18
Liquidity Ratios
21st century
fox
The Walt
Disney
company
Current Ratio
Current Assets / 19,333 16,825
Current liabilities
8,24
4
6,5
90
Answer: 2.35 2.55
Quick ratio
Current Assets - Inventory / 15,664 15,433
Current Liabilities
8,24
4
6,5
90
Answer: 1.90 2.34
Capital Structure Ratios 21st century The Walt
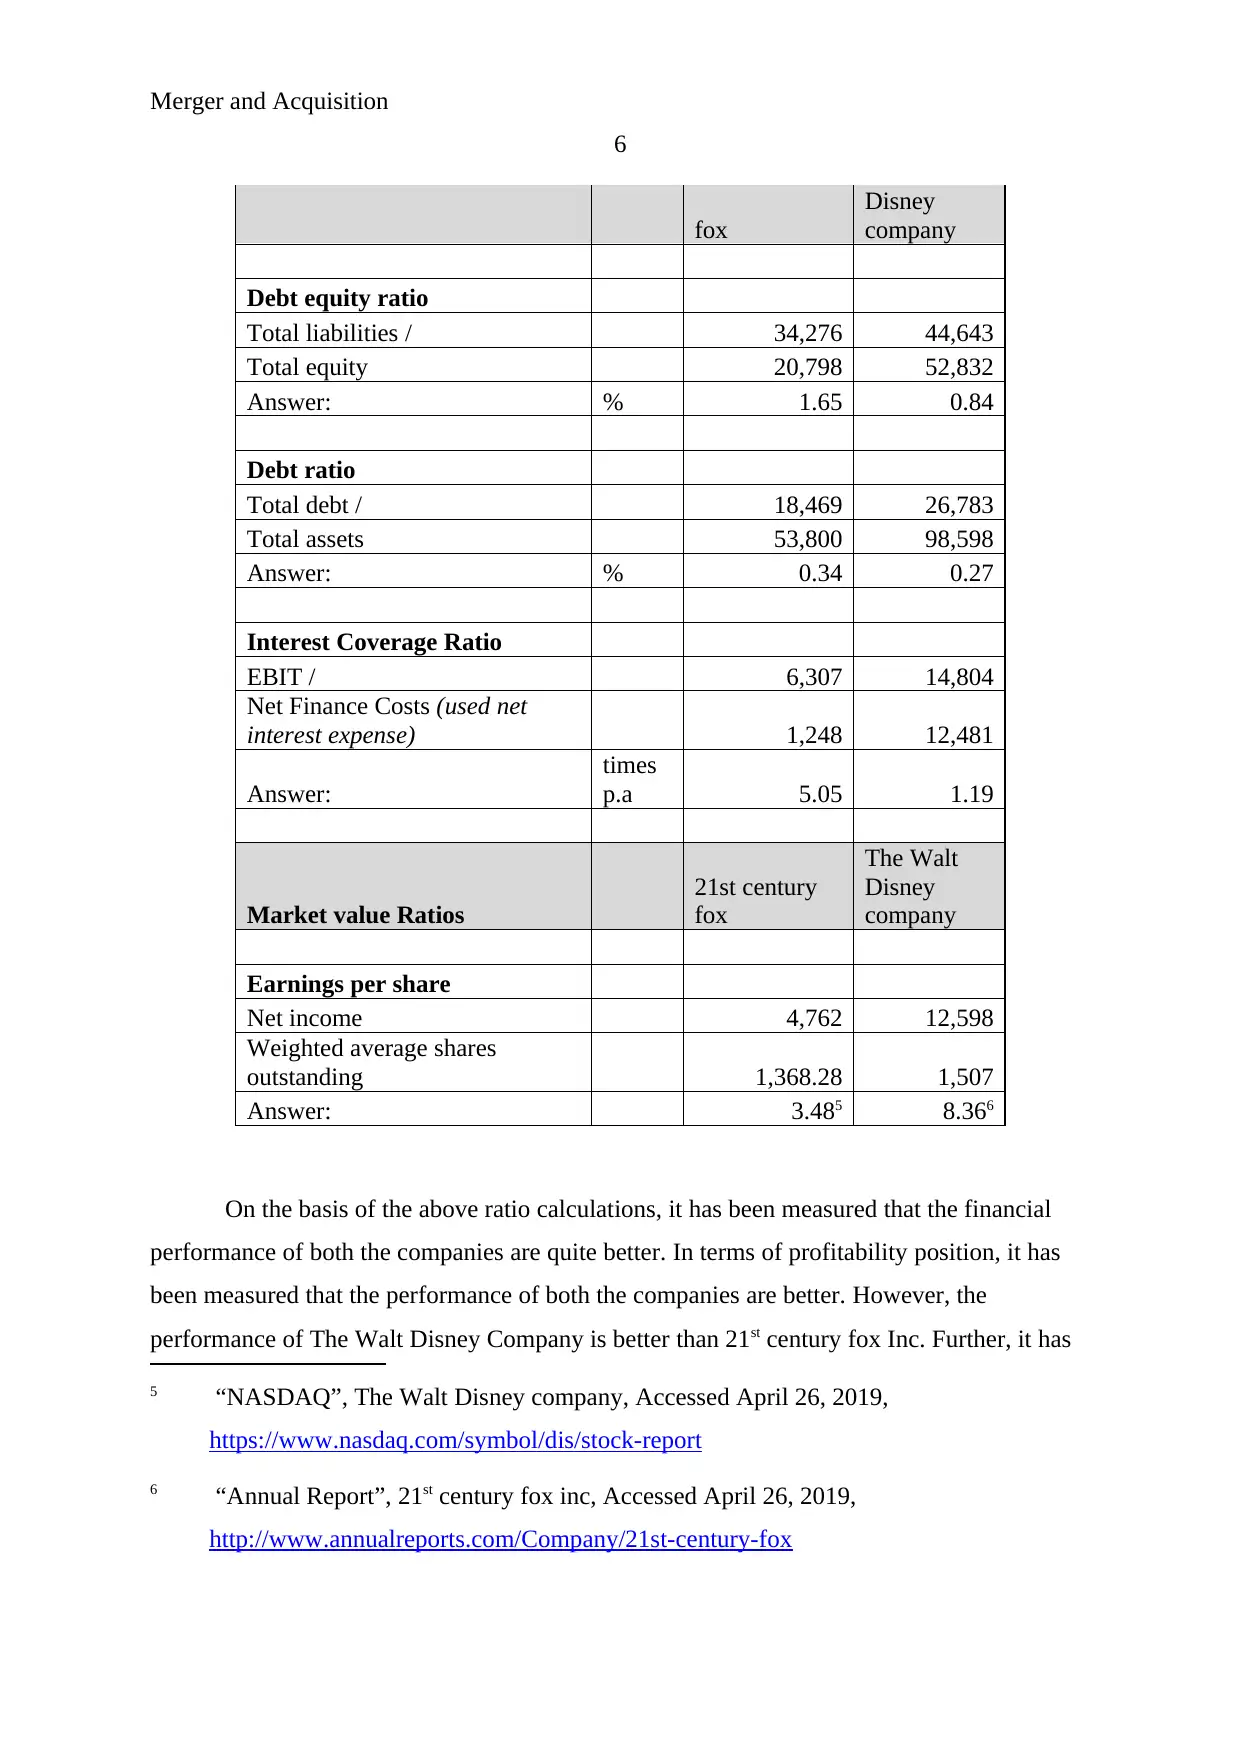
Merger and Acquisition
6
fox
Disney
company
Debt equity ratio
Total liabilities / 34,276 44,643
Total equity 20,798 52,832
Answer: % 1.65 0.84
Debt ratio
Total debt / 18,469 26,783
Total assets 53,800 98,598
Answer: % 0.34 0.27
Interest Coverage Ratio
EBIT / 6,307 14,804
Net Finance Costs (used net
interest expense) 1,248 12,481
Answer:
times
p.a 5.05 1.19
Market value Ratios
21st century
fox
The Walt
Disney
company
Earnings per share
Net income 4,762 12,598
Weighted average shares
outstanding 1,368.28 1,507
Answer: 3.485 8.366
On the basis of the above ratio calculations, it has been measured that the financial
performance of both the companies are quite better. In terms of profitability position, it has
been measured that the performance of both the companies are better. However, the
performance of The Walt Disney Company is better than 21st century fox Inc. Further, it has
5 “NASDAQ”, The Walt Disney company, Accessed April 26, 2019,
https://www.nasdaq.com/symbol/dis/stock-report
6 “Annual Report”, 21st century fox inc, Accessed April 26, 2019,
http://www.annualreports.com/Company/21st-century-fox
⊘ This is a preview!⊘
Do you want full access?
Subscribe today to unlock all pages.
Trusted by 1+ million students worldwide
Merger and Acquisition
7
been measured that the efficiency position of 21st century fox Inc is not at all good; company
is required to improve it. Liquidity ratio brief average performance of both the companies,
further, the capital structure level of 21st century fox inc is not at all good and lastly, it has
been measured that the earnings per share of 21st century fox inc is quite lower than the Walt
Disney company7.
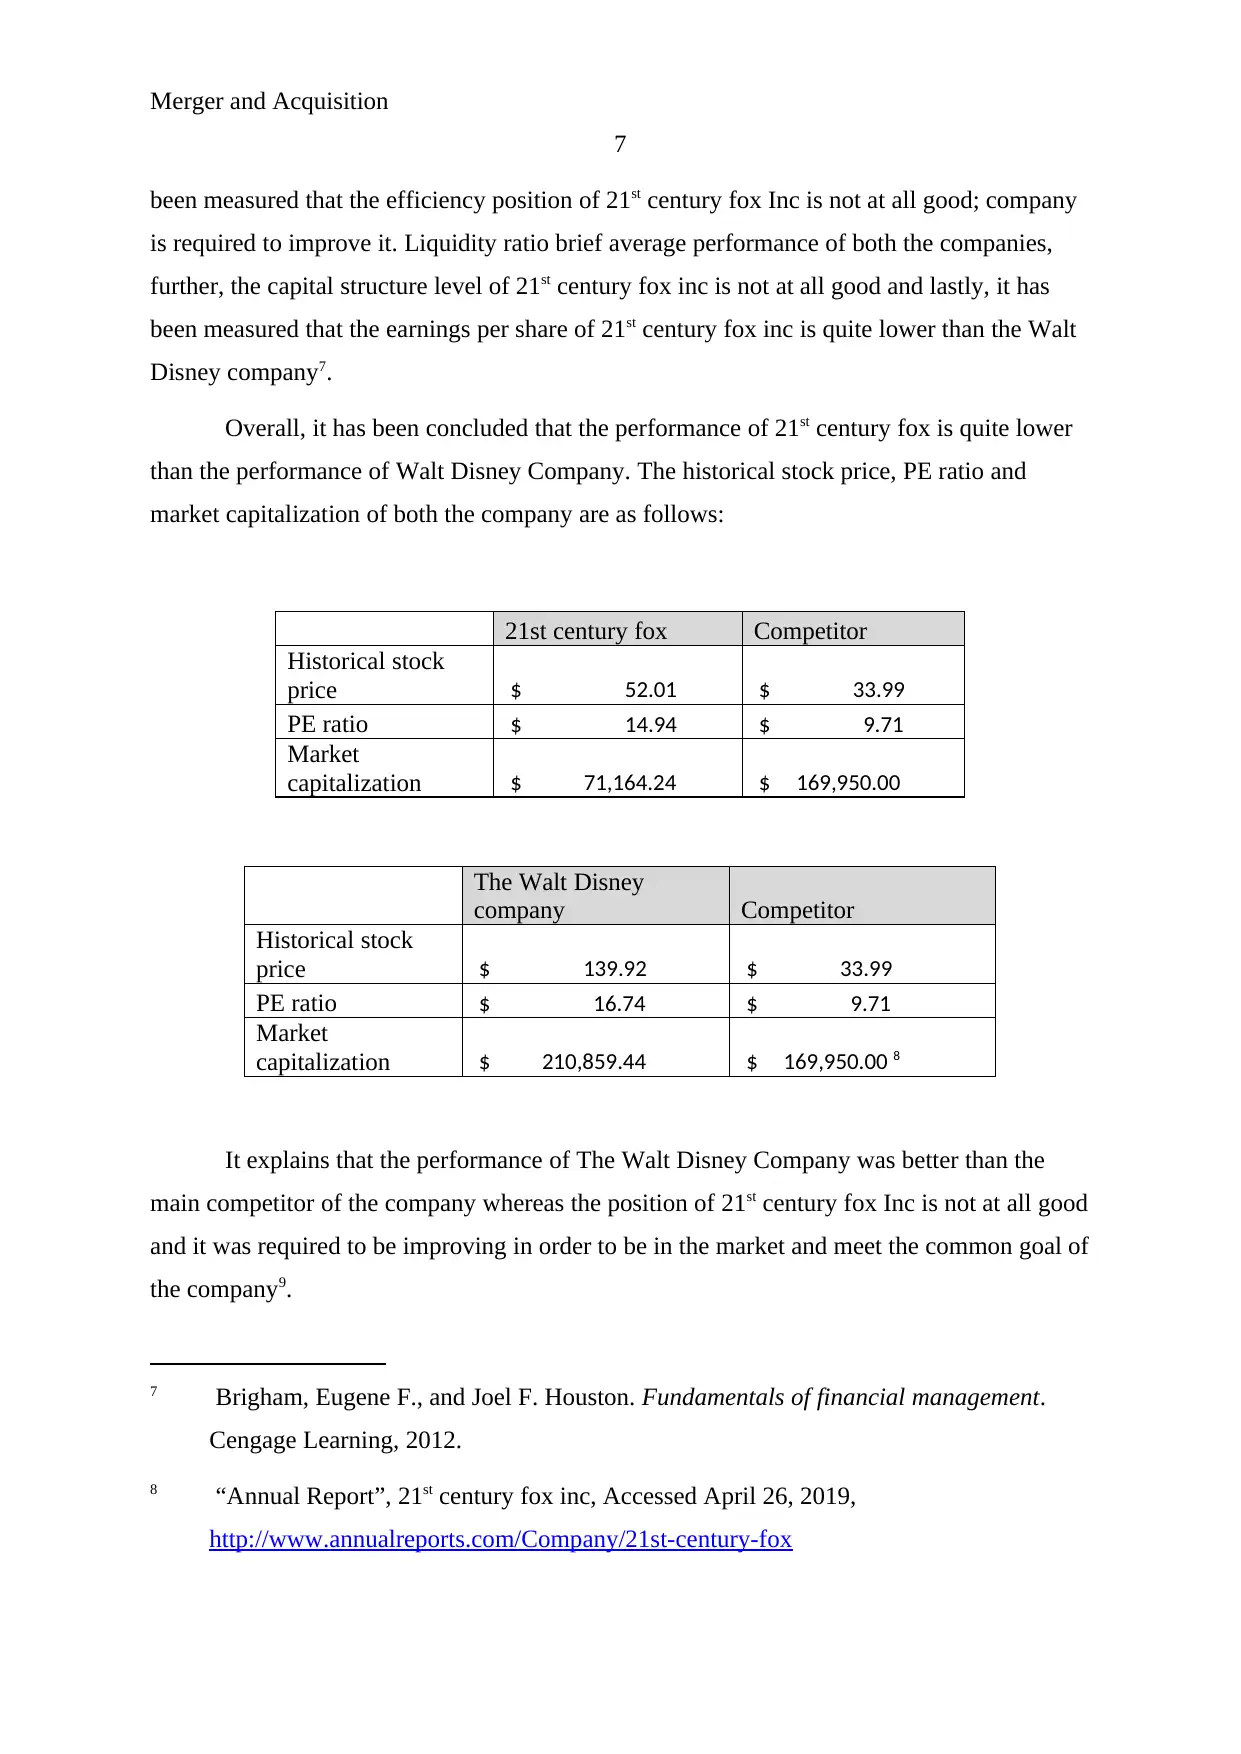
Overall, it has been concluded that the performance of 21st century fox is quite lower
than the performance of Walt Disney Company. The historical stock price, PE ratio and
market capitalization of both the company are as follows:
21st century fox Competitor
Historical stock
price $ 52.01 $ 33.99
PE ratio $ 14.94 $ 9.71
Market
capitalization $ 71,164.24 $ 169,950.00
The Walt Disney
company Competitor
Historical stock
price $ 139.92 $ 33.99
PE ratio $ 16.74 $ 9.71
Market
capitalization $ 210,859.44 $ 169,950.00 8
It explains that the performance of The Walt Disney Company was better than the
main competitor of the company whereas the position of 21st century fox Inc is not at all good
and it was required to be improving in order to be in the market and meet the common goal of
the company9.
7 Brigham, Eugene F., and Joel F. Houston. Fundamentals of financial management.
Cengage Learning, 2012.
8 “Annual Report”, 21st century fox inc, Accessed April 26, 2019,
http://www.annualreports.com/Company/21st-century-fox
7
been measured that the efficiency position of 21st century fox Inc is not at all good; company
is required to improve it. Liquidity ratio brief average performance of both the companies,
further, the capital structure level of 21st century fox inc is not at all good and lastly, it has
been measured that the earnings per share of 21st century fox inc is quite lower than the Walt
Disney company7.
Overall, it has been concluded that the performance of 21st century fox is quite lower
than the performance of Walt Disney Company. The historical stock price, PE ratio and
market capitalization of both the company are as follows:
21st century fox Competitor
Historical stock
price $ 52.01 $ 33.99
PE ratio $ 14.94 $ 9.71
Market
capitalization $ 71,164.24 $ 169,950.00
The Walt Disney
company Competitor
Historical stock
price $ 139.92 $ 33.99
PE ratio $ 16.74 $ 9.71
Market
capitalization $ 210,859.44 $ 169,950.00 8
It explains that the performance of The Walt Disney Company was better than the
main competitor of the company whereas the position of 21st century fox Inc is not at all good
and it was required to be improving in order to be in the market and meet the common goal of
the company9.
7 Brigham, Eugene F., and Joel F. Houston. Fundamentals of financial management.
Cengage Learning, 2012.
8 “Annual Report”, 21st century fox inc, Accessed April 26, 2019,
http://www.annualreports.com/Company/21st-century-fox
Paraphrase This Document
Need a fresh take? Get an instant paraphrase of this document with our AI Paraphraser
Merger and Acquisition
8
On the basis of ratio analysis, historical price, PE ratio and other financial factors, it
has been recognized that the performance of 21st century fox Inc was below average and it
was required by the company to make some strong strategies and take better action to
improve the performance of the company10. It was the main reason behind the merger of the
company with The Walt Disney Company.
Motivation for merger:
Bidder Company, The Walt Disney Company, was looking for some strong policies
and strategies to improve the performance of the company and grab more market share. The
merger between The Walt Disney Company and 21st century Fox Company is the biggest
media merger. On the basis of the study, it has been found that the main motivation for The
Walt Disney Company behind this merger is market shares of Fox Inc and reduces the
competitive level from the market. It has been found that the Fox inc was growing up rapidly
which has been evaluated by The Walt Disney Company and found that if the investment
would be done in the 21st century fox then the market share would boom up along with the
various new locations for the company11.
Timeline of the deal:
On 6th Nov 2017, The Walt Disney Company started negotiating the deal with 21st
century fox. On Nov 16, various other firms have also joined The Walt Disney Company to
bid the 21st century fox. Initially, the company offered $ 65 billion all cash proposal to
acquire the 21st century fox but because of involvement of other firms, The Walt Disney
Company offered a deal of $ 71.3 billion to 21st century fox which has been accepted by the
company on 20th March 2019. It was the biggest media acquirement deal in the world. 10%
9 Brigham, Eugene F., and Phillip R. Daves. Intermediate financial management. Nelson
Education, 2012.
10 Chandra, Prasanna. Financial management. Tata McGraw-Hill Education, 2011.
11 “Market Watch”, acquisition deal, Accessed April 26, 2019,
https://www.marketwatch.com/press-release/21st-century-fox-and-disney-announce-
distribution-adjustment-multiple-in-connection-with-acquisition-and-effect-on-
outstanding-shares-2019-03-18
Merger and Acquisition
9
premium has been offered by the company from the previous bid amount because of higher
demand of company in the market12.
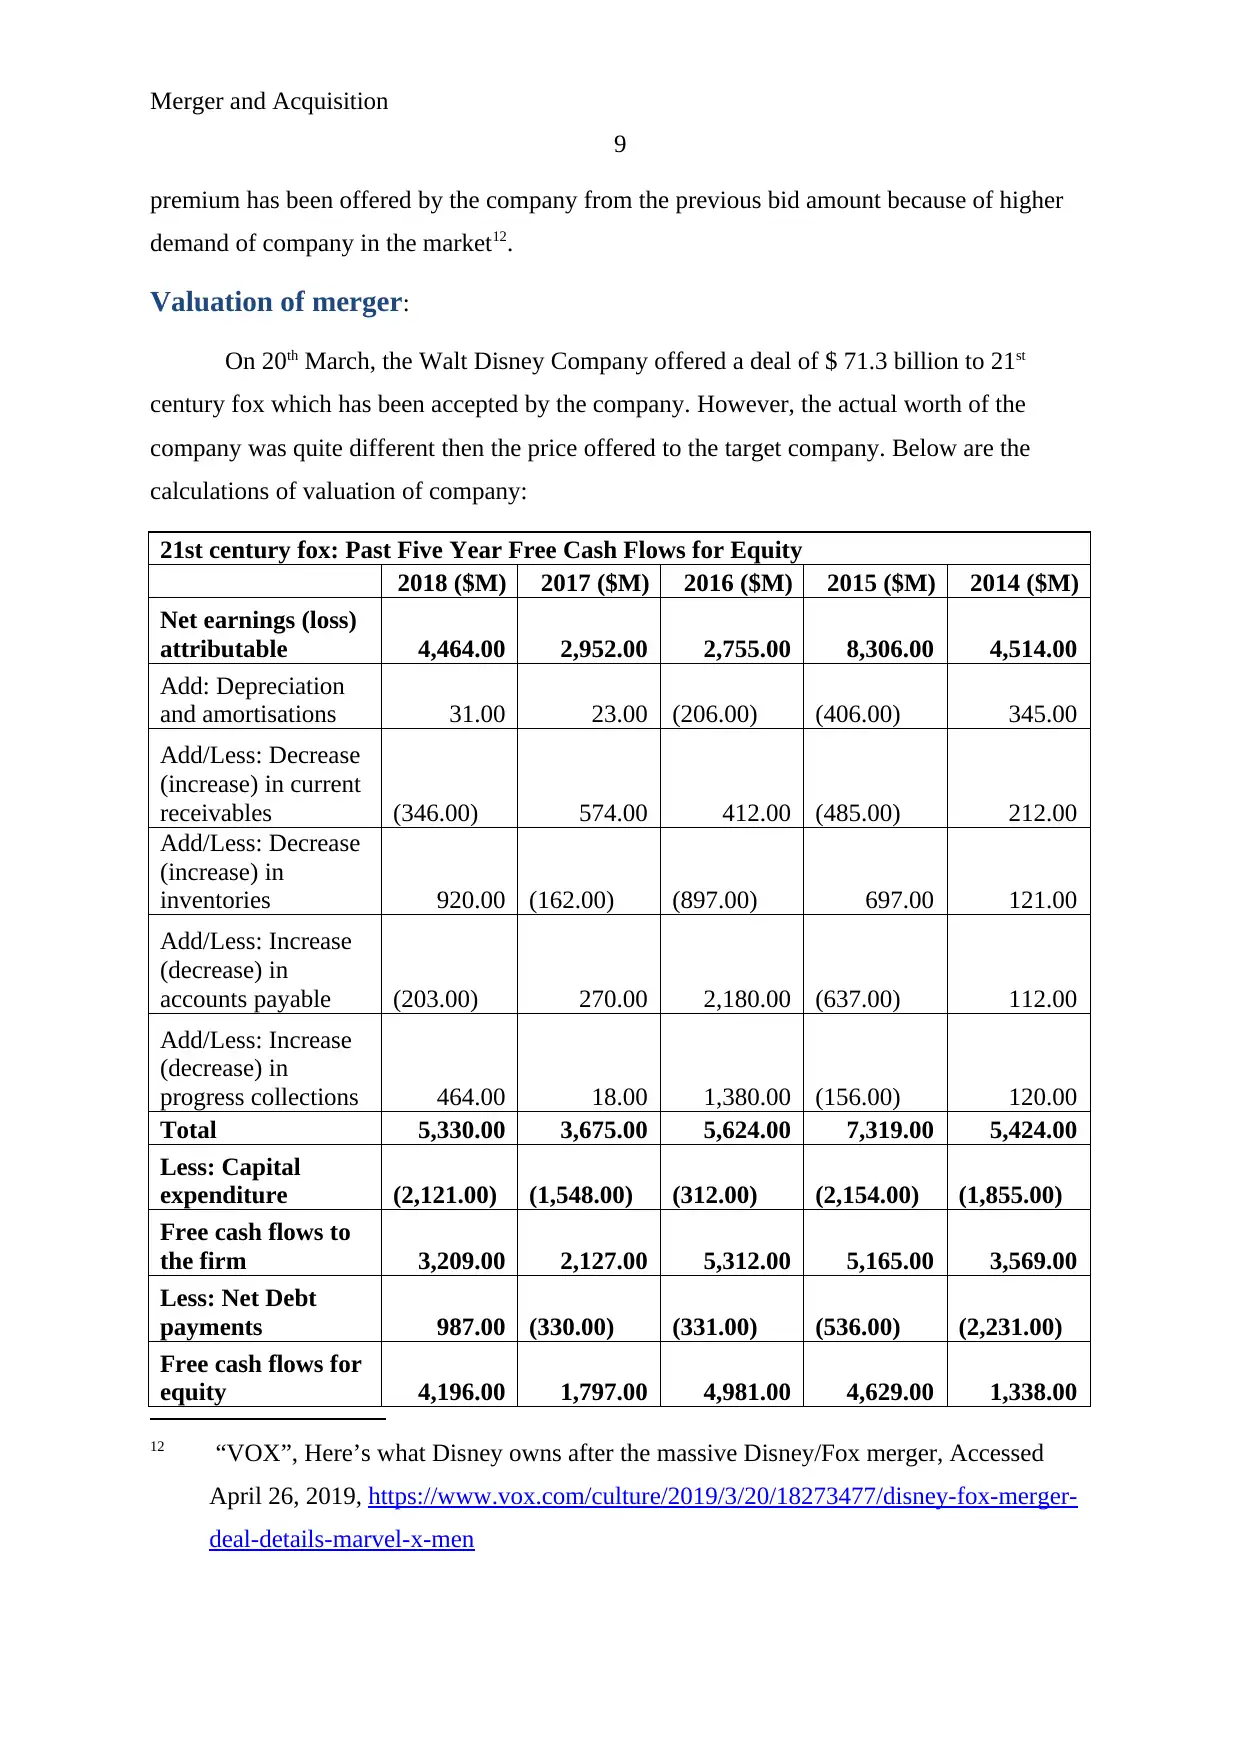
Valuation of merger:
On 20th March, the Walt Disney Company offered a deal of $ 71.3 billion to 21st
century fox which has been accepted by the company. However, the actual worth of the
company was quite different then the price offered to the target company. Below are the
calculations of valuation of company:
21st century fox: Past Five Year Free Cash Flows for Equity
2018 ($M) 2017 ($M) 2016 ($M) 2015 ($M) 2014 ($M)
Net earnings (loss)
attributable 4,464.00 2,952.00 2,755.00 8,306.00 4,514.00
Add: Depreciation
and amortisations 31.00 23.00 (206.00) (406.00) 345.00
Add/Less: Decrease
(increase) in current
receivables (346.00) 574.00 412.00 (485.00) 212.00
Add/Less: Decrease
(increase) in
inventories 920.00 (162.00) (897.00) 697.00 121.00
Add/Less: Increase
(decrease) in
accounts payable (203.00) 270.00 2,180.00 (637.00) 112.00
Add/Less: Increase
(decrease) in
progress collections 464.00 18.00 1,380.00 (156.00) 120.00
Total 5,330.00 3,675.00 5,624.00 7,319.00 5,424.00
Less: Capital
expenditure (2,121.00) (1,548.00) (312.00) (2,154.00) (1,855.00)
Free cash flows to
the firm 3,209.00 2,127.00 5,312.00 5,165.00 3,569.00
Less: Net Debt
payments 987.00 (330.00) (331.00) (536.00) (2,231.00)
Free cash flows for
equity 4,196.00 1,797.00 4,981.00 4,629.00 1,338.00
12 “VOX”, Here’s what Disney owns after the massive Disney/Fox merger, Accessed
April 26, 2019, https://www.vox.com/culture/2019/3/20/18273477/disney-fox-merger-
deal-details-marvel-x-men
9
premium has been offered by the company from the previous bid amount because of higher
demand of company in the market12.
Valuation of merger:
On 20th March, the Walt Disney Company offered a deal of $ 71.3 billion to 21st
century fox which has been accepted by the company. However, the actual worth of the
company was quite different then the price offered to the target company. Below are the
calculations of valuation of company:
21st century fox: Past Five Year Free Cash Flows for Equity
2018 ($M) 2017 ($M) 2016 ($M) 2015 ($M) 2014 ($M)
Net earnings (loss)
attributable 4,464.00 2,952.00 2,755.00 8,306.00 4,514.00
Add: Depreciation
and amortisations 31.00 23.00 (206.00) (406.00) 345.00
Add/Less: Decrease
(increase) in current
receivables (346.00) 574.00 412.00 (485.00) 212.00
Add/Less: Decrease
(increase) in
inventories 920.00 (162.00) (897.00) 697.00 121.00
Add/Less: Increase
(decrease) in
accounts payable (203.00) 270.00 2,180.00 (637.00) 112.00
Add/Less: Increase
(decrease) in
progress collections 464.00 18.00 1,380.00 (156.00) 120.00
Total 5,330.00 3,675.00 5,624.00 7,319.00 5,424.00
Less: Capital
expenditure (2,121.00) (1,548.00) (312.00) (2,154.00) (1,855.00)
Free cash flows to
the firm 3,209.00 2,127.00 5,312.00 5,165.00 3,569.00
Less: Net Debt
payments 987.00 (330.00) (331.00) (536.00) (2,231.00)
Free cash flows for
equity 4,196.00 1,797.00 4,981.00 4,629.00 1,338.00
12 “VOX”, Here’s what Disney owns after the massive Disney/Fox merger, Accessed
April 26, 2019, https://www.vox.com/culture/2019/3/20/18273477/disney-fox-merger-
deal-details-marvel-x-men
⊘ This is a preview!⊘
Do you want full access?
Subscribe today to unlock all pages.
Trusted by 1+ million students worldwide
Merger and Acquisition
10
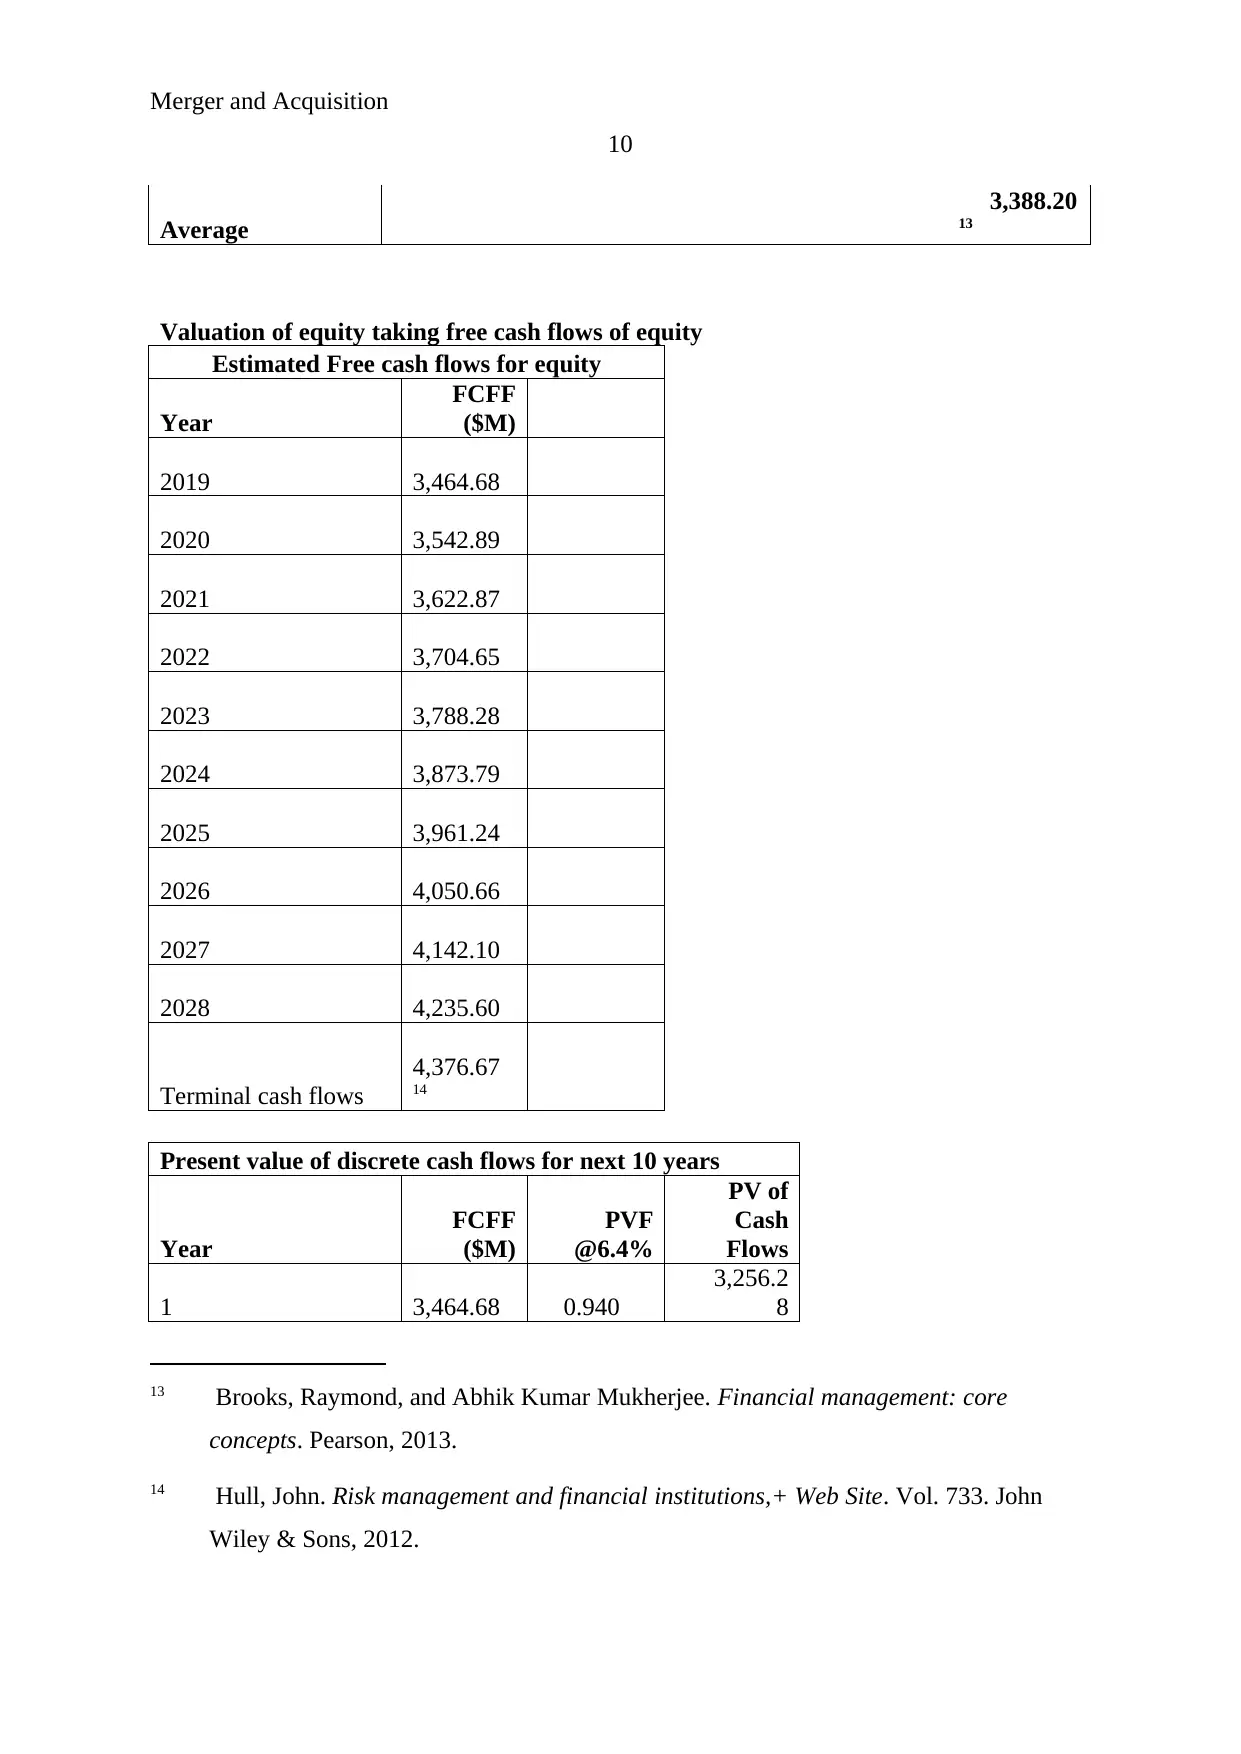
Average
3,388.20
13
Valuation of equity taking free cash flows of equity
Estimated Free cash flows for equity
Year
FCFF
($M)
2019 3,464.68
2020 3,542.89
2021 3,622.87
2022 3,704.65
2023 3,788.28
2024 3,873.79
2025 3,961.24
2026 4,050.66
2027 4,142.10
2028 4,235.60
Terminal cash flows
4,376.67
14
Present value of discrete cash flows for next 10 years
Year
FCFF
($M)
PVF
@6.4%
PV of
Cash
Flows
1 3,464.68 0.940
3,256.2
8
13 Brooks, Raymond, and Abhik Kumar Mukherjee. Financial management: core
concepts. Pearson, 2013.
14 Hull, John. Risk management and financial institutions,+ Web Site. Vol. 733. John
Wiley & Sons, 2012.
10
Average
3,388.20
13
Valuation of equity taking free cash flows of equity
Estimated Free cash flows for equity
Year
FCFF
($M)
2019 3,464.68
2020 3,542.89
2021 3,622.87
2022 3,704.65
2023 3,788.28
2024 3,873.79
2025 3,961.24
2026 4,050.66
2027 4,142.10
2028 4,235.60
Terminal cash flows
4,376.67
14
Present value of discrete cash flows for next 10 years
Year
FCFF
($M)
PVF
@6.4%
PV of
Cash
Flows
1 3,464.68 0.940
3,256.2
8
13 Brooks, Raymond, and Abhik Kumar Mukherjee. Financial management: core
concepts. Pearson, 2013.
14 Hull, John. Risk management and financial institutions,+ Web Site. Vol. 733. John
Wiley & Sons, 2012.
Paraphrase This Document
Need a fresh take? Get an instant paraphrase of this document with our AI Paraphraser
Merger and Acquisition
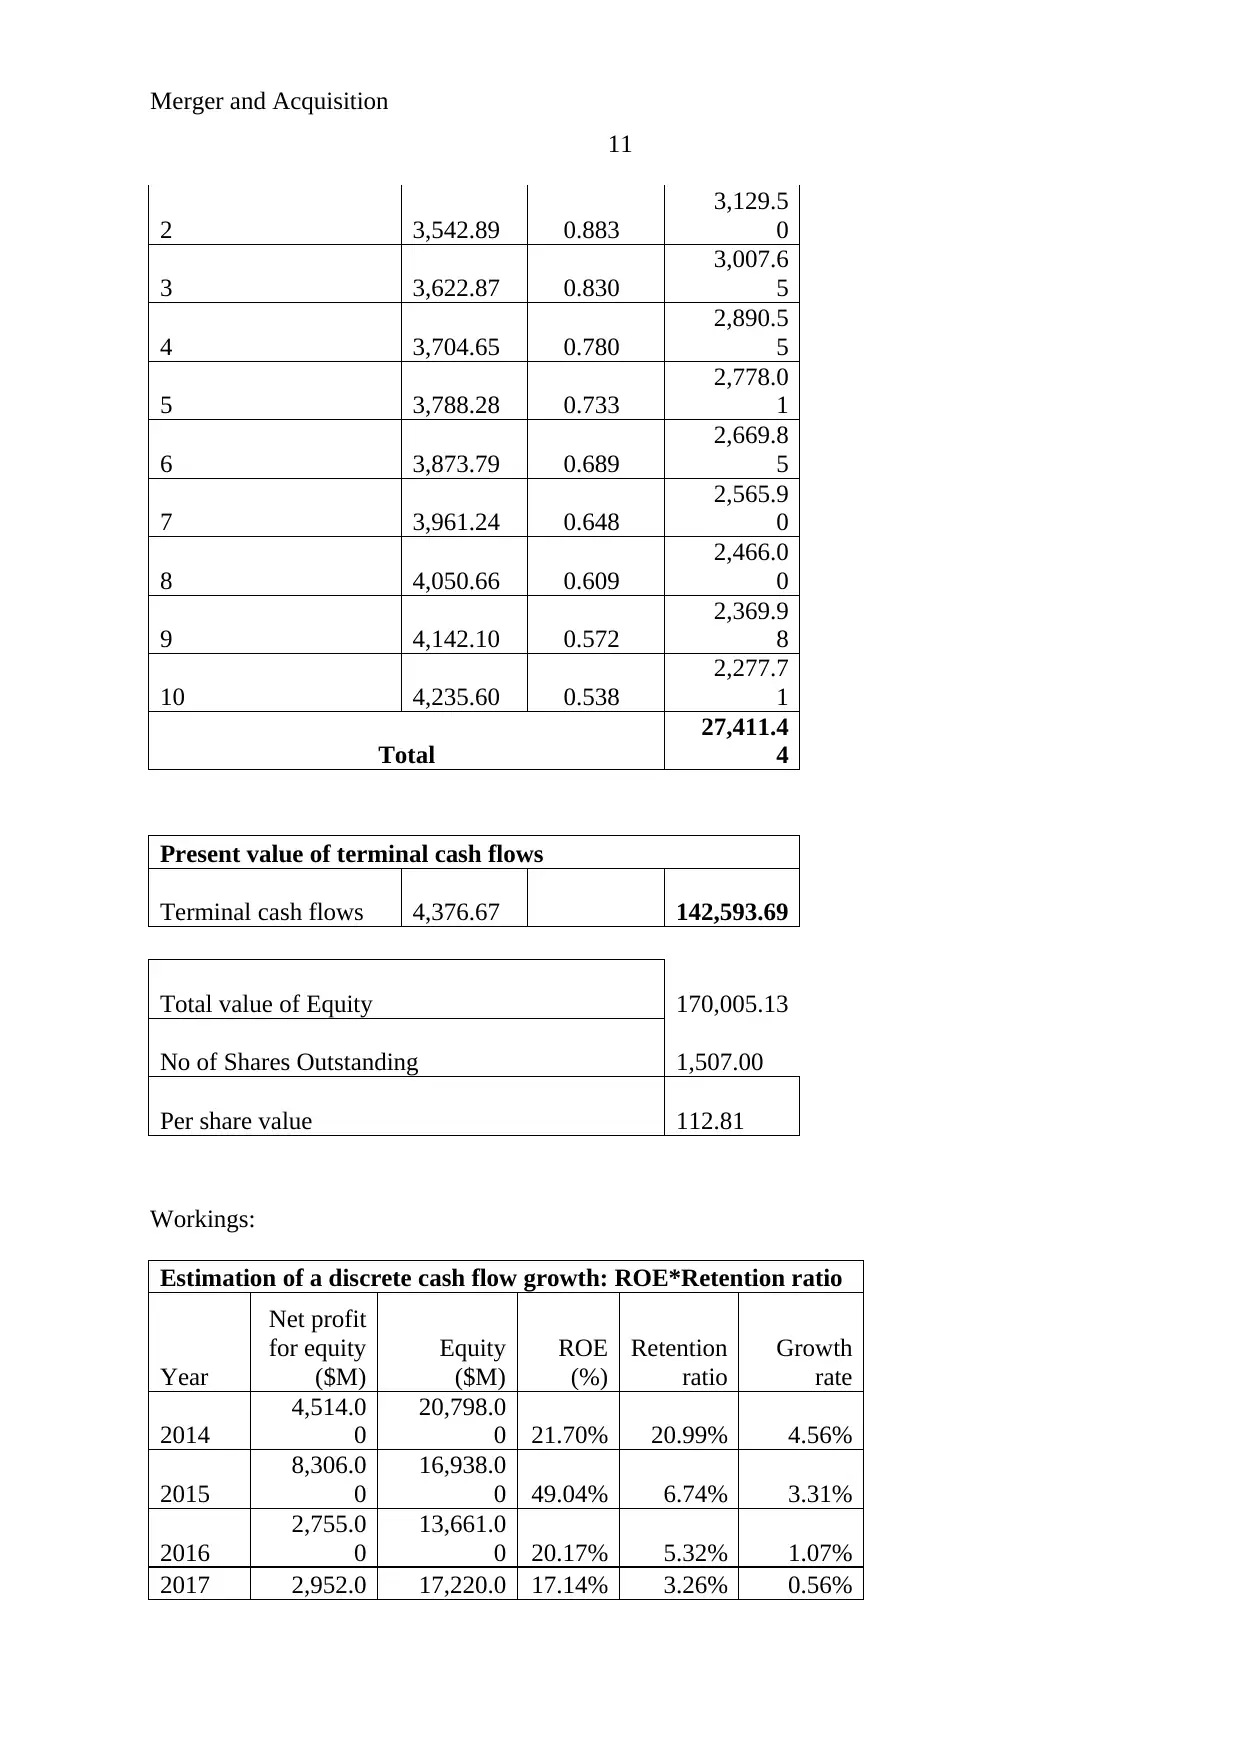
11
2 3,542.89 0.883
3,129.5
0
3 3,622.87 0.830
3,007.6
5
4 3,704.65 0.780
2,890.5
5
5 3,788.28 0.733
2,778.0
1
6 3,873.79 0.689
2,669.8
5
7 3,961.24 0.648
2,565.9
0
8 4,050.66 0.609
2,466.0
0
9 4,142.10 0.572
2,369.9
8
10 4,235.60 0.538
2,277.7
1
Total
27,411.4
4
Present value of terminal cash flows
Terminal cash flows 4,376.67 142,593.69
Total value of Equity 170,005.13
No of Shares Outstanding 1,507.00
Per share value 112.81
Workings:
Estimation of a discrete cash flow growth: ROE*Retention ratio
Year
Net profit
for equity
($M)
Equity
($M)
ROE
(%)
Retention
ratio
Growth
rate
2014
4,514.0
0
20,798.0
0 21.70% 20.99% 4.56%
2015
8,306.0
0
16,938.0
0 49.04% 6.74% 3.31%
2016
2,755.0
0
13,661.0
0 20.17% 5.32% 1.07%
2017 2,952.0 17,220.0 17.14% 3.26% 0.56%
Merger and Acquisition
12
0 0
2018
4,464.0
0
17,418.0
0 25.63% 7.00% 1.79%
Average growth of past five years 2.26%
Note: The future cash flows of next 10 years would depend on the
above calculated growth rate15,
Estimation of the permanent growth rate for second stage
Taking average economic growth of united states for past five years
Year
GDP
($M)
Growth
rate
2014 16155255
2015 16691517 3.32%
2016 17393103 4.20%
2017 18036648 3.70%
2018 18415418 2.10%
Average GDP
growth rate 3.33%
Note: it is not possible for an organization to grow more
than overall economy. Hence, it has assumed that
growth rate of the company would be 2.26%.
A) Market Value Weights
Market Value Weights
Debt Equity Total
Market value of equity
shares ($M) 210,859.44
Add: Retained Earnings 6,933.00
Value of debt (short term
borrowings+ long term
borrowings)
34,267.
00
Total
34,267.
00 217,792.44
252,059
.44
D. Weights
0.
14 0.86
15 Madura, Jeff. International financial management. Cengage Learning, 2011.
⊘ This is a preview!⊘
Do you want full access?
Subscribe today to unlock all pages.
Trusted by 1+ million students worldwide
1 out of 19
Related Documents


Your All-in-One AI-Powered Toolkit for Academic Success.
+13062052269
info@desklib.com
Available 24*7 on WhatsApp / Email
![[object Object]](/_next/static/media/star-bottom.7253800d.svg)
Unlock your academic potential
Copyright © 2020–2026 A2Z Services. All Rights Reserved. Developed and managed by ZUCOL.