Comprehensive Ratio Analysis Report: The Walt Disney Company

Verified

Added on  2019/09/30

|5
|1004
|267
Report
AI Summary
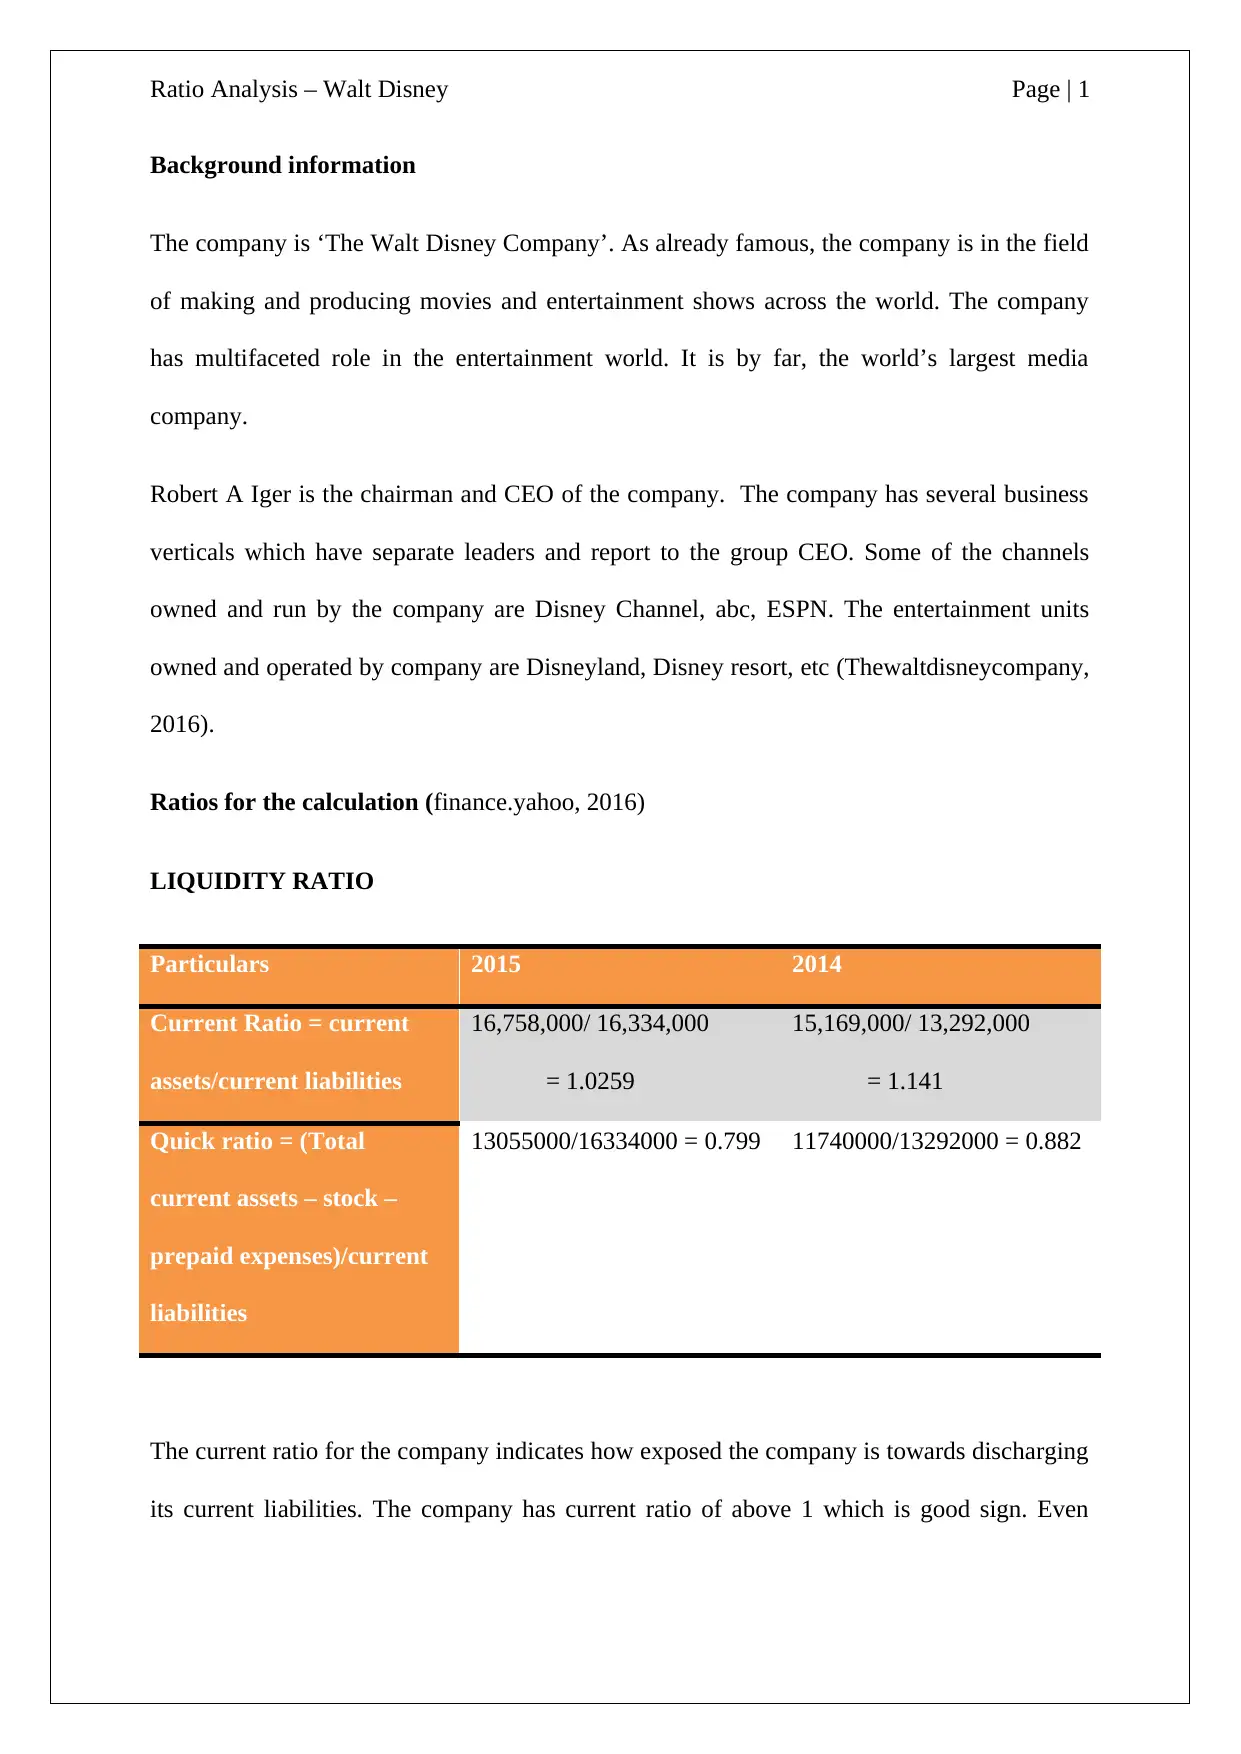
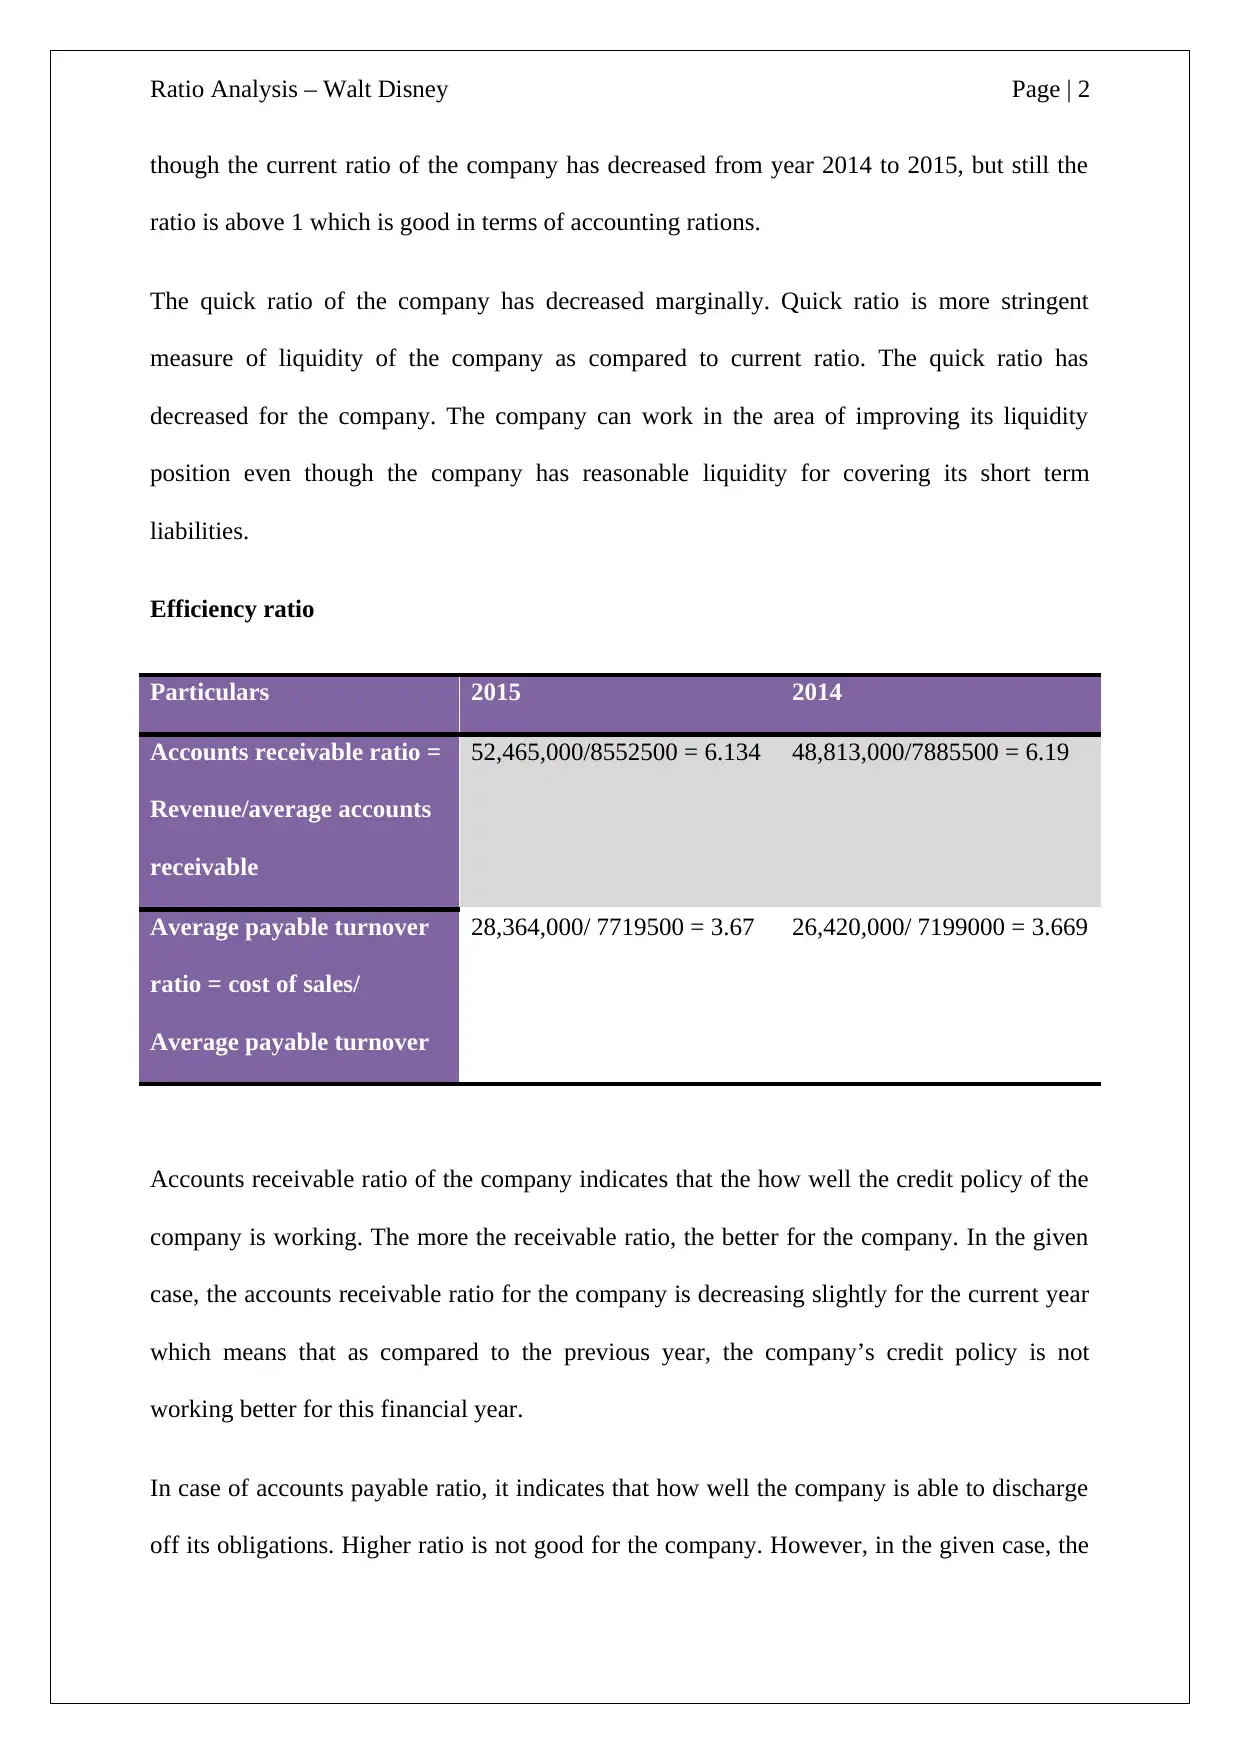
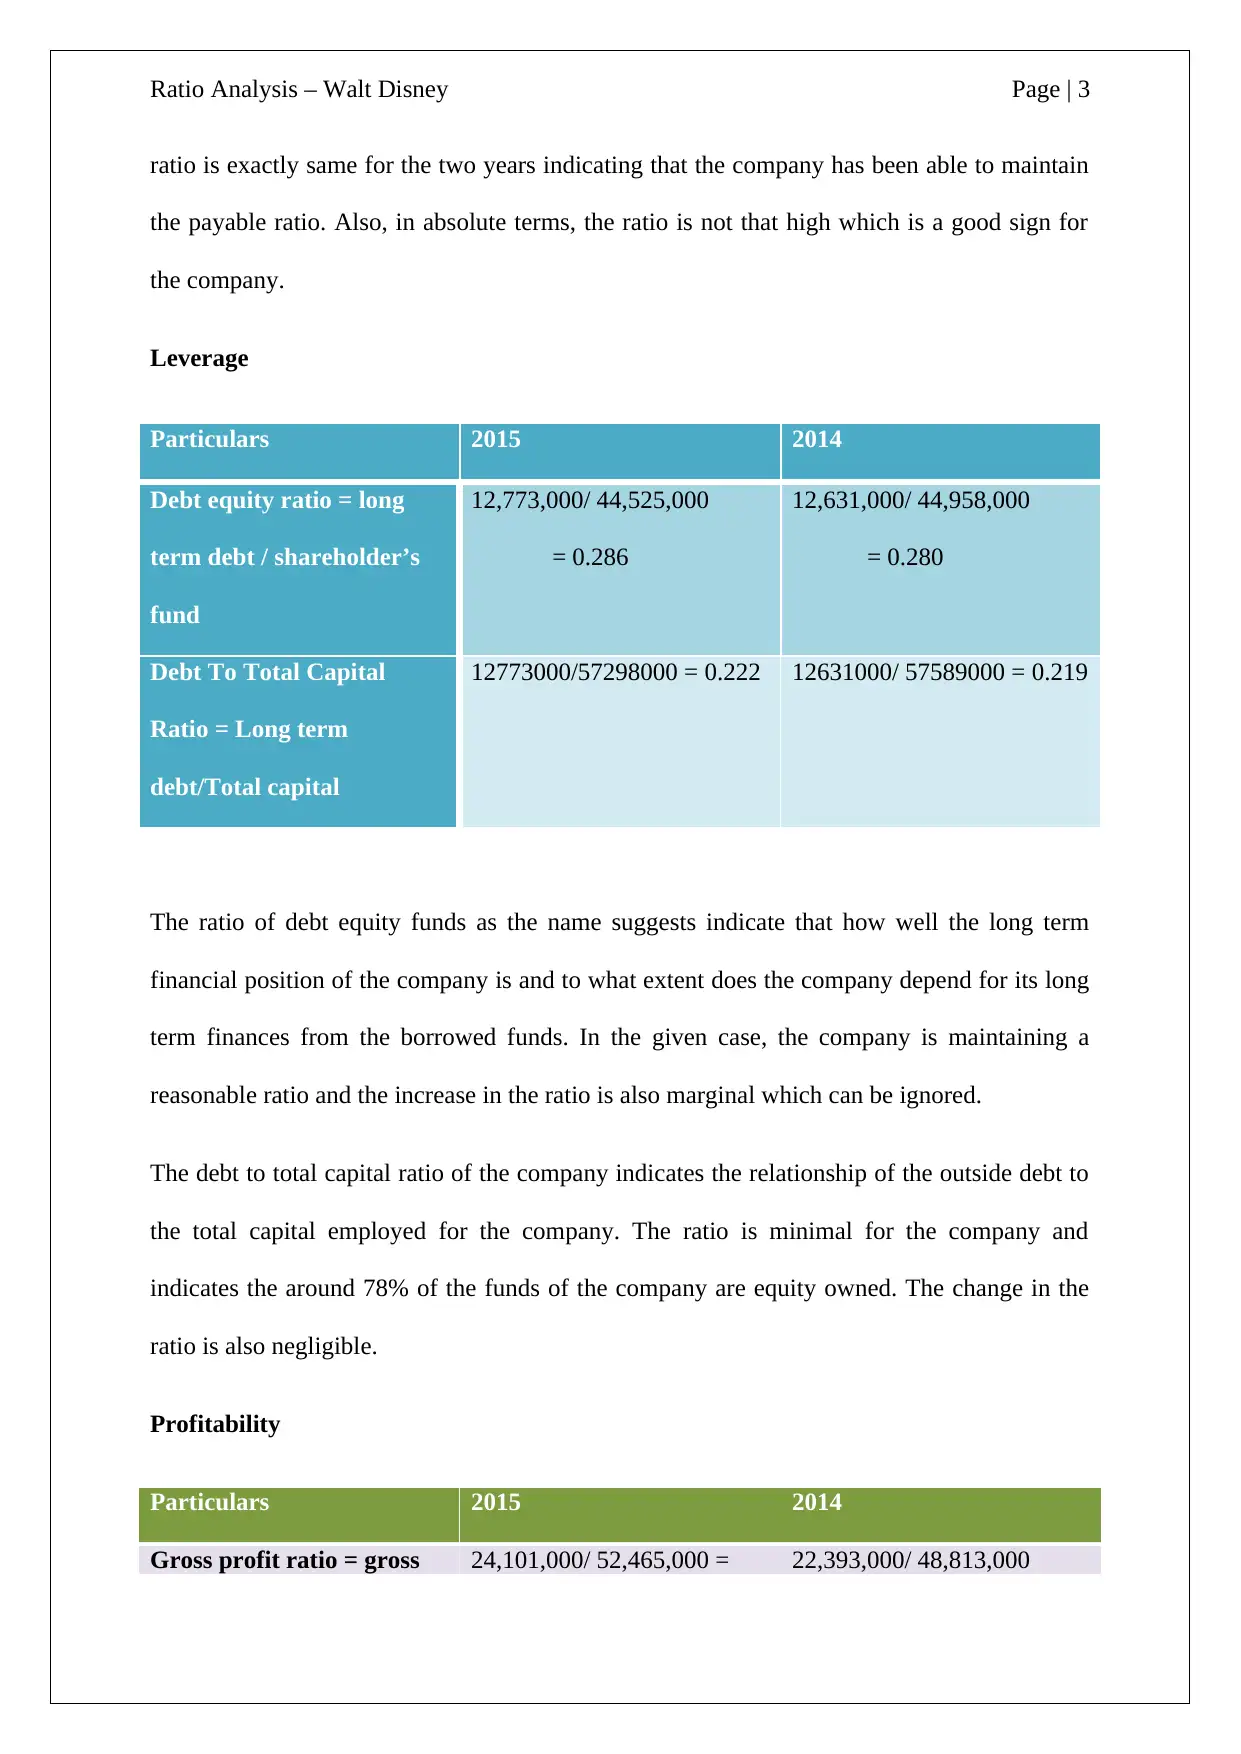
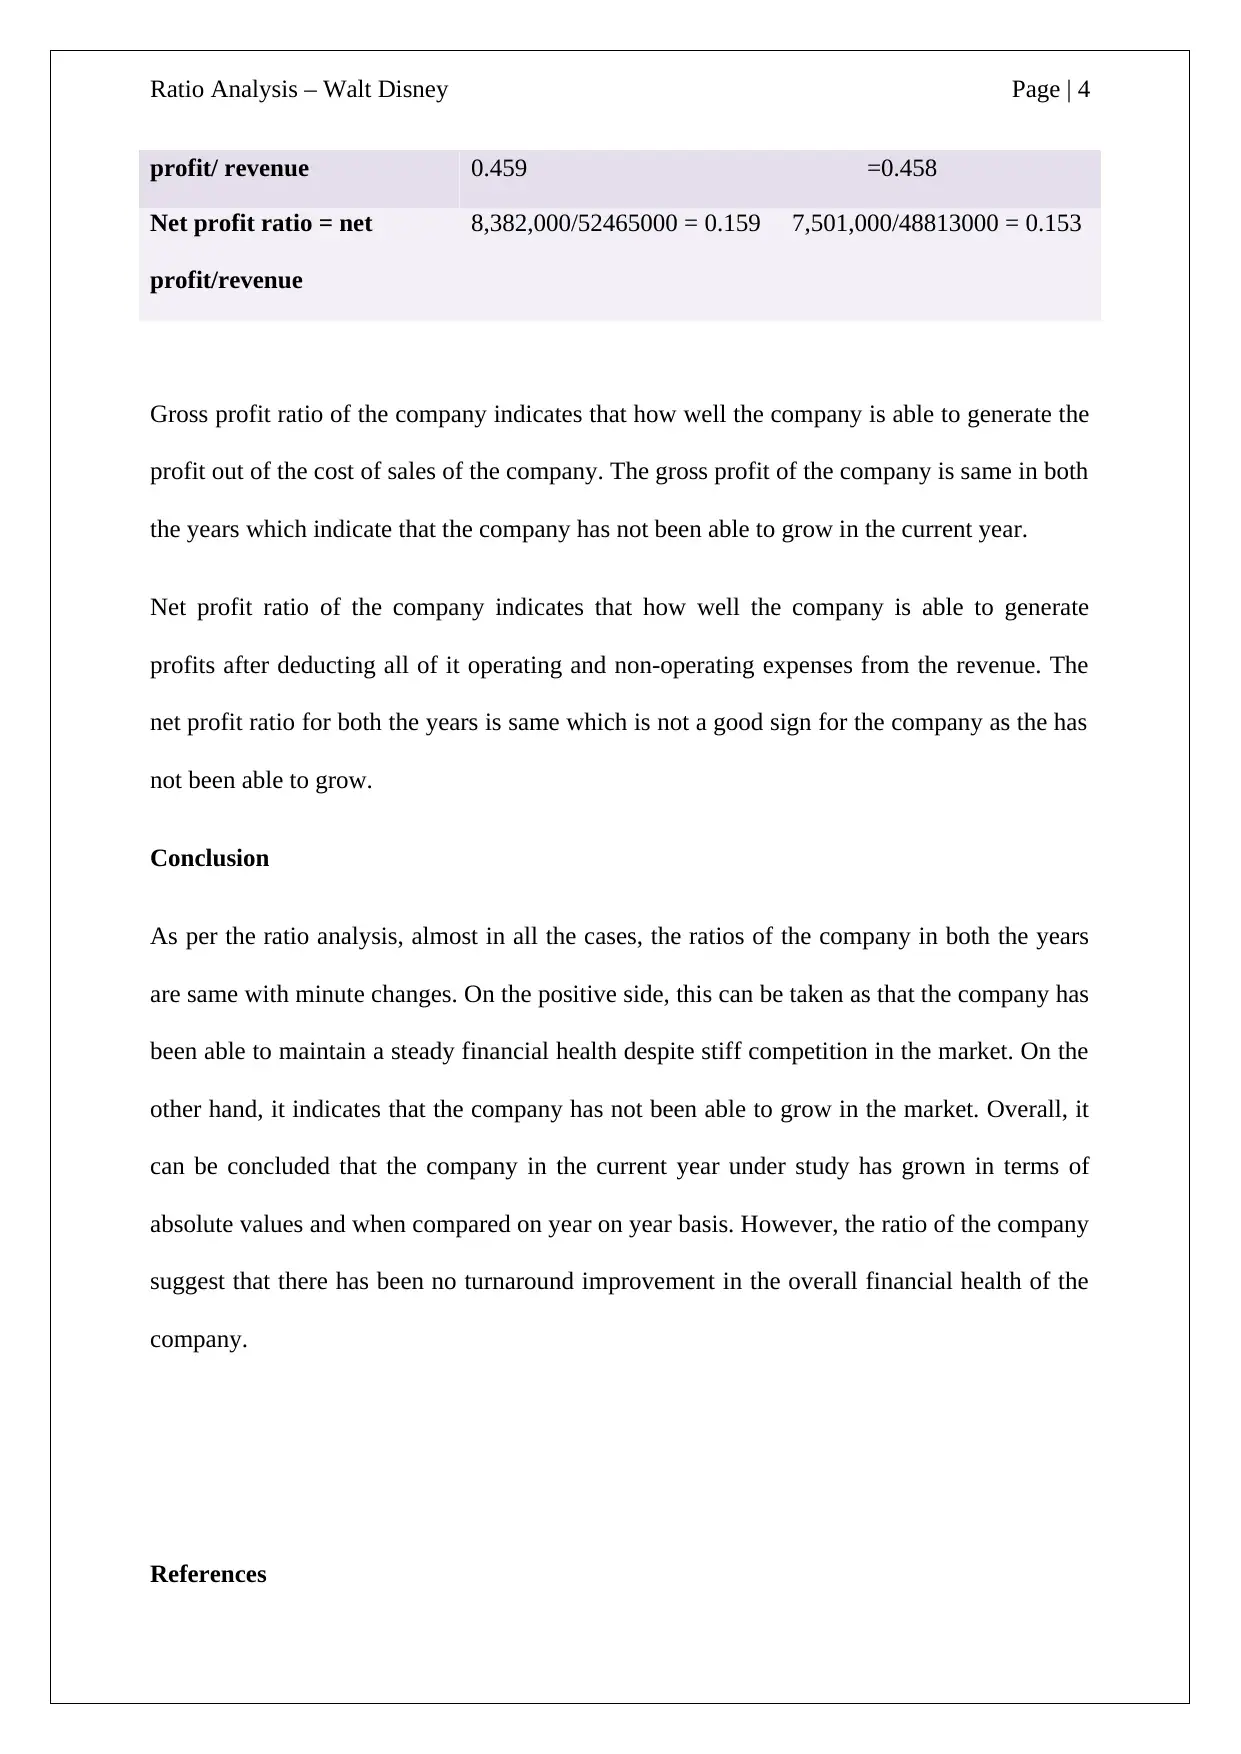
This report presents a comprehensive ratio analysis of The Walt Disney Company, examining its financial performance from 2014 to 2015. The analysis covers key financial ratios including liquidity ratios (current and quick ratios), efficiency ratios (accounts receivable and payable turnover), leverage ratios (debt-equity and debt-to-total capital), and profitability ratios (gross and net profit margins). The report calculates and compares these ratios to assess the company's financial health, efficiency in managing assets, and overall profitability. The findings indicate that while the company maintained a steady financial position with minor changes in ratios, there was no significant improvement in its financial health during the analyzed period. The report concludes by highlighting the company's ability to maintain financial stability amidst market competition, while also noting a lack of substantial growth based on the ratio analysis.
Document Page
RATIO ANALYSIS – WALT DISNEY
tabler-icon-diamond-filled.svg

Secure Best Marks with AI Grader

Need help grading? Try our AI Grader for instant feedback on your assignments.
Document Page
Ratio Analysis – Walt Disney Page | 1
Background information
The company is ‘The Walt Disney Company’. As already famous, the company is in the field
of making and producing movies and entertainment shows across the world. The company
has multifaceted role in the entertainment world. It is by far, the world’s largest media
company.
Robert A Iger is the chairman and CEO of the company. The company has several business
verticals which have separate leaders and report to the group CEO. Some of the channels
owned and run by the company are Disney Channel, abc, ESPN. The entertainment units
owned and operated by company are Disneyland, Disney resort, etc (Thewaltdisneycompany,
2016).
Ratios for the calculation (finance.yahoo, 2016)
LIQUIDITY RATIO
Particulars 2015 2014
Current Ratio = current
assets/current liabilities
16,758,000/ 16,334,000
= 1.0259
15,169,000/ 13,292,000
= 1.141
Quick ratio = (Total
current assets – stock –
prepaid expenses)/current
liabilities
13055000/16334000 = 0.799 11740000/13292000 = 0.882
The current ratio for the company indicates how exposed the company is towards discharging
its current liabilities. The company has current ratio of above 1 which is good sign. Even
Document Page
Ratio Analysis – Walt Disney Page | 2
though the current ratio of the company has decreased from year 2014 to 2015, but still the
ratio is above 1 which is good in terms of accounting rations.
The quick ratio of the company has decreased marginally. Quick ratio is more stringent
measure of liquidity of the company as compared to current ratio. The quick ratio has
decreased for the company. The company can work in the area of improving its liquidity
position even though the company has reasonable liquidity for covering its short term
liabilities.
Efficiency ratio
Particulars 2015 2014
Accounts receivable ratio =
Revenue/average accounts
receivable
52,465,000/8552500 = 6.134 48,813,000/7885500 = 6.19
Average payable turnover
ratio = cost of sales/
Average payable turnover
28,364,000/ 7719500 = 3.67 26,420,000/ 7199000 = 3.669
Accounts receivable ratio of the company indicates that the how well the credit policy of the
company is working. The more the receivable ratio, the better for the company. In the given
case, the accounts receivable ratio for the company is decreasing slightly for the current year
which means that as compared to the previous year, the company’s credit policy is not
working better for this financial year.
In case of accounts payable ratio, it indicates that how well the company is able to discharge
off its obligations. Higher ratio is not good for the company. However, in the given case, the
Document Page
Ratio Analysis – Walt Disney Page | 3
ratio is exactly same for the two years indicating that the company has been able to maintain
the payable ratio. Also, in absolute terms, the ratio is not that high which is a good sign for
the company.
Leverage
Particulars 2015 2014
Debt equity ratio = long
term debt / shareholder’s
fund
12,773,000/ 44,525,000
= 0.286
12,631,000/ 44,958,000
= 0.280
Debt To Total Capital
Ratio = Long term
debt/Total capital
12773000/57298000 = 0.222 12631000/ 57589000 = 0.219
The ratio of debt equity funds as the name suggests indicate that how well the long term
financial position of the company is and to what extent does the company depend for its long
term finances from the borrowed funds. In the given case, the company is maintaining a
reasonable ratio and the increase in the ratio is also marginal which can be ignored.
The debt to total capital ratio of the company indicates the relationship of the outside debt to
the total capital employed for the company. The ratio is minimal for the company and
indicates the around 78% of the funds of the company are equity owned. The change in the
ratio is also negligible.
Profitability
Particulars 2015 2014
Gross profit ratio = gross 24,101,000/ 52,465,000 = 22,393,000/ 48,813,000
tabler-icon-diamond-filled.svg

Secure Best Marks with AI Grader

Need help grading? Try our AI Grader for instant feedback on your assignments.
Document Page
Ratio Analysis – Walt Disney Page | 4
profit/ revenue 0.459 =0.458
Net profit ratio = net
profit/revenue
8,382,000/52465000 = 0.159 7,501,000/48813000 = 0.153
Gross profit ratio of the company indicates that how well the company is able to generate the
profit out of the cost of sales of the company. The gross profit of the company is same in both
the years which indicate that the company has not been able to grow in the current year.
Net profit ratio of the company indicates that how well the company is able to generate
profits after deducting all of it operating and non-operating expenses from the revenue. The
net profit ratio for both the years is same which is not a good sign for the company as the has
not been able to grow.
Conclusion
As per the ratio analysis, almost in all the cases, the ratios of the company in both the years
are same with minute changes. On the positive side, this can be taken as that the company has
been able to maintain a steady financial health despite stiff competition in the market. On the
other hand, it indicates that the company has not been able to grow in the market. Overall, it
can be concluded that the company in the current year under study has grown in terms of
absolute values and when compared on year on year basis. However, the ratio of the company
suggest that there has been no turnaround improvement in the overall financial health of the
company.
References
chevron_up_icon
1 out of 5
circle_padding
hide_on_mobile
zoom_out_icon
logo.png

Your All-in-One AI-Powered Toolkit for Academic Success.

Available 24*7 on WhatsApp / Email

[object Object]