Walt Disney's Financial Performance: A Comprehensive Analysis (2019)

Verified

Added on  2022/08/09

|11
|276
|27
Report
AI Summary
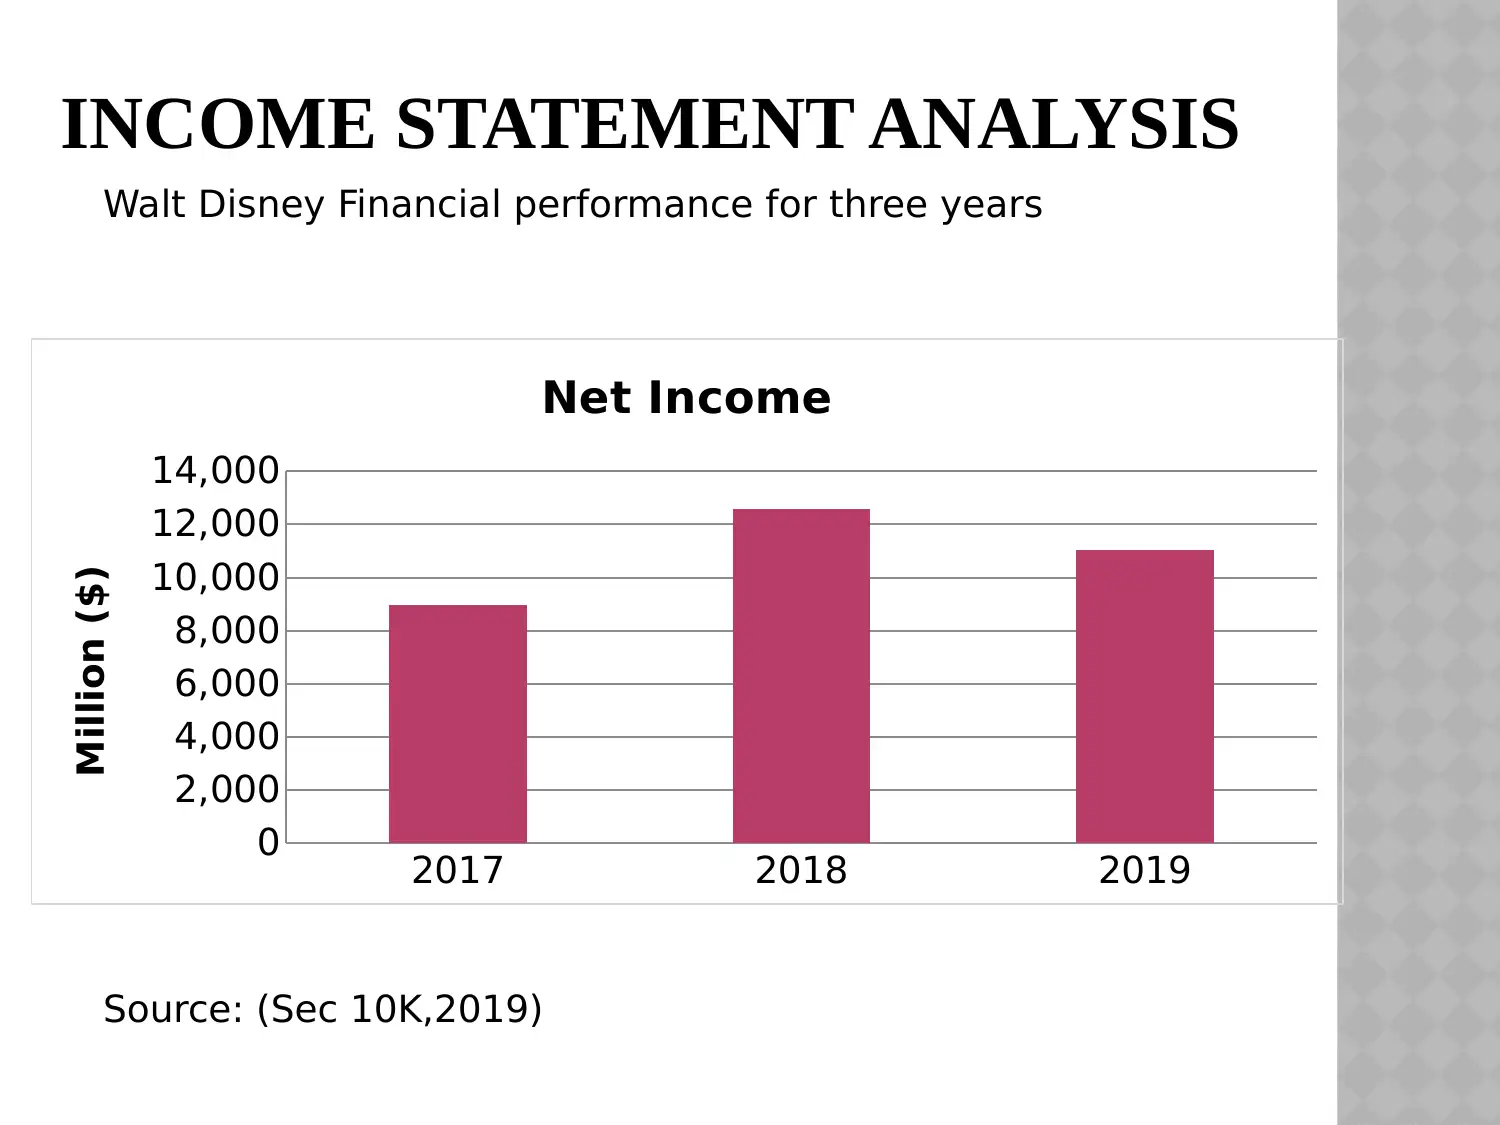
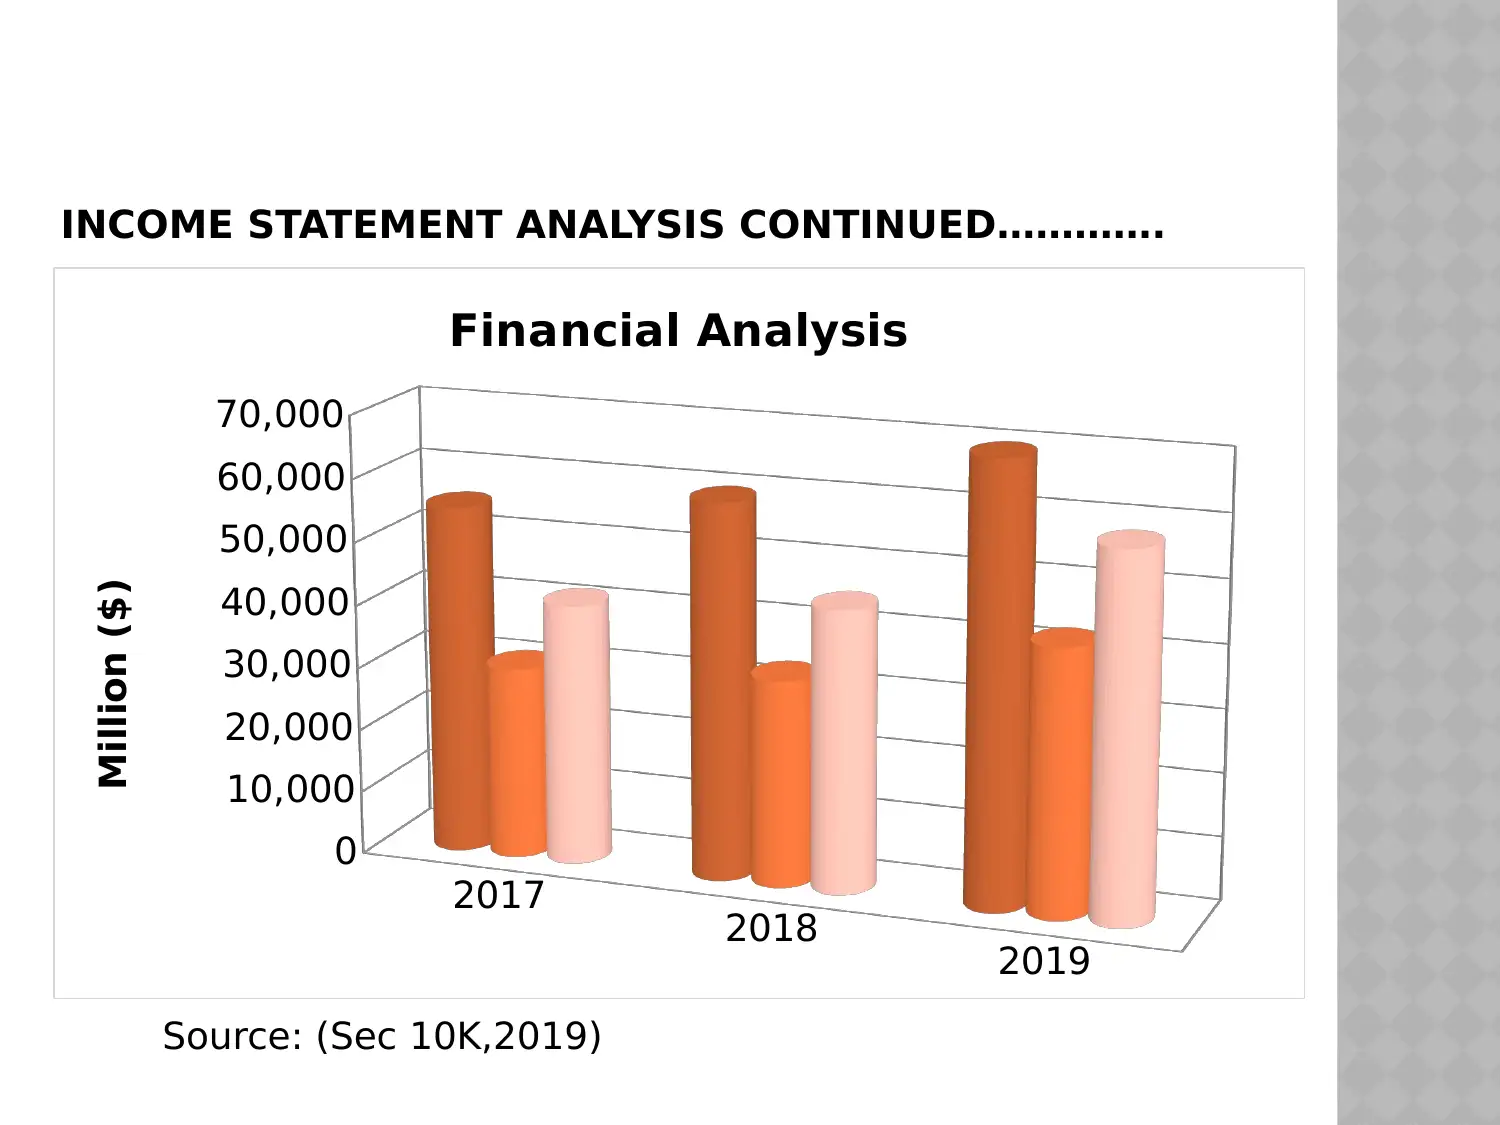
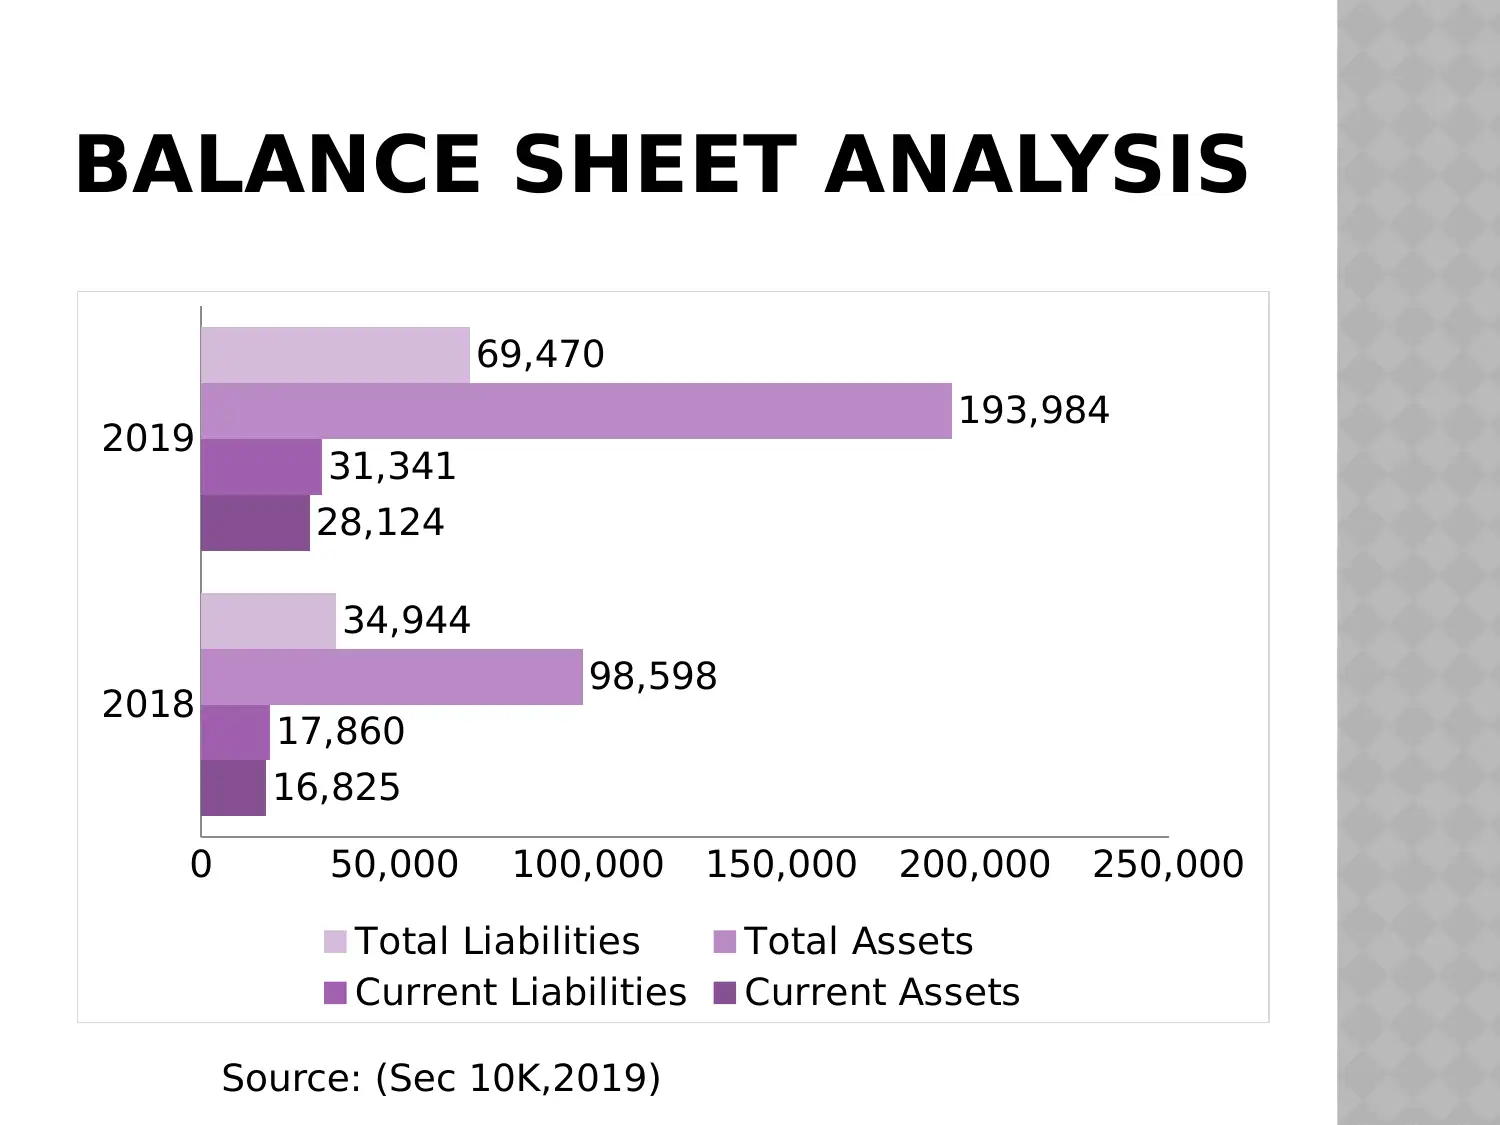
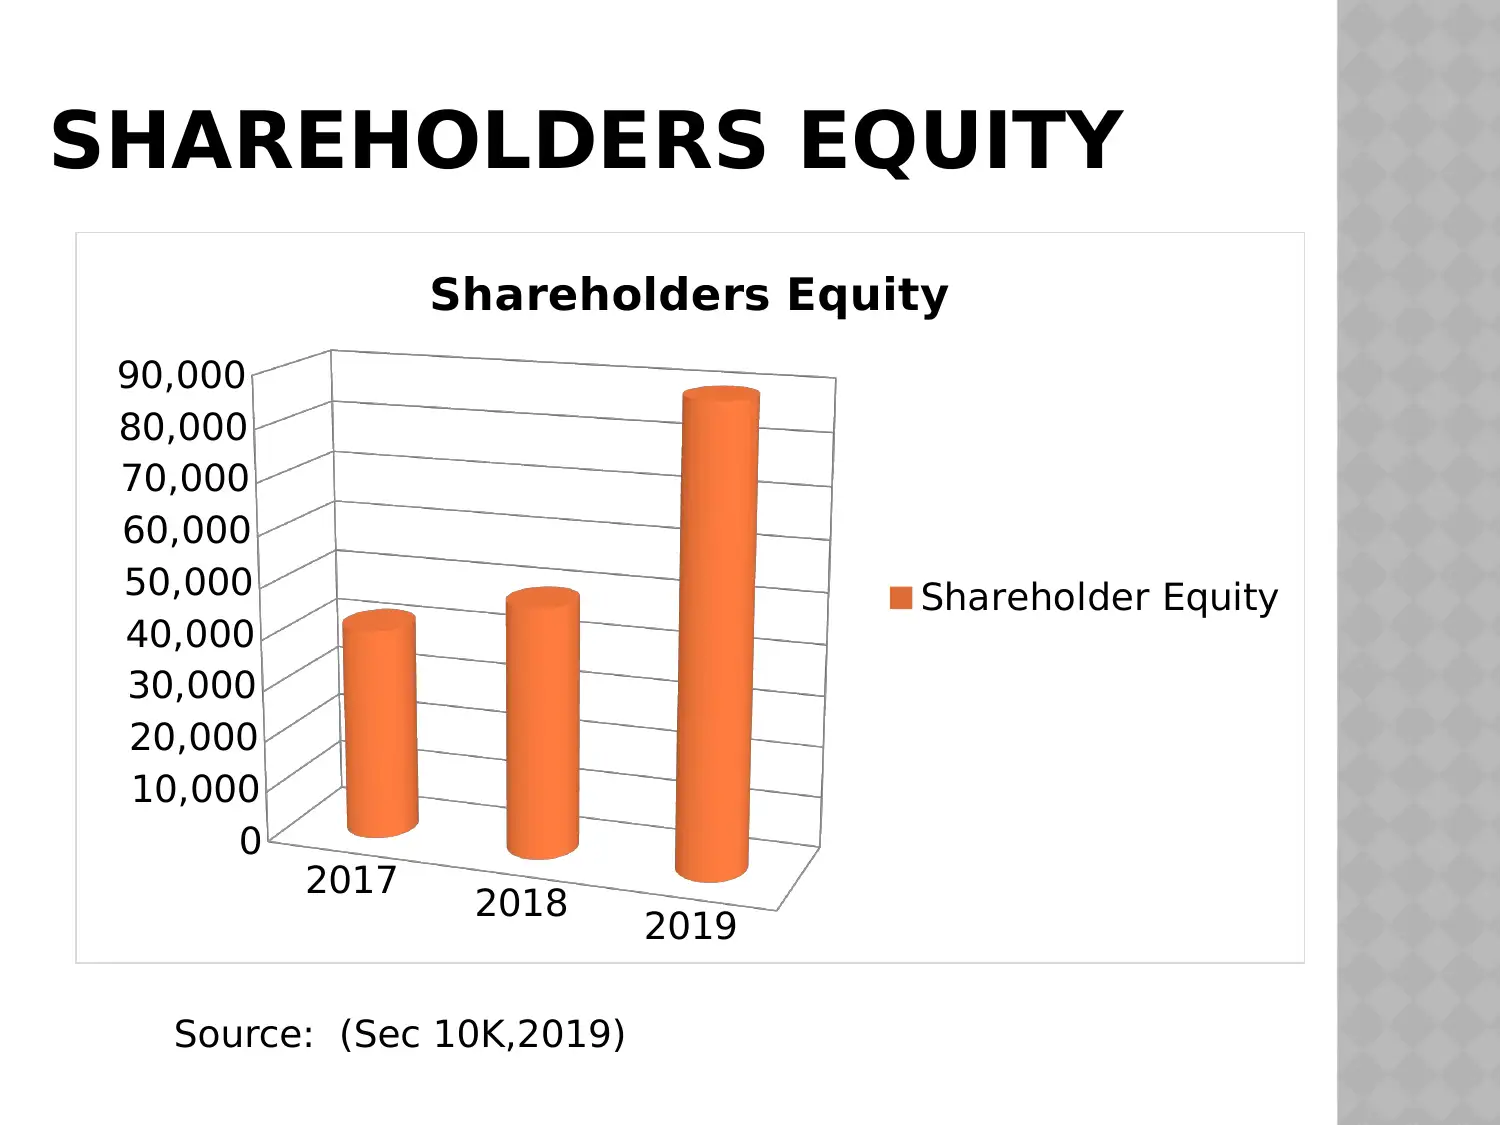
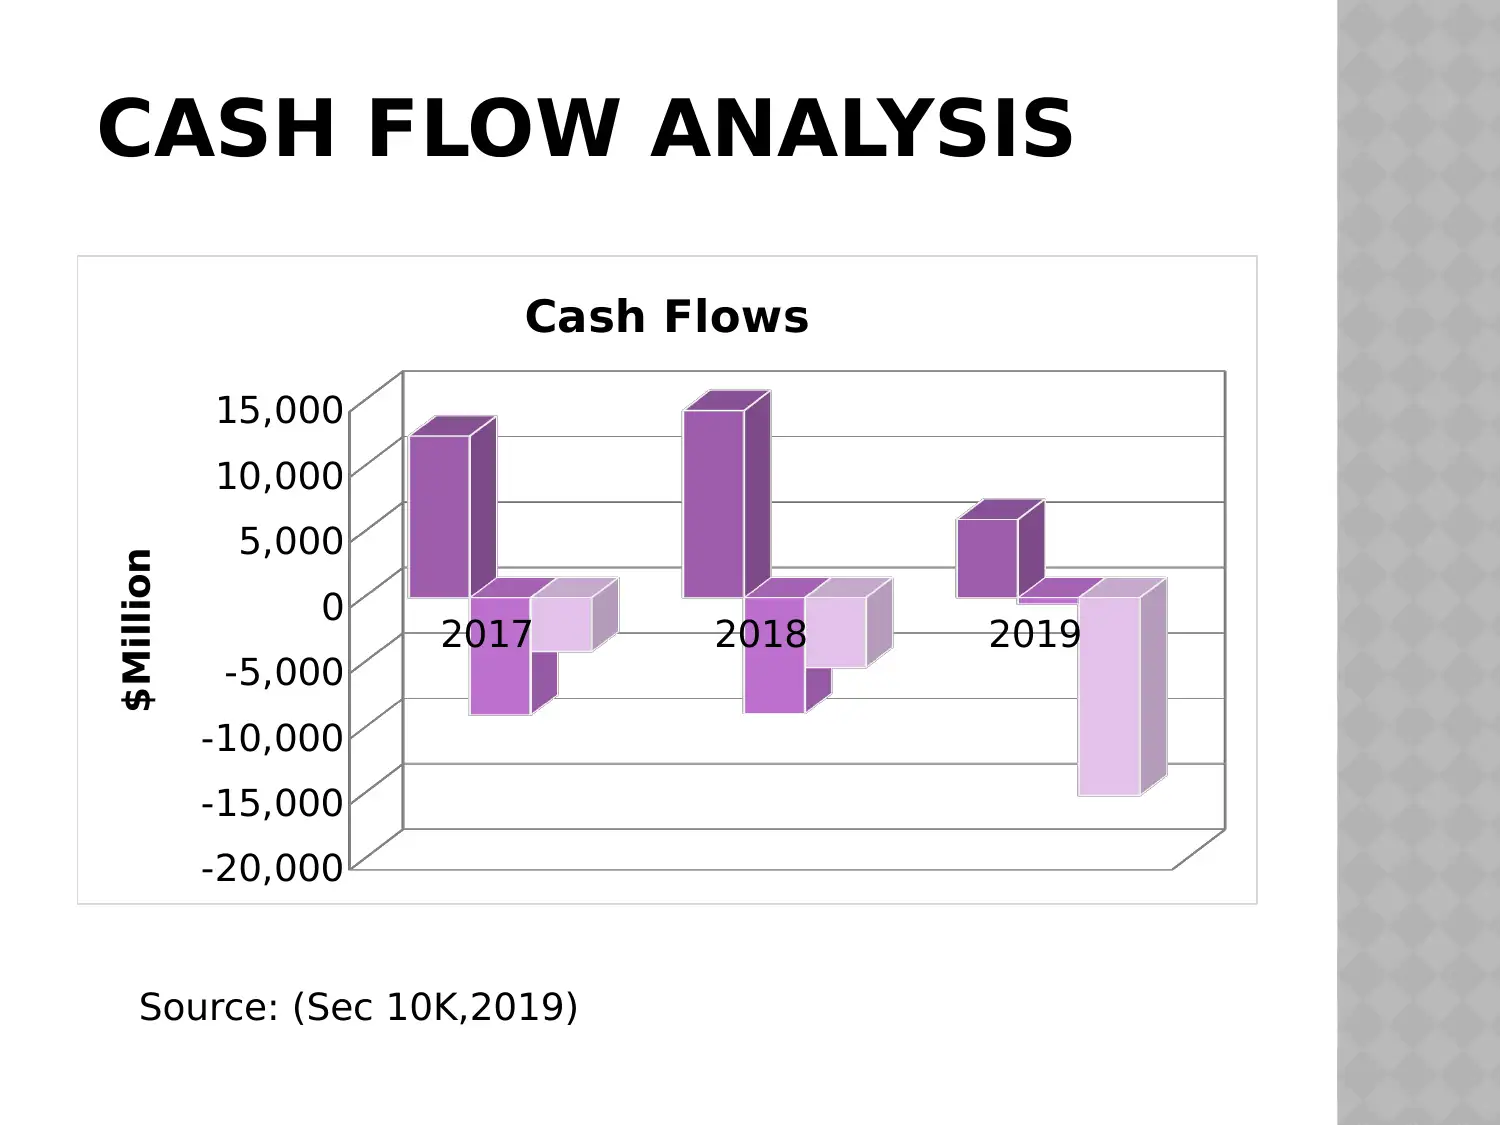
This report provides a detailed financial analysis of Walt Disney, focusing on its performance in 2019. The analysis includes an examination of the company's income statement, balance sheet, and cash flow statement, derived from the 2019 10K report. The report highlights key financial metrics, revenue sources, and trends, such as the significant contribution from parks, experiences, and products to the total revenue. It also discusses the company's shareholder equity and asset growth. The conclusion summarizes the financial health of the company and suggests a positive outlook based on the data analyzed. The report also provides references to the sources used for the analysis.
Document Page
WALT DISNEY
SEC- 10K REPORT
tabler-icon-diamond-filled.svg

Paraphrase This Document

Need a fresh take? Get an instant paraphrase of this document with our AI Paraphraser
Document Page
TABLE OF CONTENTS
Introduction
Income Statement Analysis
Balance Sheet Analysis
Cash Flow Analysis
Conclusion
References
Document Page
INTRODUCTION
Walt Disney is a diversified worldwide entertainment company that was
founded in 1923 by Roy Disney and Walt in America. The Walt Disney
operates in different segments that are; experience and products, media
networks, direct to consumer and studio entertainment (WaltDisney,2020)
The company has workforce of 223,000 people in 2019
Walt Disney revenues mainly comes from Disney media network as in
2019, US$7 million was revenue collected from this segment
(WaltDisney,2020).
Document Page
INCOME STATEMENT ANALYSIS
2017 2018 2019
0
2,000
4,000
6,000
8,000
10,000
12,000
14,000
Net Income
Million ($)
Source: (Sec 10K,2019)
Walt Disney Financial performance for three years
tabler-icon-diamond-filled.svg

Paraphrase This Document

Need a fresh take? Get an instant paraphrase of this document with our AI Paraphraser
Document Page
INCOME STATEMENT ANALYSIS CONTINUED………….
2017 2018 2019
0
10,000
20,000
30,000
40,000
50,000
60,000
70,000
Financial Analysis
Million ($)
Source: (Sec 10K,2019)
Document Page
BALANCE SHEET ANALYSIS
2018
2019
0 50,000 100,000 150,000 200,000 250,000
16,825
28,124
17,860
31,341
98,598
193,984
34,944
69,470
Total Liabilities Total Assets
Current Liabilities Current Assets
Source: (Sec 10K,2019)
Document Page
SHAREHOLDERS EQUITY
2017 2018 2019
0
10,000
20,000
30,000
40,000
50,000
60,000
70,000
80,000
90,000
Shareholders Equity
Shareholder Equity
Source: (Sec 10K,2019)
tabler-icon-diamond-filled.svg

Paraphrase This Document

Need a fresh take? Get an instant paraphrase of this document with our AI Paraphraser
Document Page
CASH FLOW ANALYSIS
2017 2018 2019
-20,000
-15,000
-10,000
-5,000
0
5,000
10,000
15,000
Cash Flows
$Million
Source: (Sec 10K,2019)
Document Page
CONCLUSION
From the analysis of data from Sec 10 K Walt
Disney, it is concluded that total revenues of the company
increased and main contribution was from parks,
experiences and products. While from stockholders equity
analysis it is identified that the company issued more shares
in 2019 in order to raise funds. Further, Walt Disney total
assets was increased by 50 % from 2018. Hence, at present
financial condition of Walt Disney is strong and will
improve in near future.
Document Page
REFERENCES
WaltDisney,2020. About Us. Accessed From: https
://thewaltdisneycompany.com/
Sec 10K,2019. Walt Disney Report. Accessed From: https
://www.sec.gov/ix?doc=/
Archives/edgar/data/1744489/000174448919000225/fy2019q410k.ht
m
#
tabler-icon-diamond-filled.svg

Paraphrase This Document

Need a fresh take? Get an instant paraphrase of this document with our AI Paraphraser
Document Page
chevron_up_icon
1 out of 11
circle_padding
hide_on_mobile
zoom_out_icon
[object Object]