A Comparative Analysis of DDM and DCF Valuation Models in Finance
VerifiedAdded on 2020/02/24
|9
|2664
|48
Report
AI Summary
This report delves into the comparative analysis of two prominent valuation models in corporate finance: the Dividend Discount Model (DDM) and the Discounted Cash Flow (DCF) model. It begins by establishing the significance of valuation in corporate decision-making and explores the superiority of DDM over DCF based on various literature reviews, highlighting issues like earnings manipulation, inappropriate forecasting, and the complexities associated with the use of WACC in DCF. The report then examines the methodologies of both models, illustrating how DDM predicts future dividends and DCF utilizes cash flows. Furthermore, it presents a practical comparison using VBA codes and Bloomberg valuation tools. The report concludes by discussing the advantages of DDM, particularly in the New Zealand market, and provides a comprehensive overview of the models, offering valuable insights into their application and effectiveness in financial analysis.
INTRODUCTION
Valuation is considered as a key part of corporate finance. In case of corporate finance, a
corporation values can be enhanced by altering its investment, financing and dividend
choices. To ascertain the efficiency of markets, it is required to analyse market prices,
whether they differ from value, and if they do differ, how rapidly they returned to same.
According to Damodaran (2006), to create smart corporate decisions, it is important to
understand how the value of a corporation is determined and how to assess corporate value.
For millions of financial specialists, inside their theory and practical work, the conception of
determining and changing worth and valuation holds a superior place. According to the
research of Adamczyk & Zbroszczyk (2017), the reason for this attachment is that these
conceptions provide those answers to various questions, such as a number of units in
currency and values of an audited company.
In accounting and finance, generally these two models are most used, the Dividend Discount
model (DDM) and the other one is Discounted Cash Flow model (DCF). There have been
many debates regarding the superiority of one model over the other in between researchers.
The primary remuneration of the asset is dividend; therefore it is required discounting cash
flow of a business for determining the worth of equity (Zhang, 2013). Al-MAlkawi (2007), a
financial expert, advised that the importance of divided are higher than retain earning to
investors, in his Bird-in-the Hand Concept, while mentioning the insecurity of future cash
flows. According to this theory, investors prefer dividend distribution since it provides clear
future predictions, and they favor risk aversion of investment.
According to dividend discount model, all upcoming dividends discounted since today, for
assessing the equity’s worth, while applying the suitable cost of investment for a discount
percentage. Author Roberg G. Hagstrom provided that, John Burr William’s model (dividend
discount model) considered the best technique for assessing the intrinsic worth of firm, by
greatest investors worldwide (Charumathi & Suraj, 2014).
In this report, there are six units. Firstly, the introduction of the report describes its motives
and difficulties. The second part focus on analysing the supremacy of dividend discount
model, over the popular model called discounted free cash flow model, based on various
literature reviews. The third part of the report, emphasis over analysing of both models
working methods. The fourth part compares both models’ work by using valuation tools of
Paraphrase This Document
Need a fresh take? Get an instant paraphrase of this document with our AI Paraphraser
VBA and Bloomberg. The fifth part answers the question relating to the advantage of
dividend discount model and provides reasons for its superiority over New Zealand market.
The last part provides writer’s deductions, which indicates the summary of the conclusion.
LITERATURE REVIEW
Outline of DDM
According to John Burr Williams (1997), a share represents worth of all upcoming dividends,
neither less or more. Current incomes, outlooks, monetary situations, and capitals worth
should be included in shares price, which helps investors in determining future profits. The
dividend discount model is the main model above other models and their value is determined
based on their remedies for terminal worth for DDM (Penman, 1997).
Why is DDM superior to the DCF?
The key feature which differentiates both models is that DDM predicts future dividends and
in case of DCF, it uses cash flows to estimate the worth of a company. Following are the
various reasons for DDM superiority over DCF model.
Earnings Manipulation
Healy & Wahlen (1999) provided the definition of earning manipulation, which means, it
happens when managers, in order to deceive shareholders regarding the economic
performance of corporation or to influence performance that based on financial reports,
change the outcome of financial statements and transactions of the firm.
The experts use this data for research purposes or the investors analyse this data to ascertain
the valuation of the firm and for investment purpose, evidence provided that these figures can
be manipulated by managers. These manipulations, executed due to the pressure of achieving
earning expectations, can lead to decrease in the quality of income and causes corporate
scandals (Courteau, Kao, & Tian, 2015).
According to the study of Penman (1997), the experts, investors, and specialists should not
use managerial income data as a face value for the purpose of firm’s valuation. High
emphasis on such data can result in the wrong valuation which can lead to detrimental
financial decisions and loss of resources of investors.
According to Landsman (2007), the conclusion of the study suggested that revealed and
identified values are helpful for investors, but the data is influenced due to the inaccuracy of
measurement and assessment from various sources, such as management and external
appraisers.
In case of DCF model, the financial reports are analysed to determined free cash flow. The
management of the firm can easily influence the data of these reports, which can lead to
incorrect valuation. Whereas, in case of DDM, the value of shares is based on dividends of
the company.
Inappropriate forecasting
According to Abrams (2010), the key problem of DCF is that the valuation is conducted for
the present but the data of cash flows are estimated for the future. This can lead to
underestimation of the worth of the corporation. Another problem is the rigid nature of
models; due to this factor they did not estimate possible changes in corporation’s
environment.
While forecasting the data of financial report, it is tough for companies to equal their balance
sheets. It is called balancing problem. If any data or information is missed or a mistake has
done by one of the employees, the balance sheet shows an error or mismatch, due to the
principles of double entry system. The company solves such problem by implementing a plug
in their financial reports. This is a simpler approach but it contains certain risks. The plug
shows that everything matches in the balance sheet, even when there is are errors in the
financial reports (Vélez-Pareja, 2011). The DCF required many estimations, such as
depreciation, working assets and much more, as compared to DDM which required fewer
estimations.
Use of WACC
It is estimated that capital structure should be the method for valuation in the market. But in
case of DEF model, there is a problem of the malicious circle. The method is based on the
fact that to assess the worth of equity, FEFF method is required, for which WACC should be
available. In order to recognise the WACC, the researcher should know the capital structure
of the firm, and for ascertaining, capital structure, the worth of equity and liability must be
available (Adamczyk & Zbroszczyk, 2017).
⊘ This is a preview!⊘
Do you want full access?
Subscribe today to unlock all pages.
Trusted by 1+ million students worldwide
To determine WACC, there are two key problems faced by the researcher. The first is while
determining the worth of company’s capital by presumptuous that the organisation is in long
term, have the similar structure as peer corporations (Adamczyk & Zbroszczyk, 2017).
The second problem related to assessing WACC is that the calculation is based on book
figures instead of market figures. The definition provided by Fernández (2010) in his book,
the calculation of WACC is based on the market worth of liability and equity. Though the
definition preferred market figures process, in circumstances of the problem in assessment,
particularly in non-listed organisations case, the writer allows the usage of book figures
(Cornell, 1993) (Mills, 1998) (Bartoszewicz, Pniewski, & Szablewski, 2008).
The primary criticism of applying WACC method is that it failed in reflecting the correct
economic claims of every fund's provider, instead, it reflects just the worth of investment in
the firm, done by different investors previously (Copeland, Koller, & Murrin, 1990).
HOW THE MODEL WORKS
1. The future dividend is predicted for the term in which company’s growth raise, by
implying pay-out ratio for the high progress term and expected progress percentage in
income per stock.
2. The predictable growth percentage is assessed by implying basics: Expected growth =
Retention Ratio * Return on Equity. Otherwise, the company can contribute their own
growth percentage.
3. In the end of high growth term, the predictable terminal amount is assessed by using
dividends per stock after a year from progress phase, implying growth percentage in
steady growth; the payout ratio is steady progress and expenses of equity in steady
progress.
4. Both dividends over single stock and terminal amount are reduced back to current
period by implying a cost of equity.
5. If the price of equity in steady progress is dissimilar from the price of equity from
high progress phase, in such case, the price of equity in afterward partial of stable
growth phase will become adopted slowly from high progress price of equity to
steady process price of equity.
6. This can convert into steady growth model by considering the high progress phase to
zero.
Paraphrase This Document
Need a fresh take? Get an instant paraphrase of this document with our AI Paraphraser
7. In case of availability of abnormal return, it can be standardised by applying past net
profits.
DISCUSSION
Assessment of DDM by applying VBA codes and Bloomberg valuation devices
DDM assessment by applying VBA codes
DDM technique is based on equity level method instead of entity level method. In DDM
equity is assessed by predicting dividends and discounting upcoming dividends based on the
cost of equity percentage. In this case, the dividend is cash settlements of stockholders.
Equity worth is the present value (PV) of predictable upcoming dividends. Generally, to
assess a share by implying DDM, it is required to predict the cost of equity, the predictable
settlement ratio and predictable progress rate in income per stock over time, in case of DDM
(Charumathi & Suraj, 2014).
Cost of Equity
It requires reflecting the percentage of threat in the equity that cannot be spread by a
borderline stockholder in the share. The threat is projected by implying beta in capital asset
valuation method.
Pay-out Ratios
The pay-out ratio defines that the dividend expected for an upcoming period on a share can
be described as the product of predictable income on each share for the period. Deriving
dividend from predictable income has two benefits. First one is that it helps in focusing on
predictable progress in income, which is sensible and available at the same time, as compared
to growth in the dividend. The second benefit is that it can be changed over time, according
to the growth and investment opportunities.
Expected DPS = Expected EPS * Dividend Pay-out Ratio
Expected Growth
If dividend of a company is based upon income, the predictable progress rate that will assess
value is the predictable progress rate in income. The expected growth in income of one stock
can be described as a task of retention ratio and profit on equity:
Expected Growth in EPS = Retention ratio * Return on equity
This equation assists in the estimation of predictable growth rate for corporations with steady
profit on equity. By recognising share buybacks in extension to dividend while analysing the
pay-out, retention ratio should be determined reliably too.
This equation allows us to estimate the expected growth rate for firms with stable returns on
equity. If we consider stock buybacks in addition to dividends when looking at payout, the
retention ratio should be defined consistently as well. According to (Palepu & Healy, 2013, p.
279)
V 0
E= ¿t
(1+r e)1 + ¿t
¿ ¿ ¿….. ¿t
(1+re )t
Where: V 0
E= Equity Value
Div = Dividend
Re= Cost of equity
But when the future dividends increase at a constant growth rate (Gordon Growth Model/
Constant Growth Model) the formula is as follows:
V 0
E= ¿1
re−gd
Where: gd= constant growth rate of dividend.
The above formula illustrates that the firm has an infinite life. (Penman S. H., 2013) Argues
that dividends cannot be forecasted for an unlimited period. As a result, terminal Payoff or
Terminal value is added at the end of forecasting horizon to capture its full value.
The formula is as follows:
V 0
E= ¿1
(1+r e)+ ¿2
(1+ re)2 + ¿T
(1+re)T + ¿T +1
(re−gd )(1+re)T
Where: T= end of forecasting horizon
This conception assists experts by providing a valuation tool that is wide-ranging and
reasonably simple to conduct the valuation. Since the experts know how and what to forecast
⊘ This is a preview!⊘
Do you want full access?
Subscribe today to unlock all pages.
Trusted by 1+ million students worldwide
when it comes to the dividend. It assists in the smooth application of DDM accordingly
(Penman S. H., 2013, p. 114).
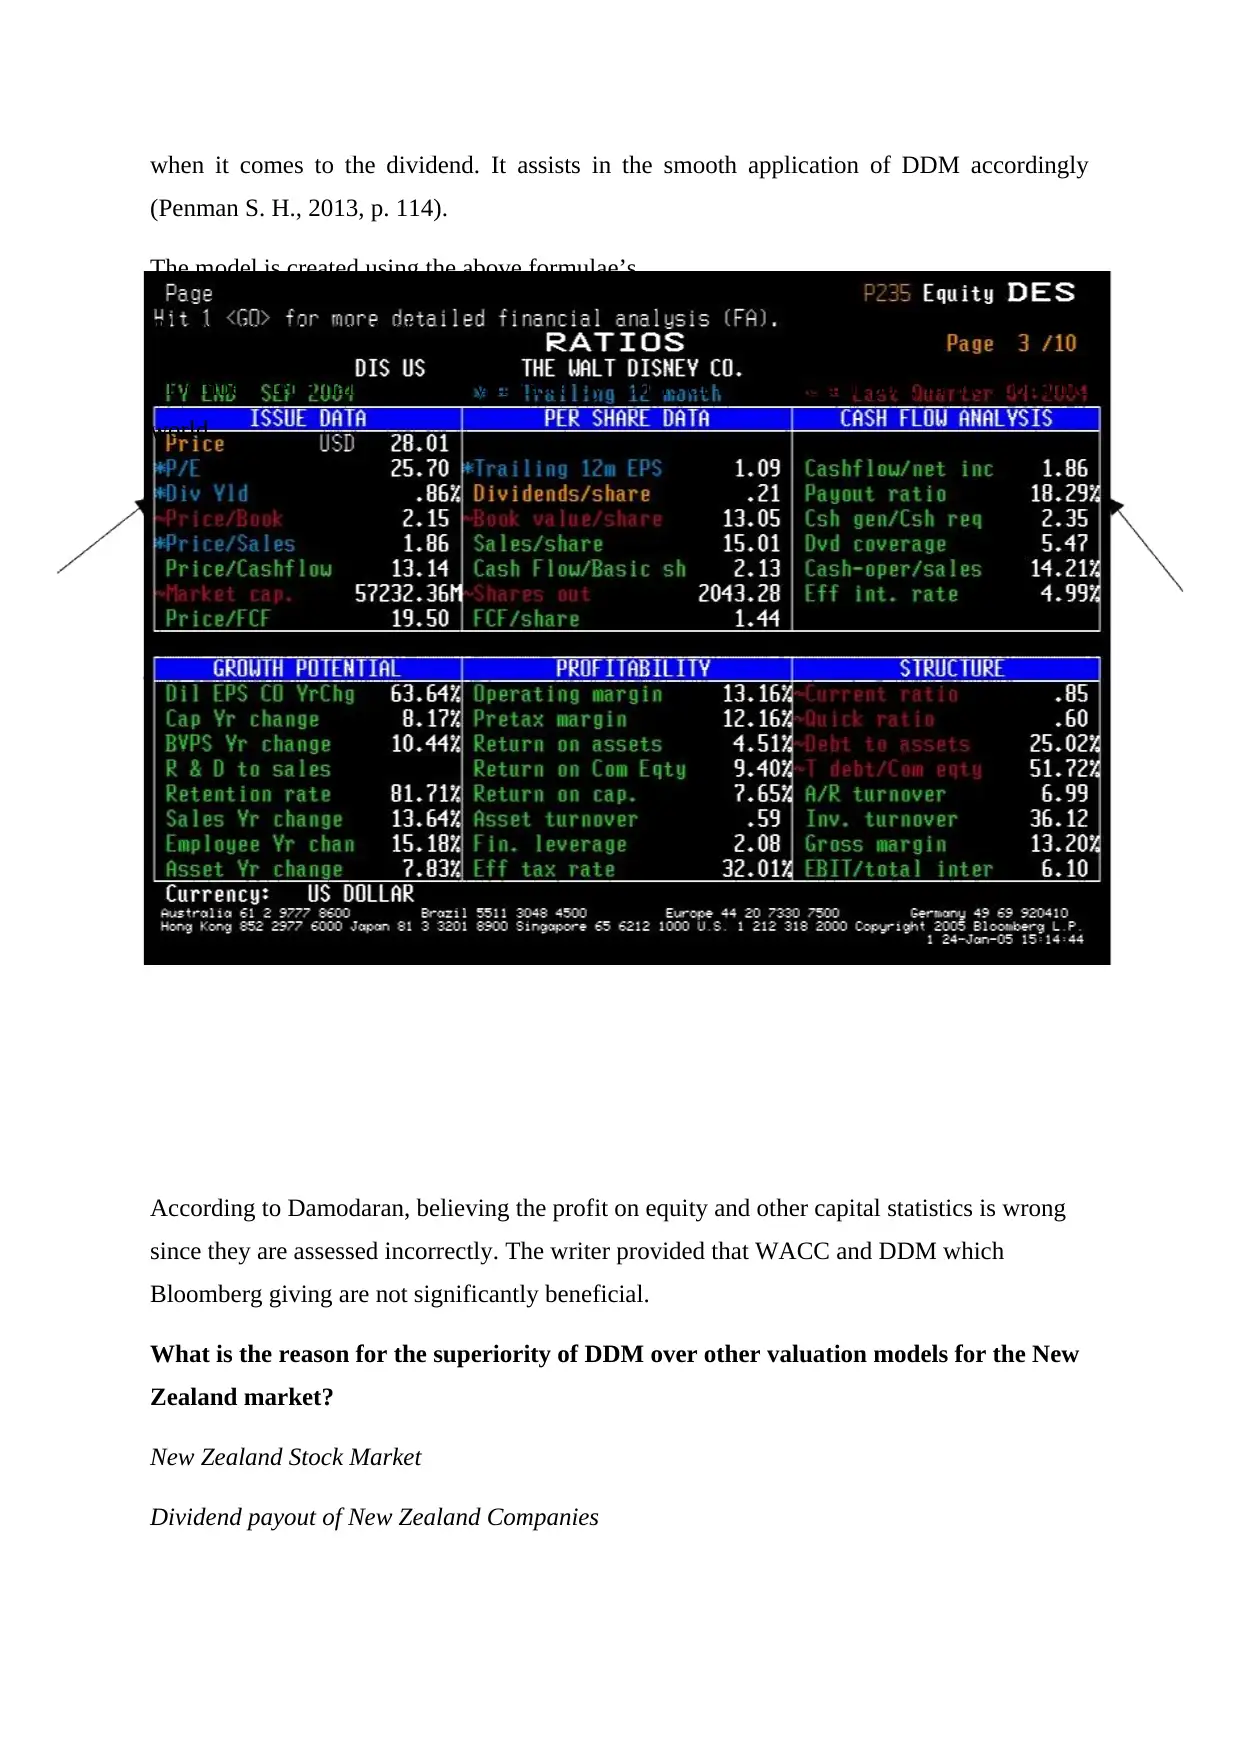
The model is created using the above formulae’s.
Bloomberg Valuation tools
Bloomberg terminals are broadly implied by traders of the financial report, in the economic
world.
According to Damodaran, believing the profit on equity and other capital statistics is wrong
since they are assessed incorrectly. The writer provided that WACC and DDM which
Bloomberg giving are not significantly beneficial.
What is the reason for the superiority of DDM over other valuation models for the New
Zealand market?
New Zealand Stock Market
Dividend payout of New Zealand Companies
(Penman S. H., 2013, p. 114).
The model is created using the above formulae’s.
Bloomberg Valuation tools
Bloomberg terminals are broadly implied by traders of the financial report, in the economic
world.
According to Damodaran, believing the profit on equity and other capital statistics is wrong
since they are assessed incorrectly. The writer provided that WACC and DDM which
Bloomberg giving are not significantly beneficial.
What is the reason for the superiority of DDM over other valuation models for the New
Zealand market?
New Zealand Stock Market
Dividend payout of New Zealand Companies
Paraphrase This Document
Need a fresh take? Get an instant paraphrase of this document with our AI Paraphraser
A dividend strategy of a company provides details regarding whether the firm is going to
distribute their profits by declaring a dividend or retaining the earning for future reinvestment
process. It is the partition of profit between shareholder’s dividends and retains earning in the
balance sheet (Profilet, 2013).
According to Profilet (2013), in 1988, the main motive of change in imputation structure of
New Zealand was to inspire organisations to enhance their dividend payout. In case of a
dividend imputation scheme, the tax levied over the profits allocated as a dividend to
shareholders on which tax has already been imposed but the shareholder is provided by credit
for the amount of tax imposed on profit for the second time.
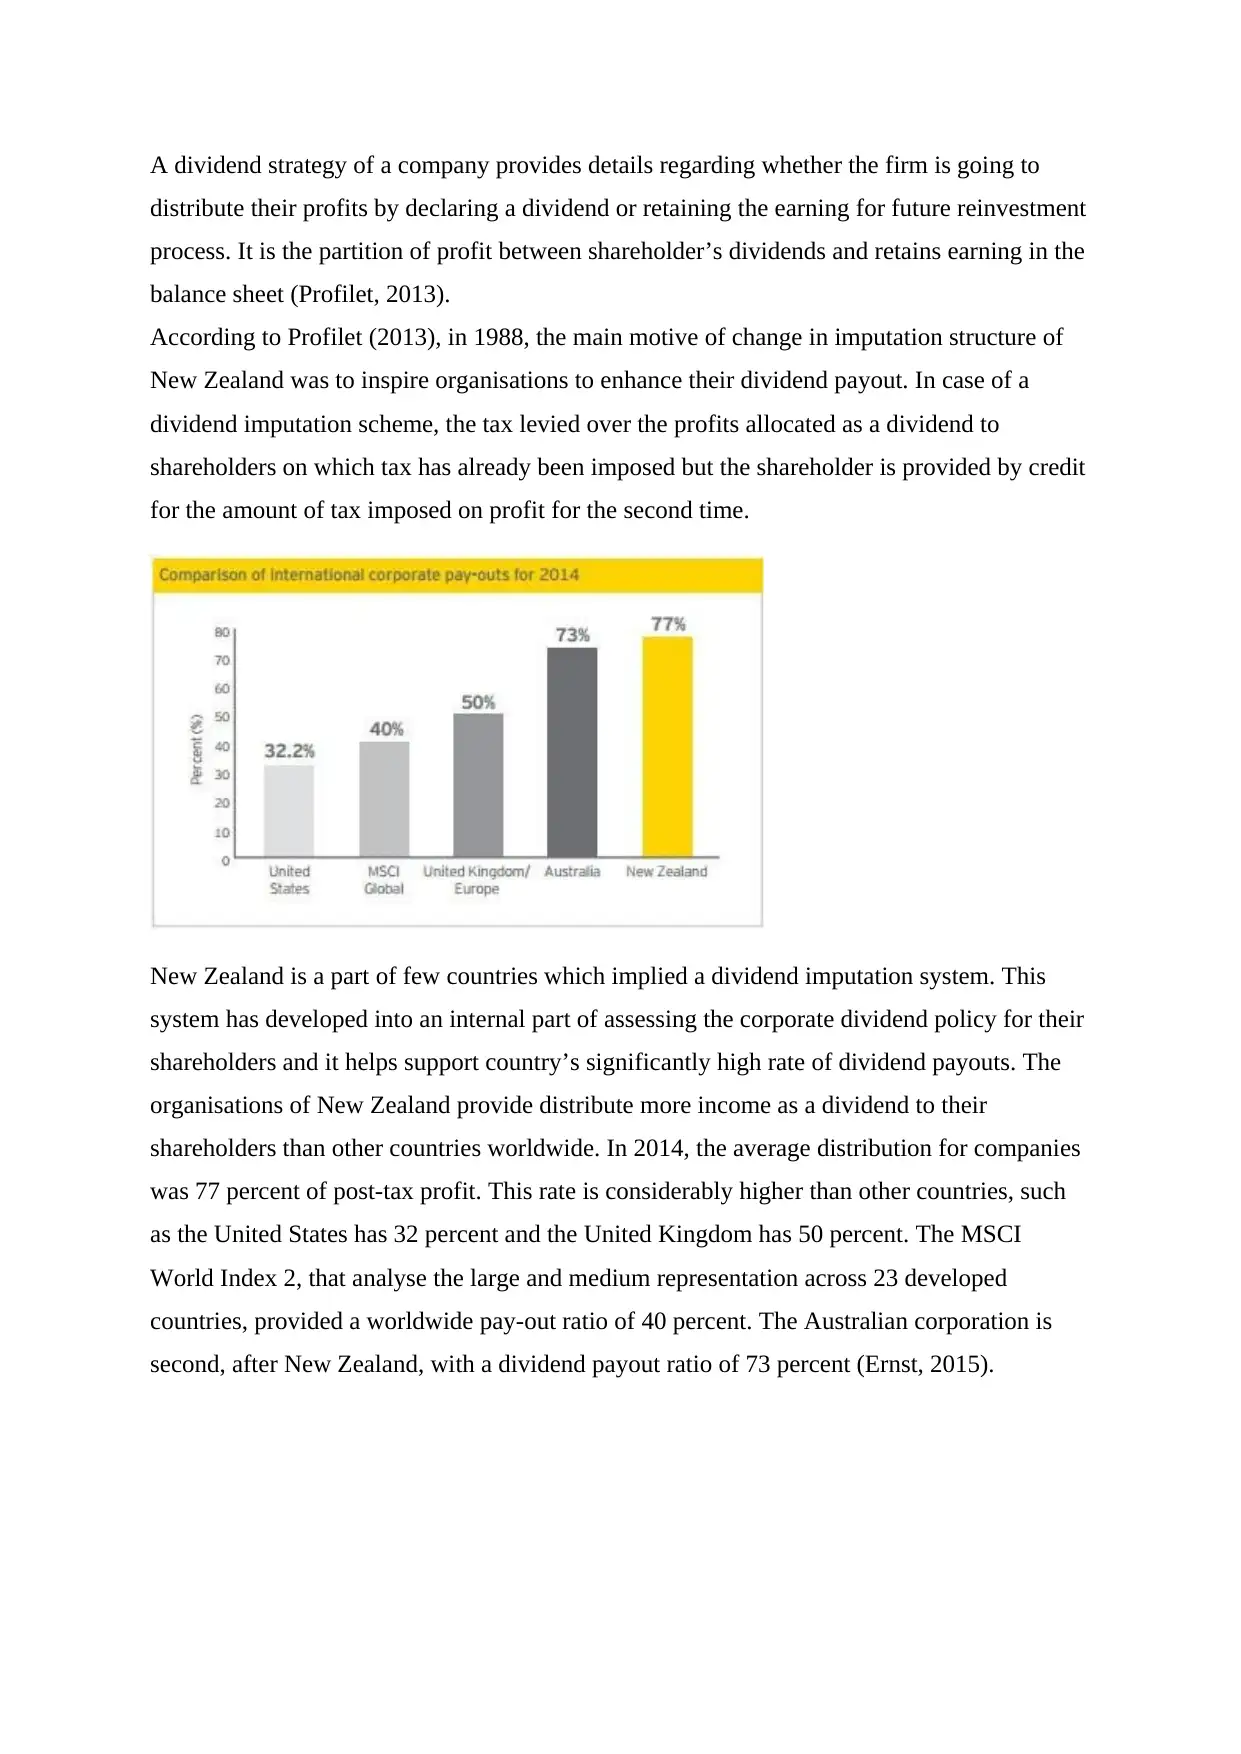
New Zealand is a part of few countries which implied a dividend imputation system. This
system has developed into an internal part of assessing the corporate dividend policy for their
shareholders and it helps support country’s significantly high rate of dividend payouts. The
organisations of New Zealand provide distribute more income as a dividend to their
shareholders than other countries worldwide. In 2014, the average distribution for companies
was 77 percent of post-tax profit. This rate is considerably higher than other countries, such
as the United States has 32 percent and the United Kingdom has 50 percent. The MSCI
World Index 2, that analyse the large and medium representation across 23 developed
countries, provided a worldwide pay-out ratio of 40 percent. The Australian corporation is
second, after New Zealand, with a dividend payout ratio of 73 percent (Ernst, 2015).
distribute their profits by declaring a dividend or retaining the earning for future reinvestment
process. It is the partition of profit between shareholder’s dividends and retains earning in the
balance sheet (Profilet, 2013).
According to Profilet (2013), in 1988, the main motive of change in imputation structure of
New Zealand was to inspire organisations to enhance their dividend payout. In case of a
dividend imputation scheme, the tax levied over the profits allocated as a dividend to
shareholders on which tax has already been imposed but the shareholder is provided by credit
for the amount of tax imposed on profit for the second time.
New Zealand is a part of few countries which implied a dividend imputation system. This
system has developed into an internal part of assessing the corporate dividend policy for their
shareholders and it helps support country’s significantly high rate of dividend payouts. The
organisations of New Zealand provide distribute more income as a dividend to their
shareholders than other countries worldwide. In 2014, the average distribution for companies
was 77 percent of post-tax profit. This rate is considerably higher than other countries, such
as the United States has 32 percent and the United Kingdom has 50 percent. The MSCI
World Index 2, that analyse the large and medium representation across 23 developed
countries, provided a worldwide pay-out ratio of 40 percent. The Australian corporation is
second, after New Zealand, with a dividend payout ratio of 73 percent (Ernst, 2015).

⊘ This is a preview!⊘
Do you want full access?
Subscribe today to unlock all pages.
Trusted by 1+ million students worldwide
1 out of 9
Related Documents


Your All-in-One AI-Powered Toolkit for Academic Success.
+13062052269
info@desklib.com
Available 24*7 on WhatsApp / Email
![[object Object]](/_next/static/media/star-bottom.7253800d.svg)
Unlock your academic potential
Copyright © 2020–2026 A2Z Services. All Rights Reserved. Developed and managed by ZUCOL.