Global Business Review: Dividend Policy in Indian Firms
VerifiedAdded on 2022/08/16
|18
|10525
|22
Report
AI Summary
This study investigates the determinants of dividend policy decisions in Indian firms, comparing standalone firms with those affiliated with business groups. The research, based on data from 781 firms listed on the National Stock Exchange (NSE) between 1995 and 2015, examines both the dividend payment decision and the dividend payout level decision. The findings reveal significant differences: standalone firms with high investment opportunities, financial leverage, and business risk are less likely to pay dividends and have lower payout levels, while business group-affiliated firms exhibit the opposite behavior, paying dividends and maintaining higher payout levels even under similar conditions. The study suggests that while business groups may create internal capital markets and mitigate market imperfections, they may also face information asymmetry challenges. The research contributes to the understanding of dividend policy in emerging markets, highlighting the influence of corporate organizational structures on financial decisions.
Article
Global Business Review
1–18
© 2018 IMI
Reprints and permissions:
in.sagepub.com/journals-permissions-india
DOI: 10.1177/0972150918803990
http://journals.sagepub.com/home/gbr
1 Senior Research Fellow (UGC), Department of Humanities and Social Science, Indian Institute of Technolo
West Bengal, India.
2 Current affiliation: School of Management, Presidency University, Bengaluru, Karnataka, India.
Corresponding author:
Nishant B. Labhane, School of Management, Presidency University, Bengaluru 560064, Karnataka, India.
E-mail: nishant.labhane@hotmail.com
Dividend Policy Decisions in India:
Standalone Versus Business
Group-Affiliated Firms
Nishant B. Labhane1, 2
Abstract
This study examines the determinants of two important dividend policy decisions specifically
payment decision and the dividend payout level decision of 781 sample Indian firms enlisted
Stock Exchange (NSE) over the period, 1995–2015, comparing the business group-affiliated fi
the standalone firms. In term of characteristics, the business group-affiliated firms are larger
profitable and more levered than the standalone firms. The empirical results suggest that the
policy decisions of business group-affiliated firms differ significantly from that of the standalo
the case of standalone firms, the firms with high investment opportunities, high financial leve
high business risk are less likely to pay dividends, and their dividend payout levels are lower.
other hand, the firms affiliated with business groups are more likely to pay dividends, and the
payout levels are higher even when they have high investment opportunities, high financial l
high business risk. Overall, the findings suggest that although the business groups are able t
internal capital markets (ICMs) and shield their member firms from market imperfections, the
suffer from other information asymmetry problems.
Keywords
Dividends, dividend policy, business groups, emerging markets, internal capital markets
Introduction
In their seminal paper, Miller and Modigliani (1961) propose that in an ideal world with no taxes, zero
transaction and agency costs and full availability of information, dividend policy is irrelevant. But in real,
the world is not ideal, and dividend policy affects the firm’s value and shareholder’s wealth. Black (1976)
coined the phrase ‘dividend puzzle’ concerning why the corporations pay dividends and why the investors
value them. Subsequently, researchers have developed several theories to explain this ‘dividend puzzle’
which include tax preference theory, agency theory, signaling theory and most recently firms’ life-cycle
Paraphrase This Document
Need a fresh take? Get an instant paraphrase of this document with our AI Paraphraser
2 Global Business Review
theory and catering theory of dividends (Aharony & Swary, 1980; Baker & Wurgler, 2004; Bhattacharya,
1979; DeAngelo, DeAngelo, & Stulz, 2006; Denis & Osobov, 2008; Easterbrook, 1984; Jensen & Meckling,
1976; Litzenberger & Ramaswamy, 1979; Rozeff, 1982). Therefore, there are several reasons for firms to
pay dividends such as to signal firms’ earnings quality, to return profits that are not required for investment
outlays to shareholders, to control free cash flow misuse by managers, and perhaps to return profits to
shareholders when capital gains are taxed higher than the dividends and so on.
In most of the emerging as well as developed capital markets, business groups are a common pheno-
menon. Business groups are the important ownership features of many private sector firms in such
capital markets. A business group is a set of companies that are bound together by inevitable formal and
informal ties and customarily take coordinated actions even if they are legally independent (Khanna &
Rivkin, 2001). Each company affiliated with particular business groups is a distinguishable legal entity
which publishes its annual financial report, has its board of directors and is responsible to its shareowners.
Leff’s (1976, 1978) market failure theory argues that the business groups are prevalent in the emerging
and developed markets due to the presence of information problems and market imperfections. Therefore,
it is important to examine the dividend policy decisions of firms affiliated with business groups vis-à-vis
standalone firms. There are around 400 business groups in India which are the representatives of the
business groups in many of the emerging markets (Khanna & Palepu, 2000a). The presence of corporate
organizational forms in India allows us to investigate the dividend policy decisions, comparing the
business group-affiliated firms with the standalone firms.
The present study examines the determinants of two important dividend policy decisions that is the
dividend payment decision (whether to pay or not to pay the dividends?) and the dividend payout level
decision (how much dividends to pay?), comparing the business group-affiliated firms with the standalone
firms from 1994–1995 to 2014–2015. We find significant differences in the determinants of dividend
policy decisions of standalone firms and business group-affiliated firms. The investment opportunities,
financial leverage and business risk affect the dividend policy decisions of standalone firms negatively;
whereas, they have significant positive impact on the dividend policy decisions of the business group-
affiliated firms.
The rest of the article is organized as follows: the second section reviews the empirical literature on a
firm’s dividend policy decisions concerning different corporate organizational forms; the third section
specifies the objectives of the study; the fourth section presents the rationale of the studies; the fifth
section describes the methodology; the sixth section discusses the analysis of the results and the last
section concludes the article.
Review of Literature
The literature on a firm’s dividend policy decisions concerning different corporate organizational forms
is not very large. Among the early studies, Dewenter and Warther (1998) find that the member
firms belonging to keiretsu group are subject to less information asymmetry and have fewer agency
problems than the independent firms in Japan during the period, 1982–1993. The managers of keiretsu
firms initiate and omit dividends more frequently than the managers of the US firms and change their
dividends more frequently than the managers of independent Japanese firms. Faccio, Lang, and Young
(2001) find that the business group-affiliated firms in Western Europe pay significantly higher dividends
than those in East Asia. The firms that are ‘tightly affiliated’ to a business group pay significantly higher
dividends through control links that constitute at least 20 per cent of the control rights. In contrast to
Labhane 3
this, the investors of the firms that are loosely affiliated with business groups (i.e., whose control
links are all above the 10% level but do not all exceed 20%) are less alert to the expropriation within
the firms, and such firms fail to pay higher dividends due to a wider discrepancy between ownership
and control.
Ferris, Sen, and Yui (2006) find that the independent firms (non-business group-affiliated firms) in
Japan are more sensitive to market forces and resemble closely to the firms operating in the USA and the
UK in paying dividends. But the industry groupings provide business protection to the keiretsu firms,
which help insulate them from the market forces and, thus, make dividends less useful as either signals
or devices to discipline managers of the firms belonging to keiretsu. Investigating the impact of the
strength of group affiliation on dividend policy, Aggarwal and Dow (2012) find that the dividends are
used to transfer cash from the weakly affiliated firms to the strongly affiliated firms for keiretsu firms,
and as the affiliation to the business group strengthens the probability of dividend payment declines.
Group equity has a positive impact while group debt has a negative impact on the decision to pay
dividends in all the firms but the most in weakly aligned firms. And as the group sales increase, the
strongly aligned firms are more likely to pay dividends; whereas, only the strength of group shareholdings
influences the dividend payment decision for the most weakly aligned firms.
Manos, Murinde, and Green (2012) find that the dividend-payout ratio of business group-affiliated
firms are higher than that of independent firms, and the dividend payment decisions of the business
group-affiliated firms are less sensitive to the dependency on external finance and life-cycle considerations
vis-à-vis non-affiliated firms. Examining whether the organization of the internal capital markets (ICMs)
can influence the dividend policy of the business group-affiliated firms, Gopalan, Nanda, and Seru
(2014) find that the business group-affiliated firms pay significantly more dividends than the standalone
firms (unaffiliated firms). Further, the responsiveness of the dividends is higher in countries with weak
legal regimes. Basu and Sen (2015) find that as the insider ownership increases, a firm affiliated with
business group pays out less dividends when sales decrease in the following year. This indicates that the
insiders act opportunistically when they retain capital even when future performance does not improve.
Examining the dividend smoothing behaviour of the sample firms in India, Labhane and Mahakud
(2018) find significant differences between the dividend smoothing behaviour of the standalone firms
and the firms affiliated with business groups. The business group-affiliated firms tend to smooth their
dividend payments more than that of the standalone firms, and the actual payout ratio as well as the target
payout ratio of the business group-affiliated firms are higher than that of the standalone firms.
After reviewing the available studies on this issue, we find at least three research gaps on the dividend
policy decisions concerning the different corporate organizational forms. First, it is true that business
groups are well researched in an emerging capital market like India (refer to Gopalan, Nanda, & Seru,
2007; Khanna & Palepu, 2000a), but they do not investigate the dividend policy decisions of business
groups, specifically. Second, previous studies do not consider the implications of most of the major
theories of dividend policy on business groups and do not consider an exhaustive list of the explanatory
variables taken from major theories of dividend policy. Third, there are around 400 business groups
in India; the business groups in India are the representatives of the business groups in many of the
emerging capital markets and few studies have examined the dividend policy decisions of the standalone
firms and the business group-affiliated firms separately in an Indian context. Therefore, it is important to
investigate the dividend policy decisions, comparing the business group-affiliated firms with the
standalone firms in India. The present study tries to fill the research gaps by investigating the dividend
policy decisions of the business group-affiliated firms vis-à-vis standalone firms in India.
⊘ This is a preview!⊘
Do you want full access?
Subscribe today to unlock all pages.
Trusted by 1+ million students worldwide
4 Global Business Review
Objectives
The objectives of this study are (a) to determine the factors affecting the dividend payment decisions
(i.e., whether to pay or not to pay the dividends?) of the standalone firms vis-à-vis business group-
affiliated firms (b) to determine the factors affecting the dividend payout level decisions (i.e., how much
dividends to pay?) of the standalone firms vis-à-vis business group-affiliated firms.
Rationale of the Studies
In the global financial activities, the markets of countries other than the developed nations started to play
crucial roles continually since 1980. To refer these sets of developing countries’ markets, the International
Finance Corporation have framed the term ‘emerging financial markets’ (EFMs) in 1981. According to
Beim and Calomiris (2001, p. x), the EFMs underwent ‘some 50 experiments in privatizing economies
and building financial systems, none perfect, with different emphases and different problems’. While
setting the corporate dividend payout policies, the managers of EFM firms face several unique factors
that may differ considerably from the traditional determinants of dividend policies of the firms in
developed financial markets (DFMs). Thus, much research remains on EFMs. It has been found that the
firm’s dividend policy has greater implications for the firm’s performance such as profitability, stock
market returns and so on. (Maitra & Dey, 2012; Saravanakumar, 2011).
The EFMs differ from DFMs in many ways: first, there are legal constraints on the amount of
dividends that may or must be distributed to stockholders in EFMs; second, the EFMs have undergone
privatization and liberalization of capital accounts in the last two decades that affected dividend policy
decisions whereas DFMs were liberalized long back (Beim & Calomiris, 2001); third, EFMs are exposed
to more macroeconomic volatility than DFMs; certainly many EFMs have directly or indirectly
experienced one or more financial crises in the last two decades (Beim & Calomiris, 2001). Therefore,
it is important to examine the dividend policy decisions of the companies in EFMs too.
Methodology
Data Source
The empirical study is primarily based on the data collected from the Prowess database maintained by
the Centre for Monitoring Indian Economy (CMIE) which is a leading business and economic database
and research company in India. The reason to select the sample companies from National Stock Exchange
(NSE) is that it is mandatory for all the companies listed on NSE to follow the financial reporting and
regulatory norms set by Securities and Exchange Board of India. Another, reason is that NSE was
established on the eve of the implementation of a new economic policy in India.
Sample Frame
The period of the study is from 1995 to 2015 (i.e., from the financial year [FY] 1994–1995 to FY 2014–
2015). The main reasons to select this time period as a period of study are as follows: first, this time
period refers to the period of liberalization, privatization and globalization in India and second during
Paraphrase This Document
Need a fresh take? Get an instant paraphrase of this document with our AI Paraphraser
Labhane 5
this time period maximum possible information is available for the sample companies in the database.
The Government of India considers its FY from 1 April midnight to 31 March midnight. Henceforth, FY
1994–1995 will be referred to as 1995 and accordingly FY 2014–2015 as 2015. The present study also
examines the dividend policy decisions of the sample Indian firms during 1995–2003 and 2004–2015
which refers to the post-liberalization period and the period of the second-generation reforms in India,
respectively.
Initially, the empirical study targets all the companies enlisted on NSE which is a leading stock
exchange in India. Presently, 1,730 companies are enlisted on NSE, out of which 179 are financial
services companies, 28 belong to the utilities sector and 35 are public sector undertaking companies.
Following the sample selection procedure by Fama and French (2001), we exclude the financial services
and the utilities sector companies from the sample as the accounting practices and the regulatory norms
followed by these companies are different as compared to the other non-financial services and non-
utilities sector companies. Public sector undertaking companies are excluded from the sample as their
dividend policy decisions are highly influenced by the government financial considerations and social
obligations (Singhania, 2005). Out of the remaining 1,488 non-financial services, non-utilities sector and
non-public sector firms, we obtain maximum financial information for 781 sample companies during the
entire period of study. Hence, our final sample for empirical study consists of 781 companies. The 781
sample companies consist of 493 business group-affiliated firms and 288 standalone firms. A business
group is an organizational structure consisting of legally independent firms that are bound to each other
by formal or informal ties and are expected to take coordinated actions; whereas, the standalone firms
are the firms which are not affiliated to any business groups (Khanna & Rivkin, 2001).
Empirical Model
Determinants of Dividend Policy Decisions
1. Investment opportunities (INVT): Myers (1984) and Myers and Majluf (1984) argue that
the firms choose to finance their positive NPV (Net Present Value) project outlays through
cheaper internally generated retained earnings instead of raising costly external finance from the
capital markets. Therefore, the firms facing higher investment opportunities and, thereby, higher
fund requirements will pay lower dividends to investors in order to reduce dependence on costly
external finance raised from the capital markets. In this case, we expect an inverse relationship
of investment opportunities with the dividend payment decision and the payout level decision.
Market-to-book ratio is used as a proxy for investment opportunities, and it is defined as the
market value of equity divided by the book value of equity.
2. Financial leverage (LEV): When firms borrow capital from debt finance, they commit
themselves to the payment of fixed interest charges which includes interest and principal amount,
and failure to meet these obligations may result the firms to face the risk of liquidation and
bankruptcy. Therefore, we expect negative relationship of financial leverage with the dividend
payment decision and the payout level decision. Financial leverage is proxied by the debt-to-
capital ratio which is measured as the ratio of total debt to the total capital employed.
3. Free cash flow (FCF): The agency problem arises between the principal owner (shareholders)
and the agent (managers) when managers take actions in their own self-interest such as they may
expend richly on perk, overinvest in negative NPV projects or enlarge the firm’s size beyond its
optimal capacity and so on. The distribution of dividends to shareholders will reduce excess
6 Global Business Review
amount of FCF in the hands of managers, thereby reducing the agency problem (Easterbrook,
1984; Jensen & Meckling, 1976; Rozeff, 1982). Therefore, we expect direct relationship of FCF
with the dividend payment decision and the payout level decision. The FCF is measured as the
earnings before interest, taxes, depreciation and amortization less capital expenditures, or net
operating cash flow, divided by total assets.
4. Tangibility of assets (TANG): The agency problem may also arise between the bondholders
and shareholders. The firms having high proportion of tangible or collateralizable assets will
ensure higher level of protection to bondholders, thereby reducing the conflicts between the
bondholders and shareholders (Titman & Wessels, 1998). Therefore, we expect a positive
relationship of asset tangibility with dividend payment decision and the payout level decision,
and the tangibility of assets is measured as the net fixed assets divided by the total assets.
5. Business risk (BR): The managers can signal a firm’s current condition and future prospects
to outside investors in the form of dividend payment and, thus, reduce information asymmetry
between insiders and outsiders (Aharony & Swary, 1980; Asquith & Mullins, 1983; Bhattacharya,
1979). The business risk is regarded as uncertainty about the firm’s current and future earnings
and the expected relationship between the firms’ current and future earnings become more
uncertain when the business risk is higher. Thus, we expect an inverse relationship of business
risk with the dividend payment decision and the payout level decision. The business risk is
measured as the standard deviation of first difference of operating income divided by the total
assets.
6. Life cycle (LC): The life-cycle theory as proposed by Mueller (1972) entails that any firm has
a well-defined life-cycle, and the firm’s dividend payment decision varies across different life-
cycle stages of the firm. The mature firms have fewer investment opportunities, more accumulated
earnings and less systematic risk and, thus, pay more dividends to investors (DeAngelo et al.,
2006; Denis & Osobov, 2008; Grullon, Michaely, & Swaminathan, 2002). In contrast to this,
younger firms comparatively have more investment opportunities, low profits and substantial
hurdles in raising external finance to meet their investment outlays which causes them to conserve
internally generated cash and to pay less or no dividend. Therefore, we expect direct relationship
of life-cycle stage with the dividend payment decision and the payout level decision. The earned-
to-contributed equity mix is used as a proxy for the life-cycle stage, and it is defined as the ratio
of the retained earnings to the total equity.
7. Firm’s size (SIZE): Higgins (1972) find evidence that larger firms are less dependent on
internal funds as they have advantage in raising external funds from the capital markets.
Furthermore, larger firms are more difficult to monitor which increases agency problem between
the managers and the shareholders. In this case, the larger firms are more likely to pay dividends.
Therefore, we expect direct relationship of a firm’s size with the dividend payment decision and
the payout level decision. The firm’s size is measured as the natural logarithm of market
capitalization.
8. Profitability (PROF): As dividends are paid directly from net profit after tax, it is logical to
consider profitability as an important factor affecting firm’s decision to pay the dividends. In a
survey, Lintner (1956) finds evidence that the key factor affecting a firm’s dividend payment
decision is the net earnings. Further, Fama and French (2001) find a significant positive
relationship between dividend payment decision and the firm-specific characteristics such as
profitability. The profitability is proxied by return on assets which is measured as earnings before
interest and taxes divided by the total assets, and we expect a direct association of profitability
with dividend payment decision and the payout level decision.
⊘ This is a preview!⊘
Do you want full access?
Subscribe today to unlock all pages.
Trusted by 1+ million students worldwide
Labhane 7
9. Firm’s liquidity position (LIQ): Ho (2003) finds evidence that the liquidity position of firms
affects their dividend payment decision directly. The distribution of dividends to the investors by
a firm implies outflow of cash for a firm. A firm may have enough profit to announce dividends
but not enough cash in hand to pay dividend. Therefore, we expect direct relationship of liquidity
position of a firm with the dividend payment decision and the payout level decision. The liquidity
position is proxied by current ratio which is defined as the ratio of the current assets to the current
liabilities.
Model Specification
In order to examine how the relationship of dividend policy decisions varies between the standalone and
business group-affiliated firms, we apply regression analysis procedures. A binary logit regression
analysis is utilized to analyse the dividend payment decisions that is whether to pay or not to pay the
dividend. To study the dividend payout level decision that is how much dividends to pay, we utilize a
tobit regression analysis which is also known as the censored regression analysis.
To examine how the relationship of the dividend payment decision (whether to pay or not to pay the
dividends?) and the payout level decision (how much dividends to pay?) with the explanatory variables
differ between the corporate organizational forms, we estimate the following basic dividend policy
model for the standalone firms (288 sample firms) and the business group-affiliated firms (493 sample
firms), separately.
Y INVT LEV FCF TANG BR
LC SIZE PROF LIQ
, 1 1 , 2 , 3 4 , 5 ,
6 , 7 , 8 , 9 , ,i t
i t i t i t i t i t
i t i t i t i t
i, ta b b b b b
b b b b f
= + + + + + +
+ + + + (1)
where Yi,t is a binary or dichotomous variable used for the logit regression analysis which is set to one
when the firm i pay dividend in the year t and zero otherwise, or Yi,t is a firm’s dividend-payout ratio used
for the censored or tobit regression analysis which takes the actual value of dividend-payout ratio when
the firm i pay dividend in the year t and zero otherwise. And the dividend-payout ratio is defined as the
ratio of the annual dividend paid per share to the earnings per share, INVTi,t is the investment opportunity
measured as market-to-book ratio for the firm i in the period t; LEV i,t is the leverage ratio measured as
debt-to-capital ratio for the firm i in the period t; FCF i,t is FCF measured as the net operating cash flow
scaled by the total assets; TANGi,t is the asset tangibility measured as the ratio of the net fixed assets to
the total assets for the firm i in the period t; BRi,t is the standard deviation of first difference of operating
income divided by the total assets for the firm i in the period t; LC i,t is the life-cycle variable measured
as the ratio between retained earnings to total equity for the firm i in the period t; SIZE i,t is the size
variable measured as the natural log of market capitalization for the firm i in the period t; PROFi,t is the
profitability variable measured as return on assets that is earnings before interest and taxes divided by
the total assets for the firm i in the period t, LIQi,t is the firm’s liquidity variable measured as current ratio
that is the current assets divided by the current liabilities for the firm i in the period t; α1 is a constant; βs
are the slope coefficients and εi,t is the error term for the firm i in the period t.
The dividend payment decision is regarding the likelihood that a firm pays the dividend. While
considering the dividend payment decision, firms have two alternatives such as either to pay or not to
pay the dividend. In India, many firms do not pay the dividend, and even those who pay dividends do not
pay them continuously. Therefore, the dependent variable that is dividend-payout ratio takes two
outcomes, and it is set 1 when a firm pays the dividend in the year t and zero otherwise. Following Fama
and French (2001) and several other subsequent studies such as Aggarwal and Dow (2012) and Manos
et al. (2012), we apply logit regression model to analyse the role of firm-specific characteristics in
Paraphrase This Document
Need a fresh take? Get an instant paraphrase of this document with our AI Paraphraser
8 Global Business Review
explaining the likelihood of firms paying dividends. To estimate parameters in the logit regression model
the maximum likelihood estimation method is utilized. The estimation takes the following general
structure (refer Gujarati, 2012):
( /1 )lnL P P Z X ui i i ii i b= - = = + (2)
where Pi is the probability of paying dividends, 1 − Pi is the probability of not paying dividends, Li is a
log of the odds ratio, and it is linear in X i and parameters. In the logit regression results, we report the
coefficients as the value of the log of odds ratio and the value of marginal effects (dy/dx) which shows
the rate of change in the probability of paying dividends with respect to a unit change in one explanatory
variable holding all the other explanatory variables constant.
The dividend payout level decision is regarding how much dividend firms pay out of their total
earnings. In our sample in a given year, some firms pay dividends whereas others do not that is they pay
zero dividends. Therefore, the information for dividend-payout ratio of the firms that pay zero dividends
in a given year t is not available. Such a sample in which information on the dependent variable is
available only for some observations is known as a censored sample. The tobit model which is also
known as a censored regression model is an appropriate model to analyse the dividend payout level
decision (i.e., how much dividends to pay). Some authors refer tobit model as limited-dependent variable
regression model due to the restriction put on the values taken by the dependent variable. The tobit model
can be expressed statistically in the following way (refer to Gujarati, 2012):
0
Y X u if RHS 0
otherwise
1 2i i i 2b b= + +
= (3)
where Yi is the dividend-payout ratio, β1 is a constant, β2 is a slope coefficient, ui is error term and
RHS stands for the right-hand side.
Analysis
Sample Characteristics
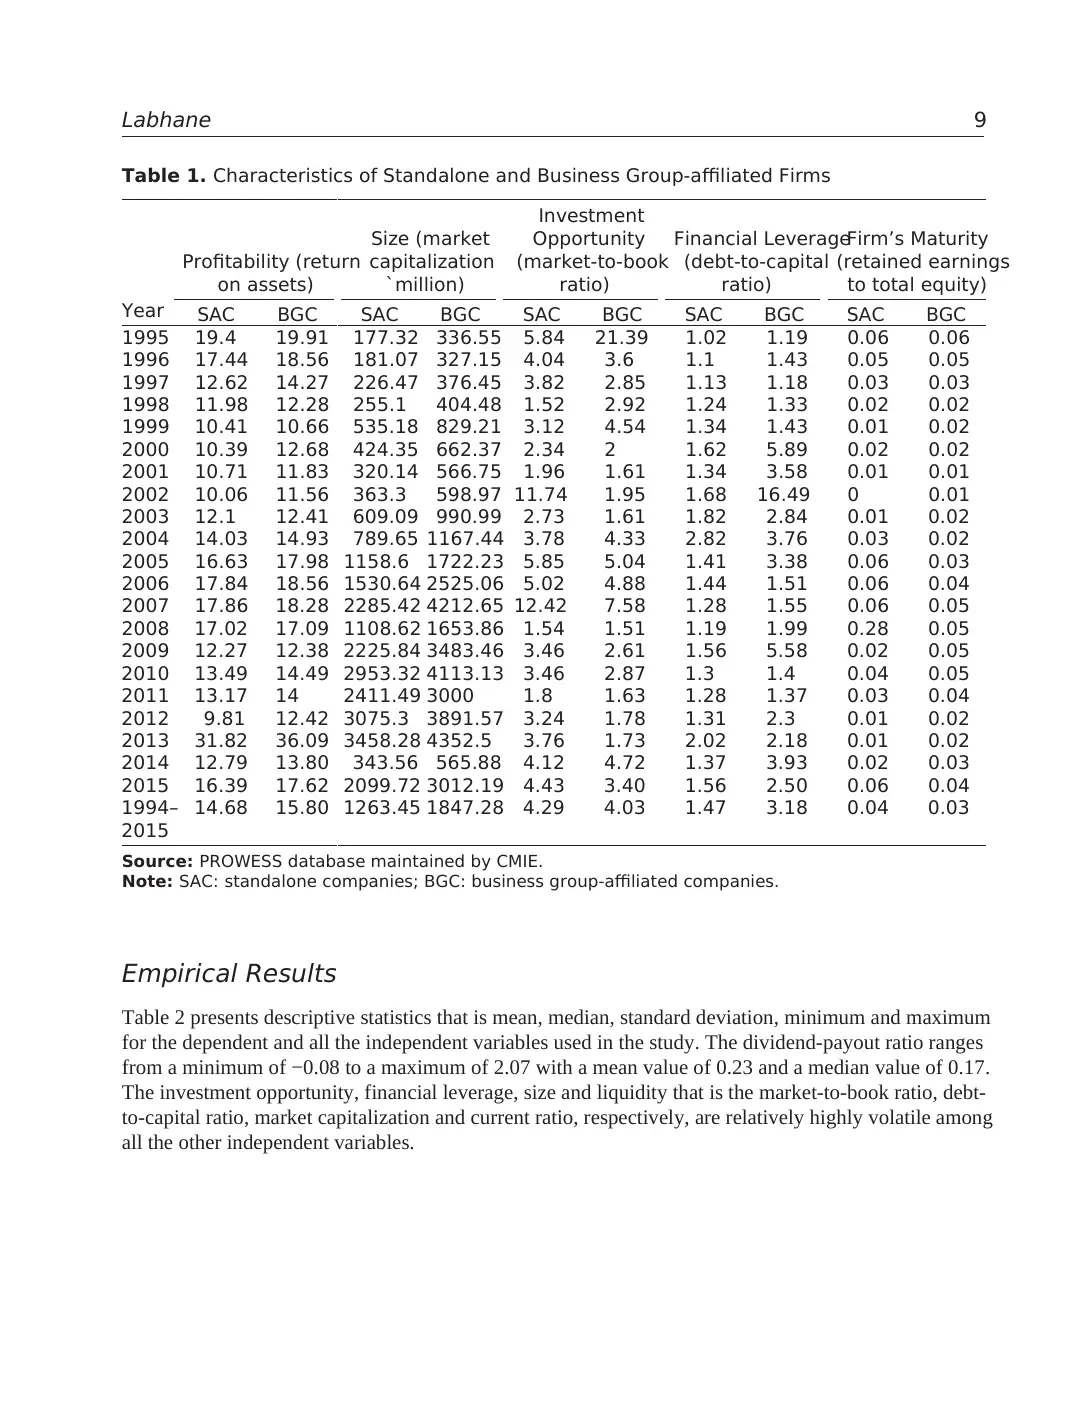
Table 1 indicates that business group-affiliated firms are larger, more profitable and more levered than
the standalone firms during the entire period of study, 1995–2015. The average market capitalization of
the business group-affiliated firms is 1.5 times larger than the standalone firms. This result is consistent
with the findings of Claessens, Fan, and Lang (2006) who found that the business group-affiliated firms
are larger than the independent firms in East Asia. In a case of profitability, the results are consistent with
the finding of Chang and Choi (1988) and Khanna and Palepu (2000a, 2000b) and with the prediction
that the group membership is associated with the superior profitability of member firms. For the financial
leverage, the results are in line with that of Manos, Murinde, and Green (2007) who found a significant
difference in the debt ratio of group and non-group firms, where the business group-affiliated firms are
highly levered relative to the standalone firms.
explaining the likelihood of firms paying dividends. To estimate parameters in the logit regression model
the maximum likelihood estimation method is utilized. The estimation takes the following general
structure (refer Gujarati, 2012):
( /1 )lnL P P Z X ui i i ii i b= - = = + (2)
where Pi is the probability of paying dividends, 1 − Pi is the probability of not paying dividends, Li is a
log of the odds ratio, and it is linear in X i and parameters. In the logit regression results, we report the
coefficients as the value of the log of odds ratio and the value of marginal effects (dy/dx) which shows
the rate of change in the probability of paying dividends with respect to a unit change in one explanatory
variable holding all the other explanatory variables constant.
The dividend payout level decision is regarding how much dividend firms pay out of their total
earnings. In our sample in a given year, some firms pay dividends whereas others do not that is they pay
zero dividends. Therefore, the information for dividend-payout ratio of the firms that pay zero dividends
in a given year t is not available. Such a sample in which information on the dependent variable is
available only for some observations is known as a censored sample. The tobit model which is also
known as a censored regression model is an appropriate model to analyse the dividend payout level
decision (i.e., how much dividends to pay). Some authors refer tobit model as limited-dependent variable
regression model due to the restriction put on the values taken by the dependent variable. The tobit model
can be expressed statistically in the following way (refer to Gujarati, 2012):
0
Y X u if RHS 0
otherwise
1 2i i i 2b b= + +
= (3)
where Yi is the dividend-payout ratio, β1 is a constant, β2 is a slope coefficient, ui is error term and
RHS stands for the right-hand side.
Analysis
Sample Characteristics
Table 1 indicates that business group-affiliated firms are larger, more profitable and more levered than
the standalone firms during the entire period of study, 1995–2015. The average market capitalization of
the business group-affiliated firms is 1.5 times larger than the standalone firms. This result is consistent
with the findings of Claessens, Fan, and Lang (2006) who found that the business group-affiliated firms
are larger than the independent firms in East Asia. In a case of profitability, the results are consistent with
the finding of Chang and Choi (1988) and Khanna and Palepu (2000a, 2000b) and with the prediction
that the group membership is associated with the superior profitability of member firms. For the financial
leverage, the results are in line with that of Manos, Murinde, and Green (2007) who found a significant
difference in the debt ratio of group and non-group firms, where the business group-affiliated firms are
highly levered relative to the standalone firms.
Labhane 9
Empirical Results
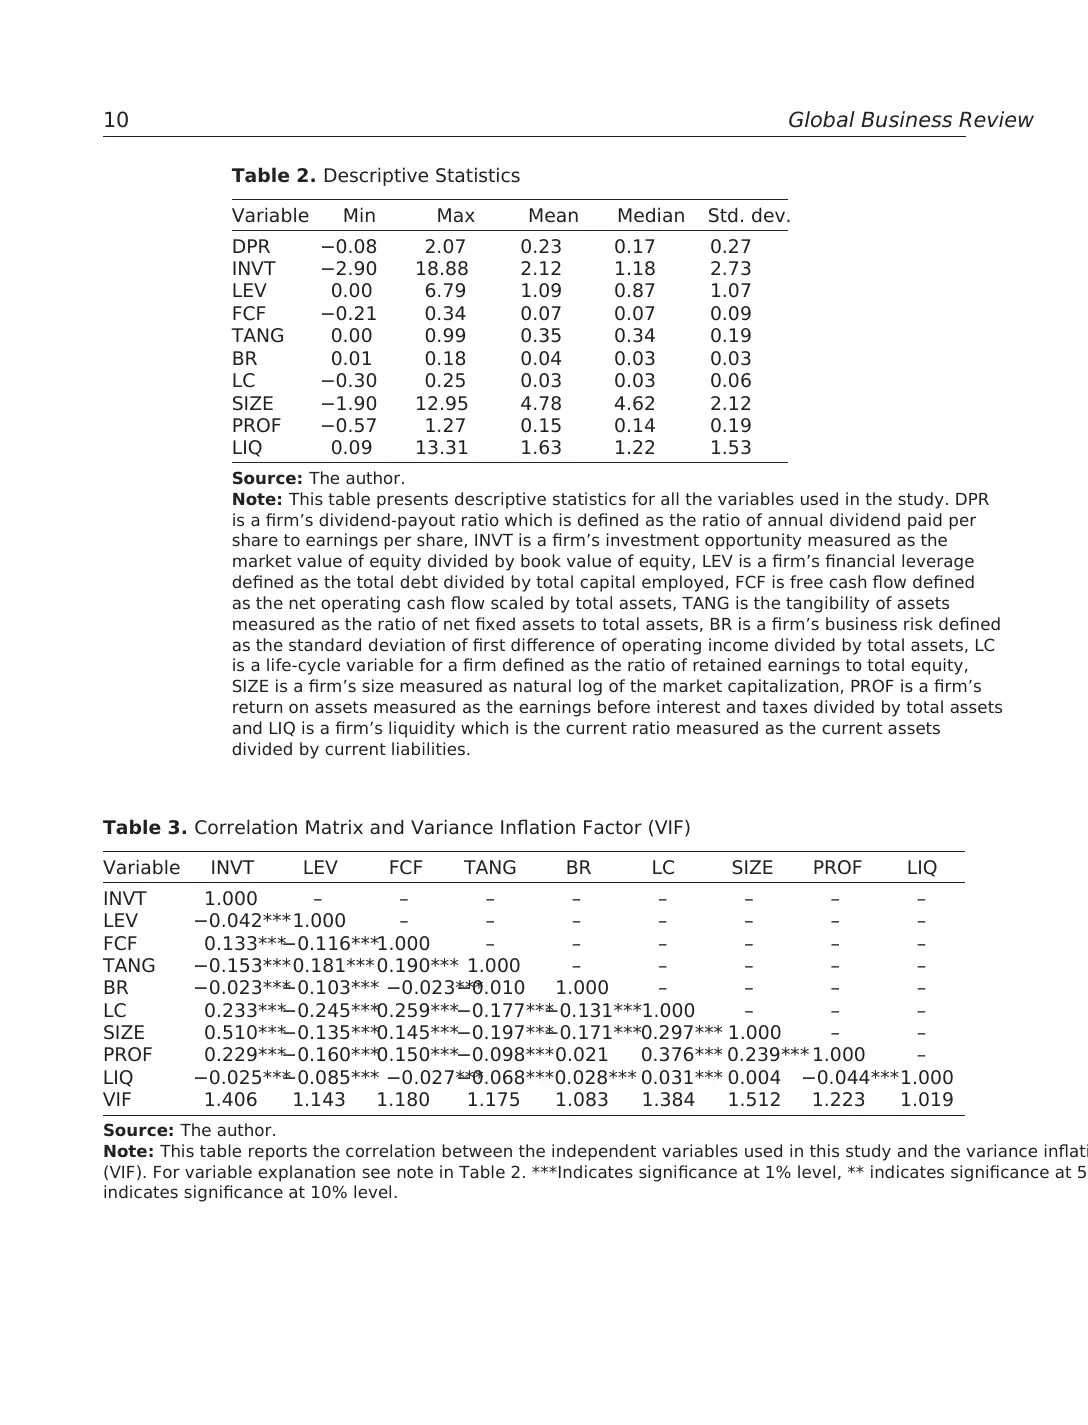
Table 2 presents descriptive statistics that is mean, median, standard deviation, minimum and maximum
for the dependent and all the independent variables used in the study. The dividend-payout ratio ranges
from a minimum of −0.08 to a maximum of 2.07 with a mean value of 0.23 and a median value of 0.17.
The investment opportunity, financial leverage, size and liquidity that is the market-to-book ratio, debt-
to-capital ratio, market capitalization and current ratio, respectively, are relatively highly volatile among
all the other independent variables.
Table 1. Characteristics of Standalone and Business Group-affiliated Firms
Year
Profitability (return
on assets)
Size (market
capitalization
`million)
Investment
Opportunity
(market-to-book
ratio)
Financial Leverage
(debt-to-capital
ratio)
Firm’s Maturity
(retained earnings
to total equity)
SAC BGC SAC BGC SAC BGC SAC BGC SAC BGC
1995 19.4 19.91 177.32 336.55 5.84 21.39 1.02 1.19 0.06 0.06
1996 17.44 18.56 181.07 327.15 4.04 3.6 1.1 1.43 0.05 0.05
1997 12.62 14.27 226.47 376.45 3.82 2.85 1.13 1.18 0.03 0.03
1998 11.98 12.28 255.1 404.48 1.52 2.92 1.24 1.33 0.02 0.02
1999 10.41 10.66 535.18 829.21 3.12 4.54 1.34 1.43 0.01 0.02
2000 10.39 12.68 424.35 662.37 2.34 2 1.62 5.89 0.02 0.02
2001 10.71 11.83 320.14 566.75 1.96 1.61 1.34 3.58 0.01 0.01
2002 10.06 11.56 363.3 598.97 11.74 1.95 1.68 16.49 0 0.01
2003 12.1 12.41 609.09 990.99 2.73 1.61 1.82 2.84 0.01 0.02
2004 14.03 14.93 789.65 1167.44 3.78 4.33 2.82 3.76 0.03 0.02
2005 16.63 17.98 1158.6 1722.23 5.85 5.04 1.41 3.38 0.06 0.03
2006 17.84 18.56 1530.64 2525.06 5.02 4.88 1.44 1.51 0.06 0.04
2007 17.86 18.28 2285.42 4212.65 12.42 7.58 1.28 1.55 0.06 0.05
2008 17.02 17.09 1108.62 1653.86 1.54 1.51 1.19 1.99 0.28 0.05
2009 12.27 12.38 2225.84 3483.46 3.46 2.61 1.56 5.58 0.02 0.05
2010 13.49 14.49 2953.32 4113.13 3.46 2.87 1.3 1.4 0.04 0.05
2011 13.17 14 2411.49 3000 1.8 1.63 1.28 1.37 0.03 0.04
2012 9.81 12.42 3075.3 3891.57 3.24 1.78 1.31 2.3 0.01 0.02
2013 31.82 36.09 3458.28 4352.5 3.76 1.73 2.02 2.18 0.01 0.02
2014 12.79 13.80 343.56 565.88 4.12 4.72 1.37 3.93 0.02 0.03
2015 16.39 17.62 2099.72 3012.19 4.43 3.40 1.56 2.50 0.06 0.04
1994–
2015
14.68 15.80 1263.45 1847.28 4.29 4.03 1.47 3.18 0.04 0.03
Source: PROWESS database maintained by CMIE.
Note: SAC: standalone companies; BGC: business group-affiliated companies.
Empirical Results
Table 2 presents descriptive statistics that is mean, median, standard deviation, minimum and maximum
for the dependent and all the independent variables used in the study. The dividend-payout ratio ranges
from a minimum of −0.08 to a maximum of 2.07 with a mean value of 0.23 and a median value of 0.17.
The investment opportunity, financial leverage, size and liquidity that is the market-to-book ratio, debt-
to-capital ratio, market capitalization and current ratio, respectively, are relatively highly volatile among
all the other independent variables.
Table 1. Characteristics of Standalone and Business Group-affiliated Firms
Year
Profitability (return
on assets)
Size (market
capitalization
`million)
Investment
Opportunity
(market-to-book
ratio)
Financial Leverage
(debt-to-capital
ratio)
Firm’s Maturity
(retained earnings
to total equity)
SAC BGC SAC BGC SAC BGC SAC BGC SAC BGC
1995 19.4 19.91 177.32 336.55 5.84 21.39 1.02 1.19 0.06 0.06
1996 17.44 18.56 181.07 327.15 4.04 3.6 1.1 1.43 0.05 0.05
1997 12.62 14.27 226.47 376.45 3.82 2.85 1.13 1.18 0.03 0.03
1998 11.98 12.28 255.1 404.48 1.52 2.92 1.24 1.33 0.02 0.02
1999 10.41 10.66 535.18 829.21 3.12 4.54 1.34 1.43 0.01 0.02
2000 10.39 12.68 424.35 662.37 2.34 2 1.62 5.89 0.02 0.02
2001 10.71 11.83 320.14 566.75 1.96 1.61 1.34 3.58 0.01 0.01
2002 10.06 11.56 363.3 598.97 11.74 1.95 1.68 16.49 0 0.01
2003 12.1 12.41 609.09 990.99 2.73 1.61 1.82 2.84 0.01 0.02
2004 14.03 14.93 789.65 1167.44 3.78 4.33 2.82 3.76 0.03 0.02
2005 16.63 17.98 1158.6 1722.23 5.85 5.04 1.41 3.38 0.06 0.03
2006 17.84 18.56 1530.64 2525.06 5.02 4.88 1.44 1.51 0.06 0.04
2007 17.86 18.28 2285.42 4212.65 12.42 7.58 1.28 1.55 0.06 0.05
2008 17.02 17.09 1108.62 1653.86 1.54 1.51 1.19 1.99 0.28 0.05
2009 12.27 12.38 2225.84 3483.46 3.46 2.61 1.56 5.58 0.02 0.05
2010 13.49 14.49 2953.32 4113.13 3.46 2.87 1.3 1.4 0.04 0.05
2011 13.17 14 2411.49 3000 1.8 1.63 1.28 1.37 0.03 0.04
2012 9.81 12.42 3075.3 3891.57 3.24 1.78 1.31 2.3 0.01 0.02
2013 31.82 36.09 3458.28 4352.5 3.76 1.73 2.02 2.18 0.01 0.02
2014 12.79 13.80 343.56 565.88 4.12 4.72 1.37 3.93 0.02 0.03
2015 16.39 17.62 2099.72 3012.19 4.43 3.40 1.56 2.50 0.06 0.04
1994–
2015
14.68 15.80 1263.45 1847.28 4.29 4.03 1.47 3.18 0.04 0.03
Source: PROWESS database maintained by CMIE.
Note: SAC: standalone companies; BGC: business group-affiliated companies.
⊘ This is a preview!⊘
Do you want full access?
Subscribe today to unlock all pages.
Trusted by 1+ million students worldwide
10 Global Business Review
Table 2. Descriptive Statistics
Variable Min Max Mean Median Std. dev.
DPR −0.08 2.07 0.23 0.17 0.27
INVT −2.90 18.88 2.12 1.18 2.73
LEV 0.00 6.79 1.09 0.87 1.07
FCF −0.21 0.34 0.07 0.07 0.09
TANG 0.00 0.99 0.35 0.34 0.19
BR 0.01 0.18 0.04 0.03 0.03
LC −0.30 0.25 0.03 0.03 0.06
SIZE −1.90 12.95 4.78 4.62 2.12
PROF −0.57 1.27 0.15 0.14 0.19
LIQ 0.09 13.31 1.63 1.22 1.53
Source: The author.
Note: This table presents descriptive statistics for all the variables used in the study. DPR
is a firm’s dividend-payout ratio which is defined as the ratio of annual dividend paid per
share to earnings per share, INVT is a firm’s investment opportunity measured as the
market value of equity divided by book value of equity, LEV is a firm’s financial leverage
defined as the total debt divided by total capital employed, FCF is free cash flow defined
as the net operating cash flow scaled by total assets, TANG is the tangibility of assets
measured as the ratio of net fixed assets to total assets, BR is a firm’s business risk defined
as the standard deviation of first difference of operating income divided by total assets, LC
is a life-cycle variable for a firm defined as the ratio of retained earnings to total equity,
SIZE is a firm’s size measured as natural log of the market capitalization, PROF is a firm’s
return on assets measured as the earnings before interest and taxes divided by total assets
and LIQ is a firm’s liquidity which is the current ratio measured as the current assets
divided by current liabilities.
Table 3. Correlation Matrix and Variance Inflation Factor (VIF)
Variable INVT LEV FCF TANG BR LC SIZE PROF LIQ
INVT 1.000 – – – – – – – –
LEV −0.042***1.000 – – – – – – –
FCF 0.133***−0.116***1.000 – – – – – –
TANG −0.153***0.181***0.190*** 1.000 – – – – –
BR −0.023***−0.103*** −0.023***−0.010 1.000 – – – –
LC 0.233***−0.245***0.259***−0.177***−0.131***1.000 – – –
SIZE 0.510***−0.135***0.145***−0.197***−0.171***0.297*** 1.000 – –
PROF 0.229***−0.160***0.150***−0.098***0.021 0.376*** 0.239*** 1.000 –
LIQ −0.025***−0.085*** −0.027***−0.068***0.028*** 0.031*** 0.004 −0.044***1.000
VIF 1.406 1.143 1.180 1.175 1.083 1.384 1.512 1.223 1.019
Source: The author.
Note: This table reports the correlation between the independent variables used in this study and the variance inflati
(VIF). For variable explanation see note in Table 2. ***Indicates significance at 1% level, ** indicates significance at 5
indicates significance at 10% level.
Paraphrase This Document
Need a fresh take? Get an instant paraphrase of this document with our AI Paraphraser
Labhane 11
Table 3 represents the correlation between the independent variables taken from the different dividend
policy theories and VIF. Although the correlation coefficients between some of the independent variables
are significant, it is either of low degree or moderate degree, suggesting an absence of multicollinearity.
Also, the estimated value of VIF for all the independent variables are very small (i.e., much less than 5,
the rule of thumb) indicating an absence of multicollinearity problem between the independent variables.
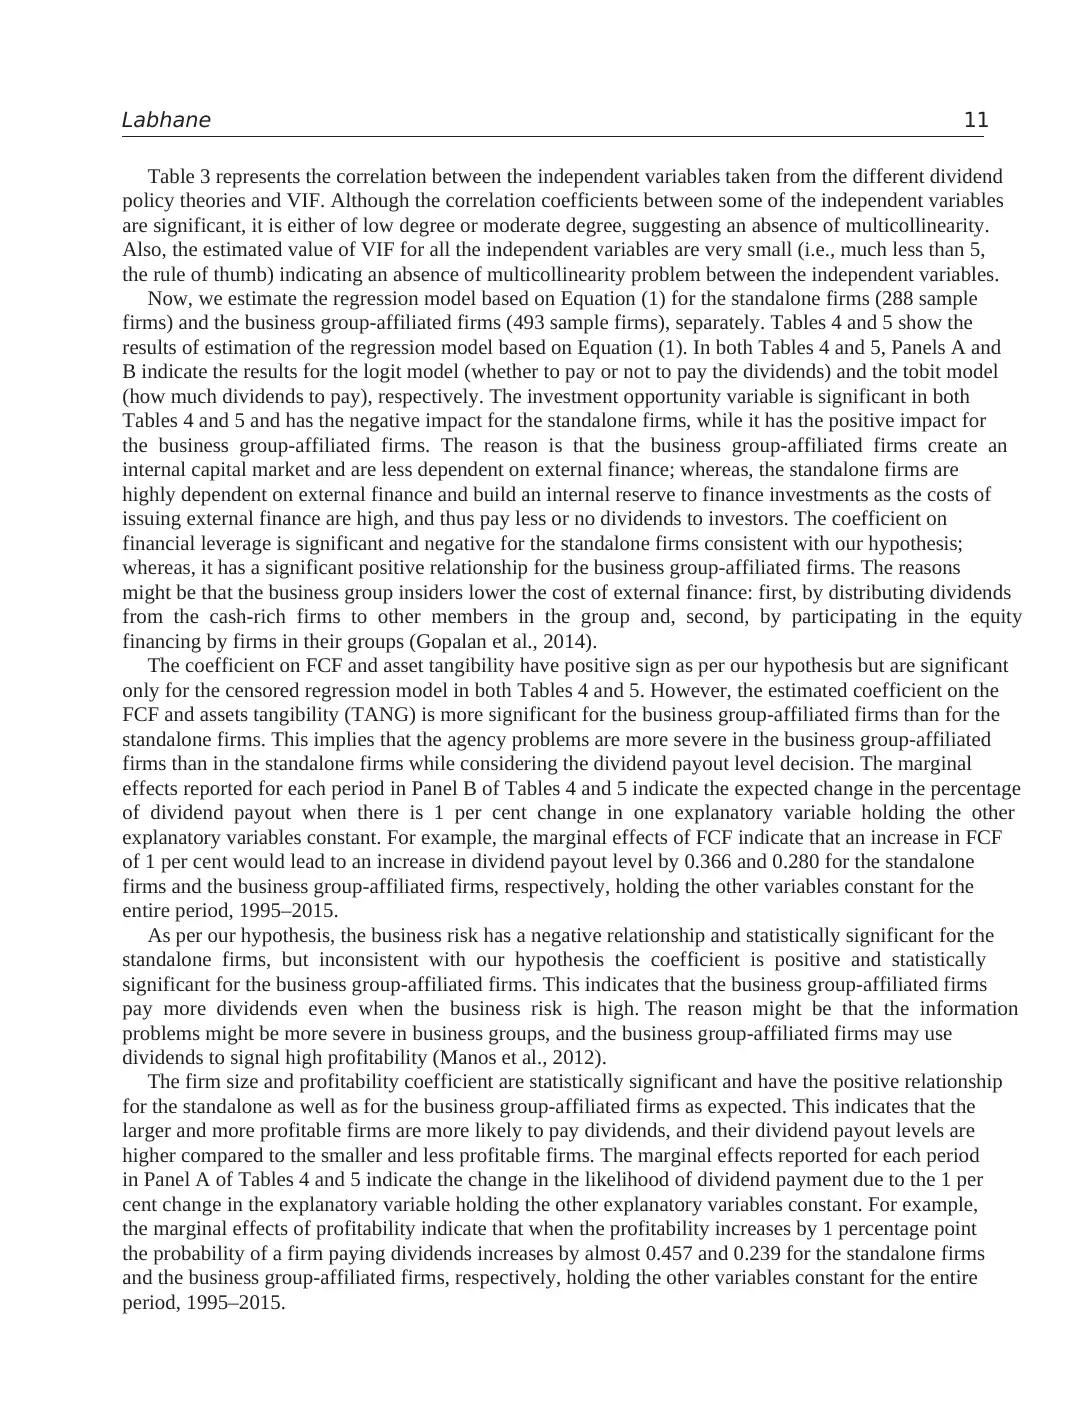
Now, we estimate the regression model based on Equation (1) for the standalone firms (288 sample
firms) and the business group-affiliated firms (493 sample firms), separately. Tables 4 and 5 show the
results of estimation of the regression model based on Equation (1). In both Tables 4 and 5, Panels A and
B indicate the results for the logit model (whether to pay or not to pay the dividends) and the tobit model
(how much dividends to pay), respectively. The investment opportunity variable is significant in both
Tables 4 and 5 and has the negative impact for the standalone firms, while it has the positive impact for
the business group-affiliated firms. The reason is that the business group-affiliated firms create an
internal capital market and are less dependent on external finance; whereas, the standalone firms are
highly dependent on external finance and build an internal reserve to finance investments as the costs of
issuing external finance are high, and thus pay less or no dividends to investors. The coefficient on
financial leverage is significant and negative for the standalone firms consistent with our hypothesis;
whereas, it has a significant positive relationship for the business group-affiliated firms. The reasons
might be that the business group insiders lower the cost of external finance: first, by distributing dividends
from the cash-rich firms to other members in the group and, second, by participating in the equity
financing by firms in their groups (Gopalan et al., 2014).
The coefficient on FCF and asset tangibility have positive sign as per our hypothesis but are significant
only for the censored regression model in both Tables 4 and 5. However, the estimated coefficient on the
FCF and assets tangibility (TANG) is more significant for the business group-affiliated firms than for the
standalone firms. This implies that the agency problems are more severe in the business group-affiliated
firms than in the standalone firms while considering the dividend payout level decision. The marginal
effects reported for each period in Panel B of Tables 4 and 5 indicate the expected change in the percentage
of dividend payout when there is 1 per cent change in one explanatory variable holding the other
explanatory variables constant. For example, the marginal effects of FCF indicate that an increase in FCF
of 1 per cent would lead to an increase in dividend payout level by 0.366 and 0.280 for the standalone
firms and the business group-affiliated firms, respectively, holding the other variables constant for the
entire period, 1995–2015.
As per our hypothesis, the business risk has a negative relationship and statistically significant for the
standalone firms, but inconsistent with our hypothesis the coefficient is positive and statistically
significant for the business group-affiliated firms. This indicates that the business group-affiliated firms
pay more dividends even when the business risk is high. The reason might be that the information
problems might be more severe in business groups, and the business group-affiliated firms may use
dividends to signal high profitability (Manos et al., 2012).
The firm size and profitability coefficient are statistically significant and have the positive relationship
for the standalone as well as for the business group-affiliated firms as expected. This indicates that the
larger and more profitable firms are more likely to pay dividends, and their dividend payout levels are
higher compared to the smaller and less profitable firms. The marginal effects reported for each period
in Panel A of Tables 4 and 5 indicate the change in the likelihood of dividend payment due to the 1 per
cent change in the explanatory variable holding the other explanatory variables constant. For example,
the marginal effects of profitability indicate that when the profitability increases by 1 percentage point
the probability of a firm paying dividends increases by almost 0.457 and 0.239 for the standalone firms
and the business group-affiliated firms, respectively, holding the other variables constant for the entire
period, 1995–2015.
Table 3 represents the correlation between the independent variables taken from the different dividend
policy theories and VIF. Although the correlation coefficients between some of the independent variables
are significant, it is either of low degree or moderate degree, suggesting an absence of multicollinearity.
Also, the estimated value of VIF for all the independent variables are very small (i.e., much less than 5,
the rule of thumb) indicating an absence of multicollinearity problem between the independent variables.
Now, we estimate the regression model based on Equation (1) for the standalone firms (288 sample
firms) and the business group-affiliated firms (493 sample firms), separately. Tables 4 and 5 show the
results of estimation of the regression model based on Equation (1). In both Tables 4 and 5, Panels A and
B indicate the results for the logit model (whether to pay or not to pay the dividends) and the tobit model
(how much dividends to pay), respectively. The investment opportunity variable is significant in both
Tables 4 and 5 and has the negative impact for the standalone firms, while it has the positive impact for
the business group-affiliated firms. The reason is that the business group-affiliated firms create an
internal capital market and are less dependent on external finance; whereas, the standalone firms are
highly dependent on external finance and build an internal reserve to finance investments as the costs of
issuing external finance are high, and thus pay less or no dividends to investors. The coefficient on
financial leverage is significant and negative for the standalone firms consistent with our hypothesis;
whereas, it has a significant positive relationship for the business group-affiliated firms. The reasons
might be that the business group insiders lower the cost of external finance: first, by distributing dividends
from the cash-rich firms to other members in the group and, second, by participating in the equity
financing by firms in their groups (Gopalan et al., 2014).
The coefficient on FCF and asset tangibility have positive sign as per our hypothesis but are significant
only for the censored regression model in both Tables 4 and 5. However, the estimated coefficient on the
FCF and assets tangibility (TANG) is more significant for the business group-affiliated firms than for the
standalone firms. This implies that the agency problems are more severe in the business group-affiliated
firms than in the standalone firms while considering the dividend payout level decision. The marginal
effects reported for each period in Panel B of Tables 4 and 5 indicate the expected change in the percentage
of dividend payout when there is 1 per cent change in one explanatory variable holding the other
explanatory variables constant. For example, the marginal effects of FCF indicate that an increase in FCF
of 1 per cent would lead to an increase in dividend payout level by 0.366 and 0.280 for the standalone
firms and the business group-affiliated firms, respectively, holding the other variables constant for the
entire period, 1995–2015.
As per our hypothesis, the business risk has a negative relationship and statistically significant for the
standalone firms, but inconsistent with our hypothesis the coefficient is positive and statistically
significant for the business group-affiliated firms. This indicates that the business group-affiliated firms
pay more dividends even when the business risk is high. The reason might be that the information
problems might be more severe in business groups, and the business group-affiliated firms may use
dividends to signal high profitability (Manos et al., 2012).
The firm size and profitability coefficient are statistically significant and have the positive relationship
for the standalone as well as for the business group-affiliated firms as expected. This indicates that the
larger and more profitable firms are more likely to pay dividends, and their dividend payout levels are
higher compared to the smaller and less profitable firms. The marginal effects reported for each period
in Panel A of Tables 4 and 5 indicate the change in the likelihood of dividend payment due to the 1 per
cent change in the explanatory variable holding the other explanatory variables constant. For example,
the marginal effects of profitability indicate that when the profitability increases by 1 percentage point
the probability of a firm paying dividends increases by almost 0.457 and 0.239 for the standalone firms
and the business group-affiliated firms, respectively, holding the other variables constant for the entire
period, 1995–2015.
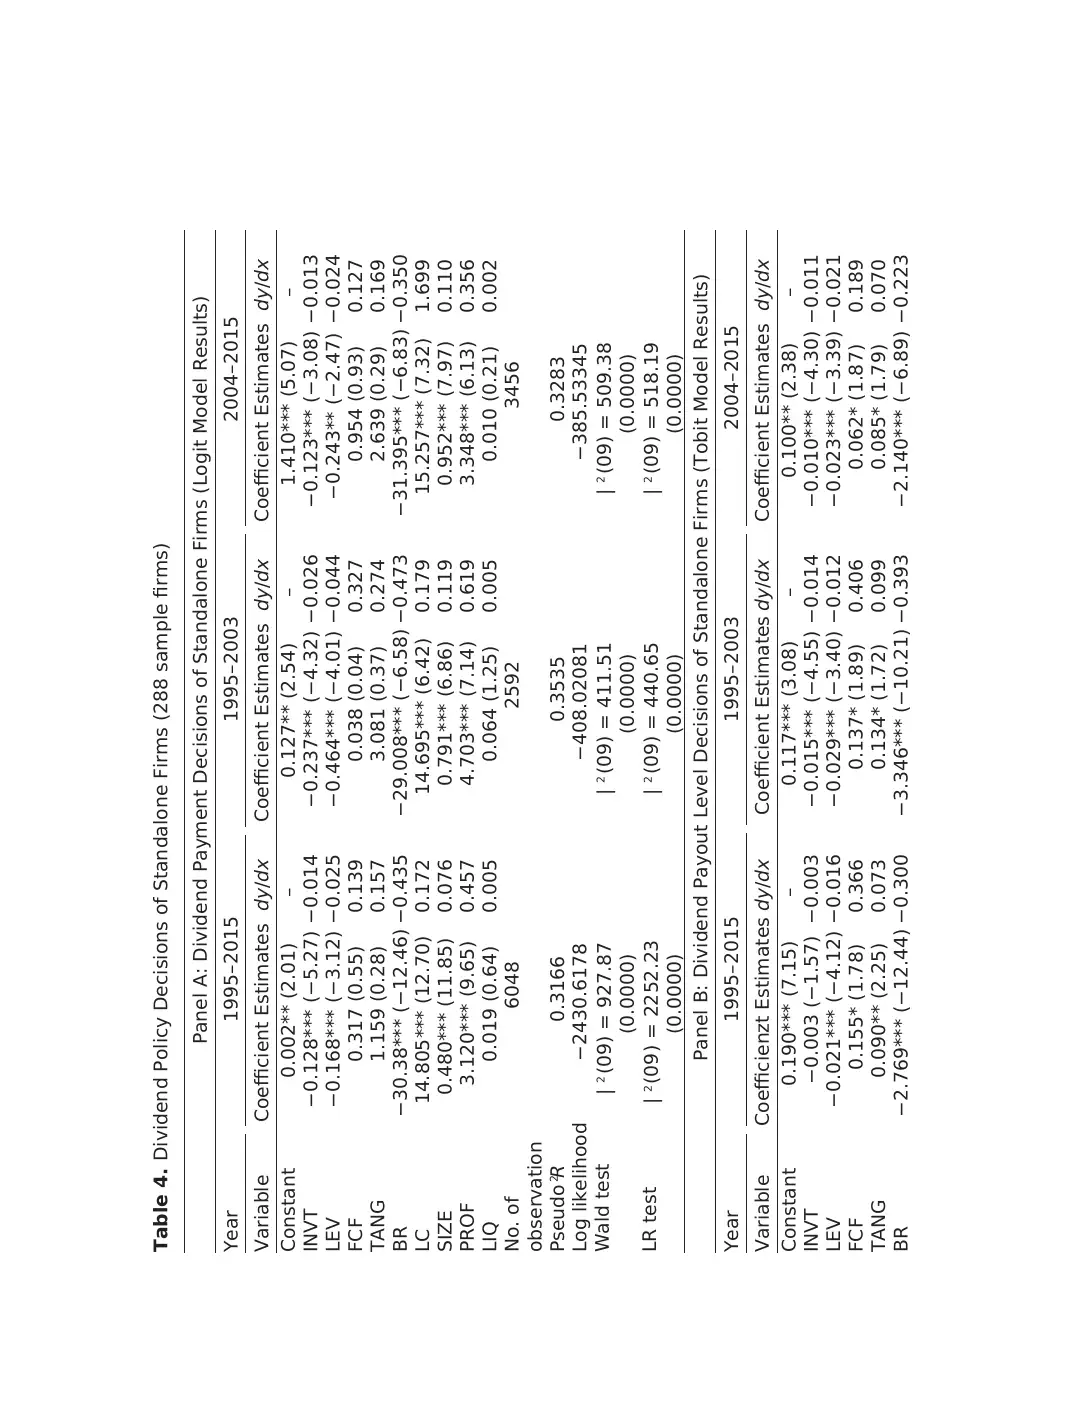
Table 4. Dividend Policy Decisions of Standalone Firms (288 sample firms)
Panel A: Dividend Payment Decisions of Standalone Firms (Logit Model Results)
Year 1995–2015 1995–2003 2004–2015
Variable Coefficient Estimates dy/dx Coefficient Estimates dy/dx Coefficient Estimates dy/dx
Constant 0.002** (2.01) – 0.127** (2.54) – 1.410*** (5.07) –
INVT −0.128*** (−5.27) −0.014 −0.237*** (−4.32) −0.026 −0.123*** (−3.08) −0.013
LEV −0.168*** (−3.12) −0.025 −0.464*** (−4.01) −0.044 −0.243** (−2.47) −0.024
FCF 0.317 (0.55) 0.139 0.038 (0.04) 0.327 0.954 (0.93) 0.127
TANG 1.159 (0.28) 0.157 3.081 (0.37) 0.274 2.639 (0.29) 0.169
BR −30.38*** (−12.46) −0.435 −29.008*** (−6.58) −0.473 −31.395*** (−6.83) −0.350
LC 14.805*** (12.70) 0.172 14.695*** (6.42) 0.179 15.257*** (7.32) 1.699
SIZE 0.480*** (11.85) 0.076 0.791*** (6.86) 0.119 0.952*** (7.97) 0.110
PROF 3.120*** (9.65) 0.457 4.703*** (7.14) 0.619 3.348*** (6.13) 0.356
LIQ 0.019 (0.64) 0.005 0.064 (1.25) 0.005 0.010 (0.21) 0.002
No. of
observation
6048 2592 3456
Pseudo R2 0.3166 0.3535 0.3283
Log likelihood −2430.6178 −408.02081 −385.53345
Wald test | 2 (09) = 927.87
(0.0000)
| 2 (09) = 411.51
(0.0000)
| 2 (09) = 509.38
(0.0000)
LR test | 2 (09) = 2252.23
(0.0000)
| 2 (09) = 440.65
(0.0000)
| 2 (09) = 518.19
(0.0000)
Panel B: Dividend Payout Level Decisions of Standalone Firms (Tobit Model Results)
Year 1995–2015 1995–2003 2004–2015
Variable Coefficienzt Estimates dy/dx Coefficient Estimates dy/dx Coefficient Estimates dy/dx
Constant 0.190*** (7.15) – 0.117*** (3.08) – 0.100** (2.38) –
INVT −0.003 (−1.57) −0.003 −0.015*** (−4.55) −0.014 −0.010*** (−4.30) −0.011
LEV −0.021*** (−4.12) −0.016 −0.029*** (−3.40) −0.012 −0.023*** (−3.39) −0.021
FCF 0.155* (1.78) 0.366 0.137* (1.89) 0.406 0.062* (1.87) 0.189
TANG 0.090** (2.25) 0.073 0.134* (1.72) 0.099 0.085* (1.79) 0.070
BR −2.769*** (−12.44) −0.300 −3.346*** (−10.21) −0.393 −2.140*** (−6.89) −0.223
⊘ This is a preview!⊘
Do you want full access?
Subscribe today to unlock all pages.
Trusted by 1+ million students worldwide
1 out of 18

Your All-in-One AI-Powered Toolkit for Academic Success.
+13062052269
info@desklib.com
Available 24*7 on WhatsApp / Email
![[object Object]](/_next/static/media/star-bottom.7253800d.svg)
Unlock your academic potential
Copyright © 2020–2026 A2Z Services. All Rights Reserved. Developed and managed by ZUCOL.