AC4410 - Dixon's Carphone Financial Analysis Report 2014-2018
VerifiedAdded on 2023/04/21
|13
|2592
|331
Report
AI Summary
This assignment provides a financial analysis of Dixon's Carphone Plc. from 2014 to 2018, utilizing ratio analysis to assess the company's performance in terms of liquidity, profitability, and gearing. The analysis includes calculations and interpretations of key financial ratios such as gearing ratio, interest coverage ratio, return on capital employed, gross profit margin, operating margin ratio, current ratio, and quick ratio. The report reveals trends in the company's financial health, highlighting a decrease in gearing, an increase in interest coverage, fluctuations in return on capital employed and gross profit margin, a decline in operating margin, and inconsistent liquidity positions. The conclusion emphasizes the importance of maintaining a sound liquidity position and reducing operating expenses while acknowledging the company's efforts to reduce debt and leverage its product portfolio for revenue growth.
Running head: ACCOUNTS AND FINANCE
Dixon’s Carphone
Name of the Student:
Name of the University:
Author’s Note:
Dixon’s Carphone
Name of the Student:
Name of the University:
Author’s Note:
Paraphrase This Document
Need a fresh take? Get an instant paraphrase of this document with our AI Paraphraser
1DIXONS CARPHONE
Executive Summary
The aim of the assignment is to conduct a financial analysis on the Dixon’s Carphone
Company using the financial information presented by the company for the trend period
analysed for the company from the year 2014-2018. The application of ratio analysis was
applied in the analysis of the Dixons Carphone Limited Company and the relevant
performance of the company in terms of liquidity, profitability and gearing ratio for the
company was taken into consideration for the assignment.
2DIXONS CARPHONE
Table of Contents
Introduction................................................................................................................................3
Discussion..................................................................................................................................3
Ratio Analysis........................................................................................................................3
Calculations............................................................................................................................4
Gearing/Capital Structure Ratio.........................................................................................4
Profitability Ratio...............................................................................................................5
Liquidity Ratio...................................................................................................................6
Conclusion..................................................................................................................................8
Bibliography...............................................................................................................................9
Appendix..................................................................................................................................11
⊘ This is a preview!⊘
Do you want full access?
Subscribe today to unlock all pages.
Trusted by 1+ million students worldwide
3DIXONS CARPHONE
Introduction
The Dixon Carphone Plc. is a multinational electrical and telecommunication retailer
and services company which is headquartered in the London. The company primarily has its
operations in the Consumer Electronics Industry and has its presence globally. The company
has its presence in a variety of distinct marketplaces such as mobile phones, other types of
consumer electronic products and various other types of business services. The operations of
the company are usually carried on under various brands in the United Kingdom, Ireland and
mainland European region. Curry’s, PC World, Carphone Warehouse are some of the
common brands under which the company usually carries on their operating activities. The
company has a good employee base where around 43,000 employees directly work under the
company. The company is listed in the London Stock Exchange and is also a part of the
FTSE 250 Index. The future prospect of the company is dependent on the various brands
under which the operations of the company is performed and the profitability generated from
the same (Shouman, El Shenawy and Khattab 2016). There are various global business and
macro-economic factors, which plays a significant role in the development of the company
(Vogel 2014).
Discussion
Ratio Analysis
The ratio analysis of the company is performed in order to analyse the performance of
the company. The ratio analysis is quantitative analysis tool used for analysing the financial
performance of the company over the period of time. The application of the ratio analysis
help in understanding the trend of the financial performance of the company. The key benefit
of the ratio analysis is that it takes into account the financial data by indicating the financial
performance of the company and indicates the profitability, liquidity position and the capital
Paraphrase This Document
Need a fresh take? Get an instant paraphrase of this document with our AI Paraphraser
4DIXONS CARPHONE
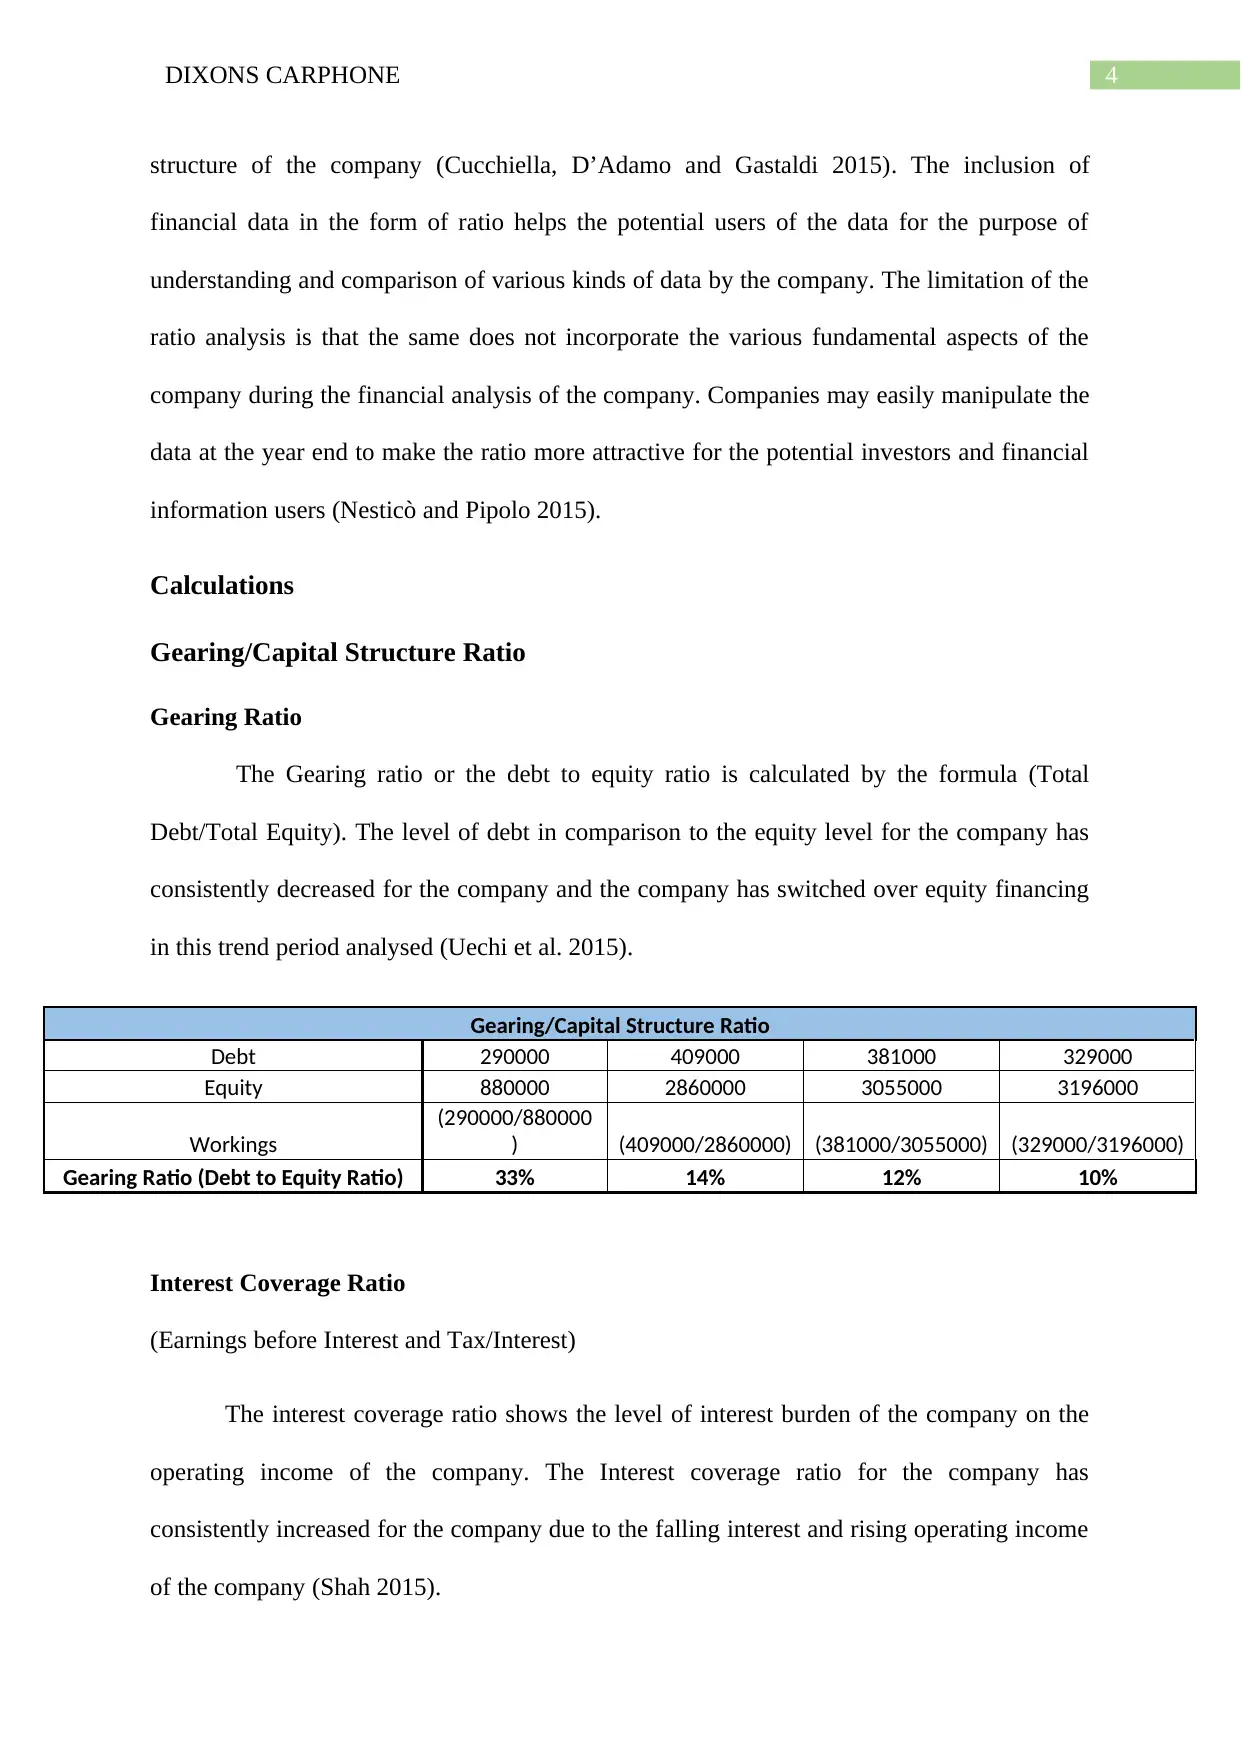
structure of the company (Cucchiella, D’Adamo and Gastaldi 2015). The inclusion of
financial data in the form of ratio helps the potential users of the data for the purpose of
understanding and comparison of various kinds of data by the company. The limitation of the
ratio analysis is that the same does not incorporate the various fundamental aspects of the
company during the financial analysis of the company. Companies may easily manipulate the
data at the year end to make the ratio more attractive for the potential investors and financial
information users (Nesticò and Pipolo 2015).
Calculations
Gearing/Capital Structure Ratio
Gearing Ratio
The Gearing ratio or the debt to equity ratio is calculated by the formula (Total
Debt/Total Equity). The level of debt in comparison to the equity level for the company has
consistently decreased for the company and the company has switched over equity financing
in this trend period analysed (Uechi et al. 2015).
Gearing/Capital Structure Ratio
Debt 290000 409000 381000 329000
Equity 880000 2860000 3055000 3196000
Workings
(290000/880000
) (409000/2860000) (381000/3055000) (329000/3196000)
Gearing Ratio (Debt to Equity Ratio) 33% 14% 12% 10%
Interest Coverage Ratio
(Earnings before Interest and Tax/Interest)
The interest coverage ratio shows the level of interest burden of the company on the
operating income of the company. The Interest coverage ratio for the company has
consistently increased for the company due to the falling interest and rising operating income
of the company (Shah 2015).
5DIXONS CARPHONE
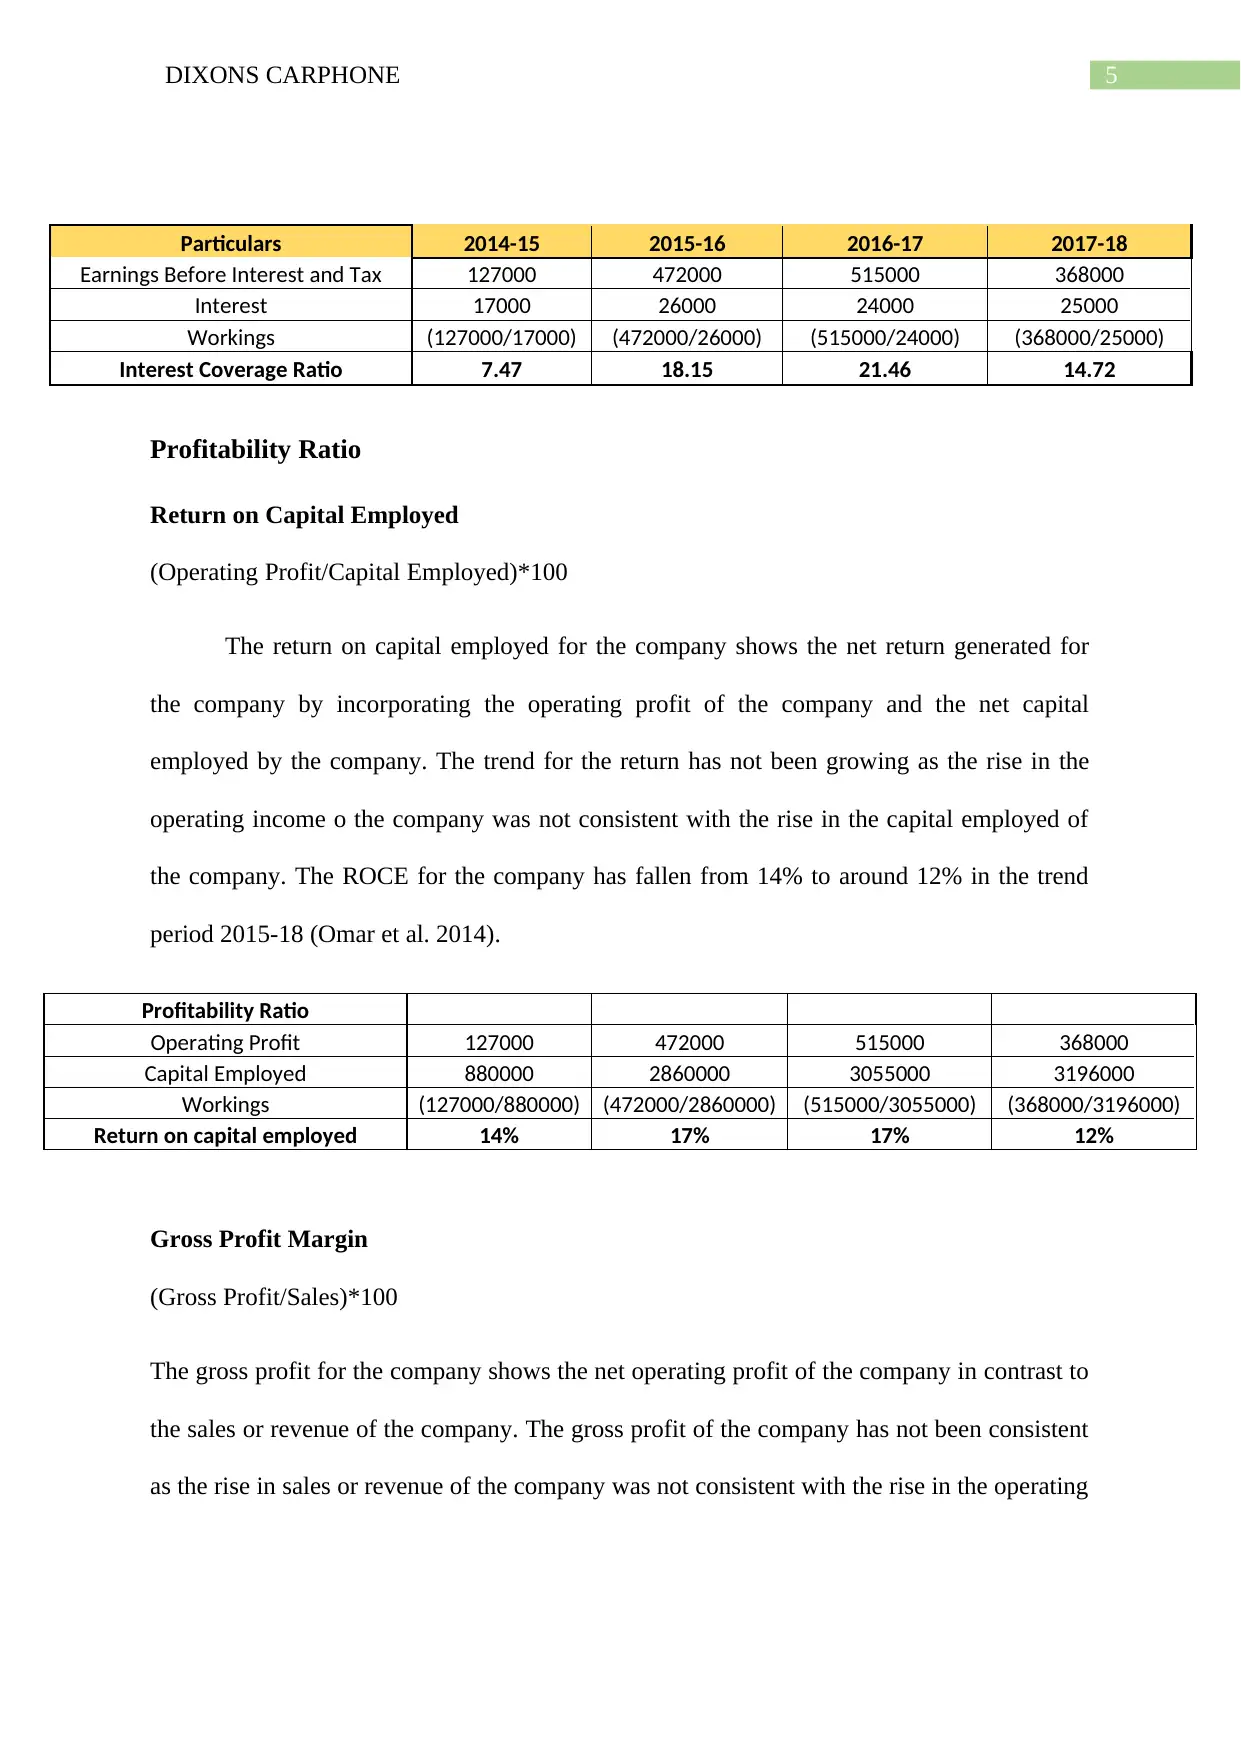
Particulars 2014-15 2015-16 2016-17 2017-18
Earnings Before Interest and Tax 127000 472000 515000 368000
Interest 17000 26000 24000 25000
Workings (127000/17000) (472000/26000) (515000/24000) (368000/25000)
Interest Coverage Ratio 7.47 18.15 21.46 14.72
Profitability Ratio
Return on Capital Employed
(Operating Profit/Capital Employed)*100
The return on capital employed for the company shows the net return generated for
the company by incorporating the operating profit of the company and the net capital
employed by the company. The trend for the return has not been growing as the rise in the
operating income o the company was not consistent with the rise in the capital employed of
the company. The ROCE for the company has fallen from 14% to around 12% in the trend
period 2015-18 (Omar et al. 2014).
Profitability Ratio
Operating Profit 127000 472000 515000 368000
Capital Employed 880000 2860000 3055000 3196000
Workings (127000/880000) (472000/2860000) (515000/3055000) (368000/3196000)
Return on capital employed 14% 17% 17% 12%
Gross Profit Margin
(Gross Profit/Sales)*100
The gross profit for the company shows the net operating profit of the company in contrast to
the sales or revenue of the company. The gross profit of the company has not been consistent
as the rise in sales or revenue of the company was not consistent with the rise in the operating
⊘ This is a preview!⊘
Do you want full access?
Subscribe today to unlock all pages.
Trusted by 1+ million students worldwide
6DIXONS CARPHONE
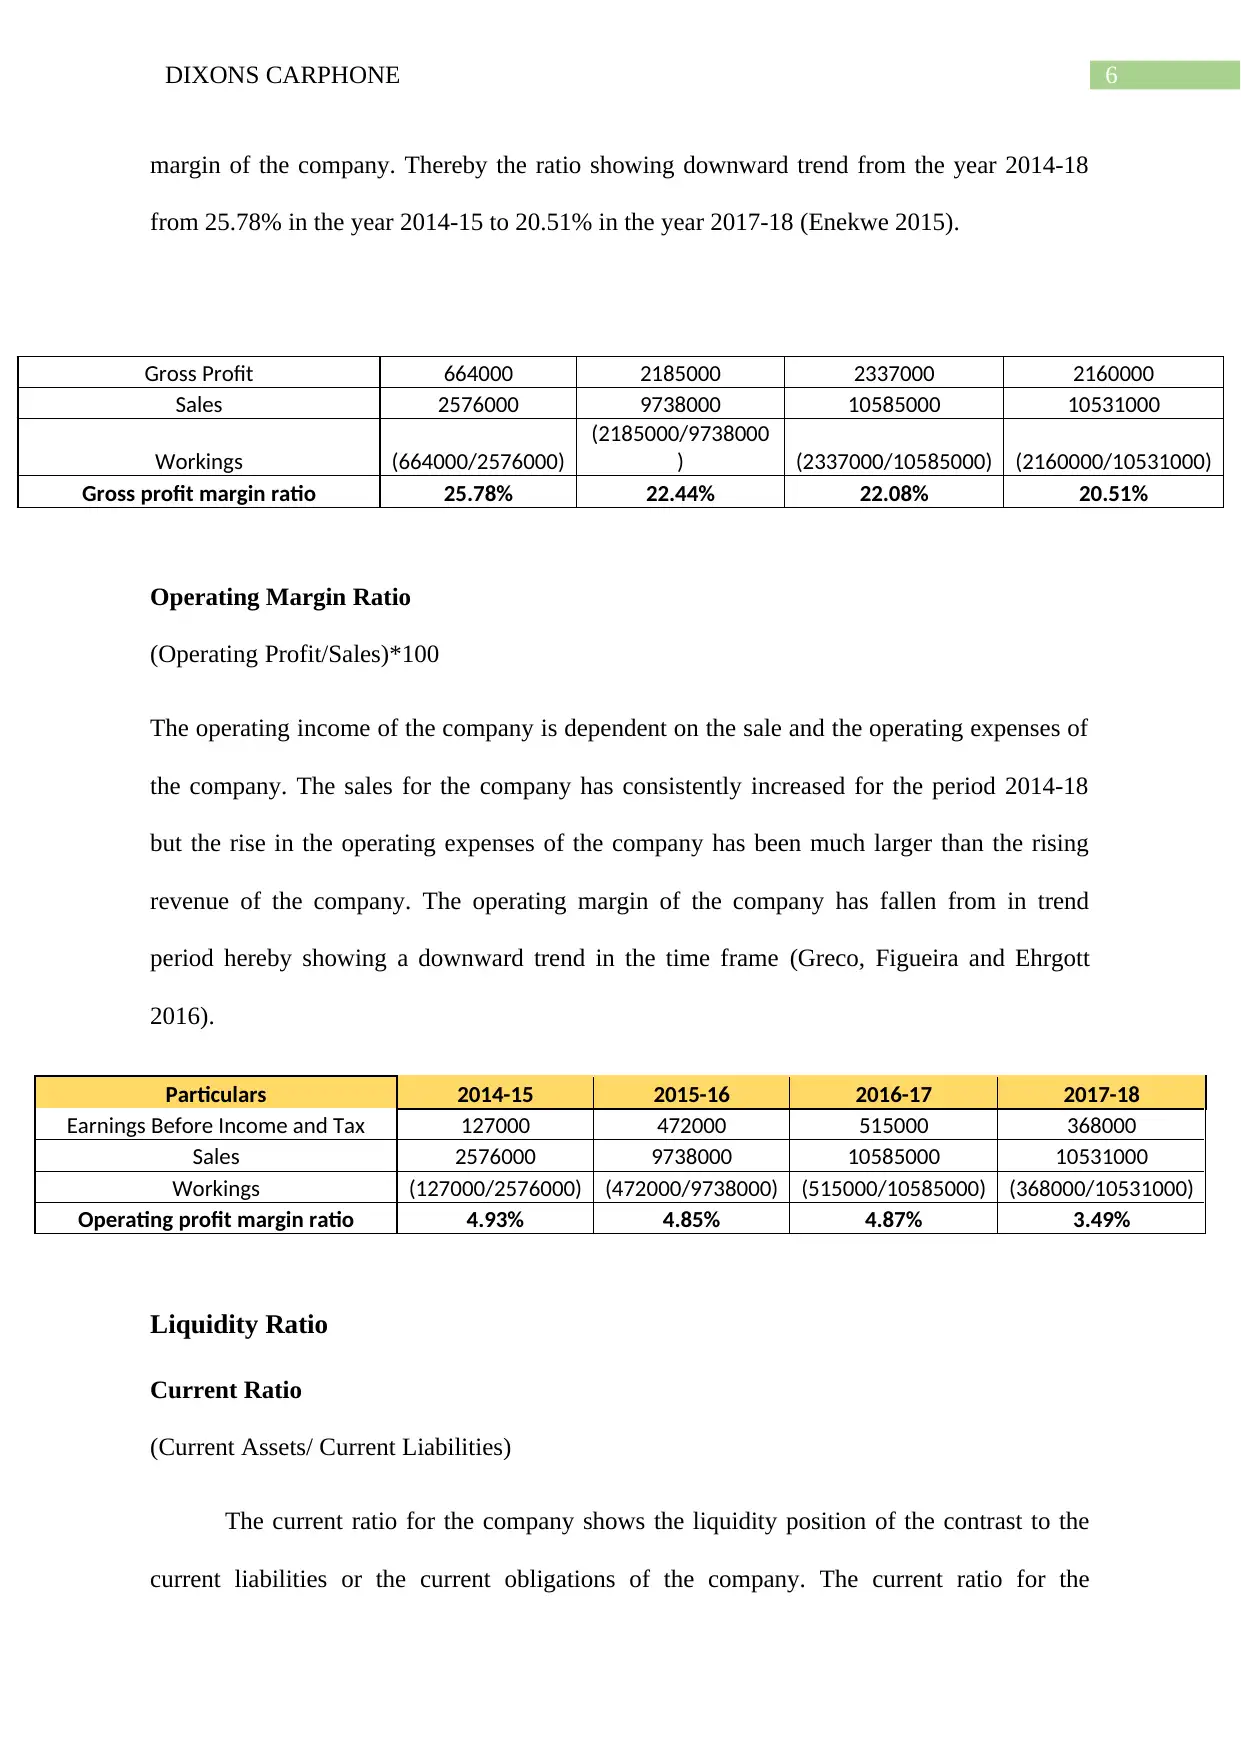
margin of the company. Thereby the ratio showing downward trend from the year 2014-18
from 25.78% in the year 2014-15 to 20.51% in the year 2017-18 (Enekwe 2015).
Gross Profit 664000 2185000 2337000 2160000
Sales 2576000 9738000 10585000 10531000
Workings (664000/2576000)
(2185000/9738000
) (2337000/10585000) (2160000/10531000)
Gross profit margin ratio 25.78% 22.44% 22.08% 20.51%
Operating Margin Ratio
(Operating Profit/Sales)*100
The operating income of the company is dependent on the sale and the operating expenses of
the company. The sales for the company has consistently increased for the period 2014-18
but the rise in the operating expenses of the company has been much larger than the rising
revenue of the company. The operating margin of the company has fallen from in trend
period hereby showing a downward trend in the time frame (Greco, Figueira and Ehrgott
2016).
Particulars 2014-15 2015-16 2016-17 2017-18
Earnings Before Income and Tax 127000 472000 515000 368000
Sales 2576000 9738000 10585000 10531000
Workings (127000/2576000) (472000/9738000) (515000/10585000) (368000/10531000)
Operating profit margin ratio 4.93% 4.85% 4.87% 3.49%
Liquidity Ratio
Current Ratio
(Current Assets/ Current Liabilities)
The current ratio for the company shows the liquidity position of the contrast to the
current liabilities or the current obligations of the company. The current ratio for the
Paraphrase This Document
Need a fresh take? Get an instant paraphrase of this document with our AI Paraphraser
7DIXONS CARPHONE
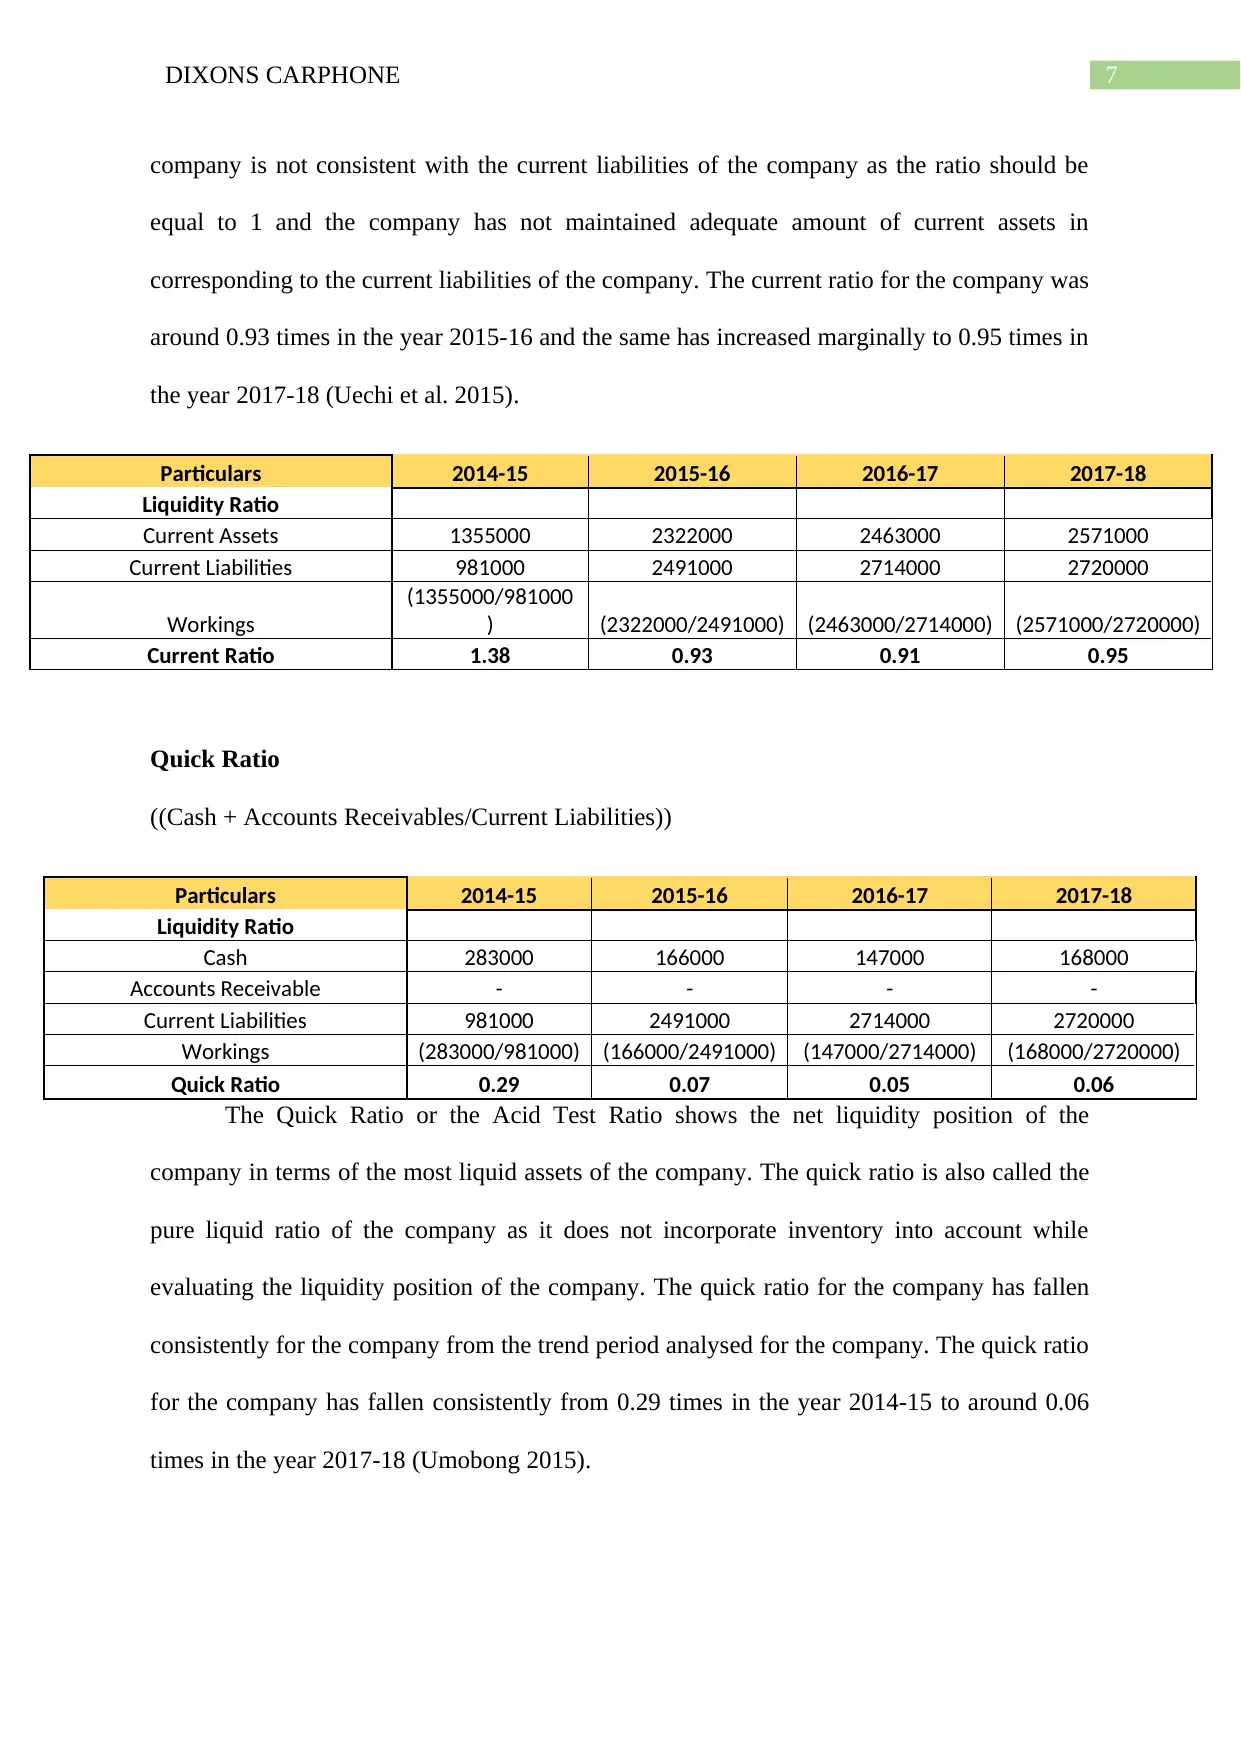
company is not consistent with the current liabilities of the company as the ratio should be
equal to 1 and the company has not maintained adequate amount of current assets in
corresponding to the current liabilities of the company. The current ratio for the company was
around 0.93 times in the year 2015-16 and the same has increased marginally to 0.95 times in
the year 2017-18 (Uechi et al. 2015).
Particulars 2014-15 2015-16 2016-17 2017-18
Liquidity Ratio
Current Assets 1355000 2322000 2463000 2571000
Current Liabilities 981000 2491000 2714000 2720000
Workings
(1355000/981000
) (2322000/2491000) (2463000/2714000) (2571000/2720000)
Current Ratio 1.38 0.93 0.91 0.95
Quick Ratio
((Cash + Accounts Receivables/Current Liabilities))
Particulars 2014-15 2015-16 2016-17 2017-18
Liquidity Ratio
Cash 283000 166000 147000 168000
Accounts Receivable - - - -
Current Liabilities 981000 2491000 2714000 2720000
Workings (283000/981000) (166000/2491000) (147000/2714000) (168000/2720000)
Quick Ratio 0.29 0.07 0.05 0.06
The Quick Ratio or the Acid Test Ratio shows the net liquidity position of the
company in terms of the most liquid assets of the company. The quick ratio is also called the
pure liquid ratio of the company as it does not incorporate inventory into account while
evaluating the liquidity position of the company. The quick ratio for the company has fallen
consistently for the company from the trend period analysed for the company. The quick ratio
for the company has fallen consistently from 0.29 times in the year 2014-15 to around 0.06
times in the year 2017-18 (Umobong 2015).
8DIXONS CARPHONE
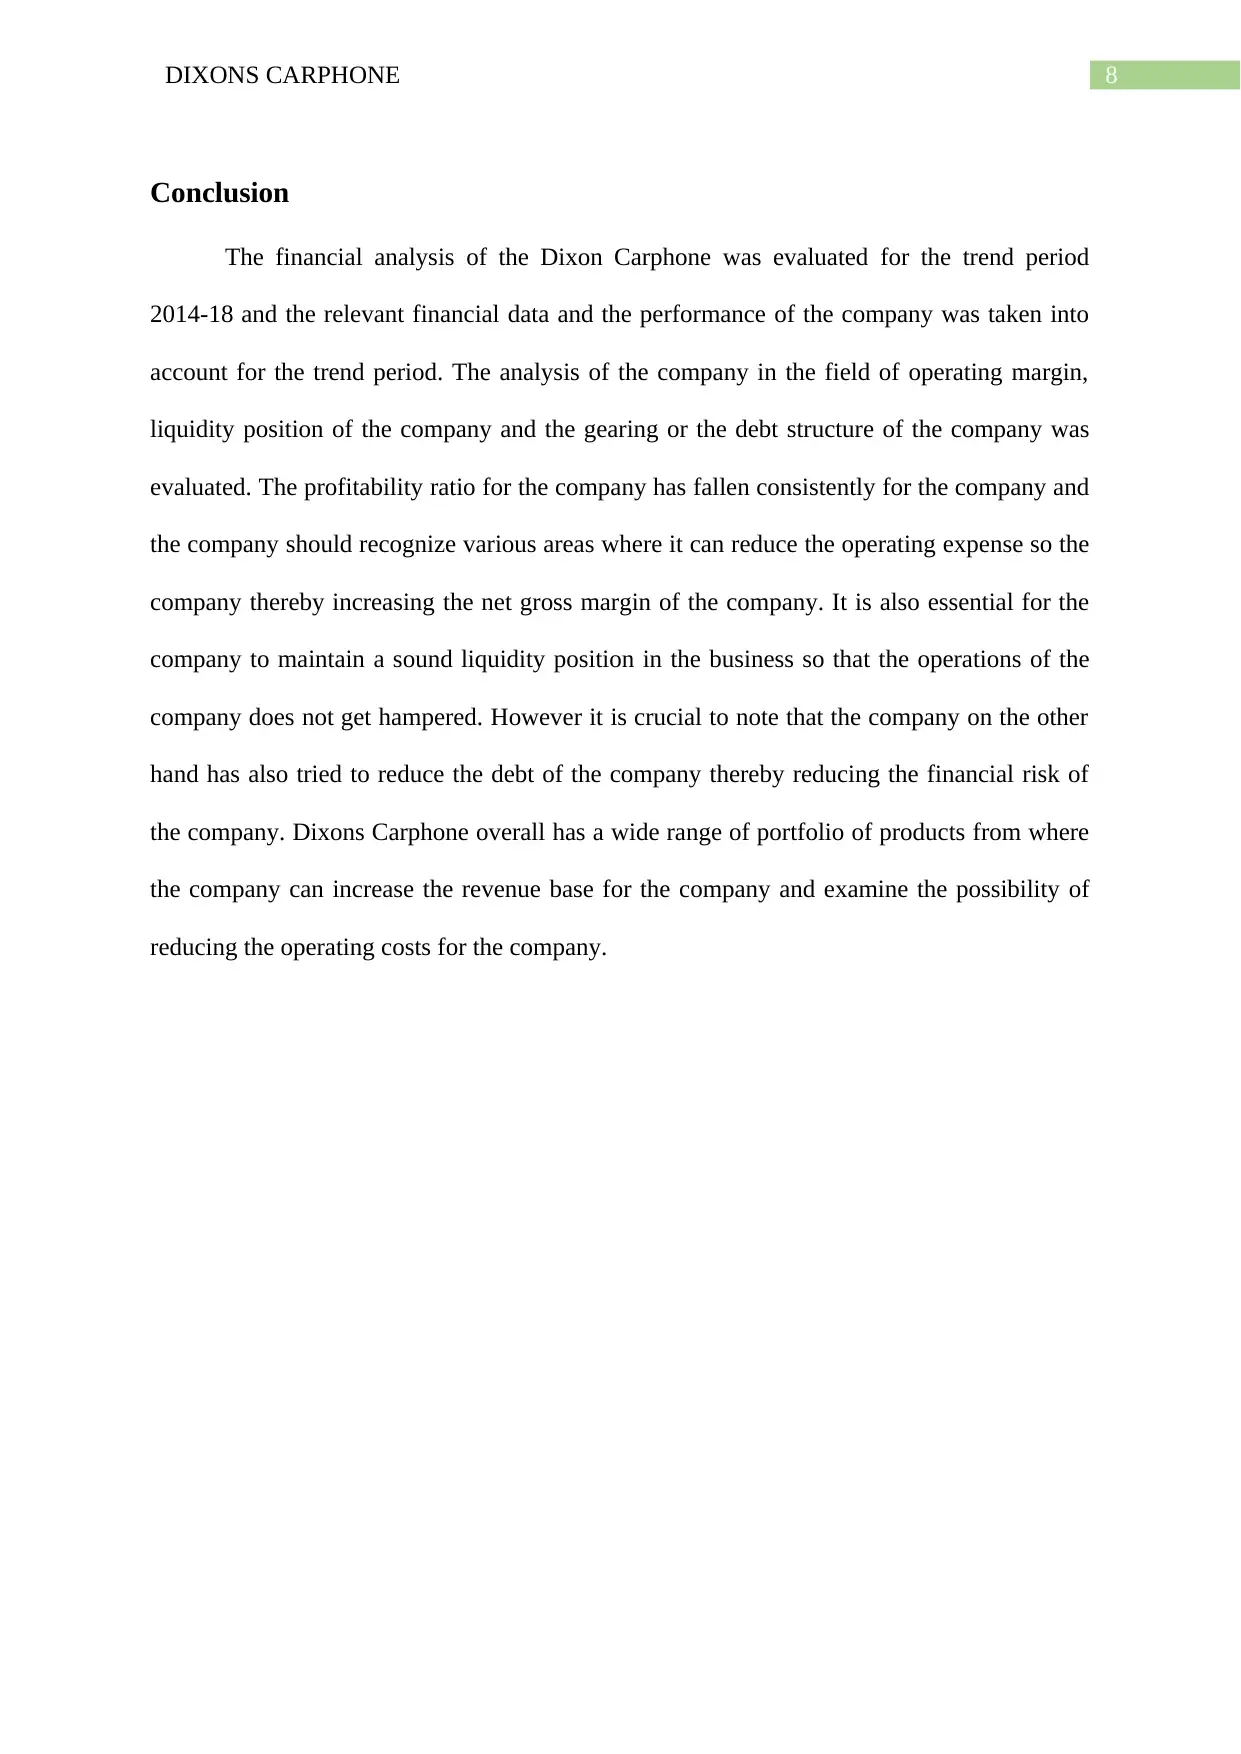
Conclusion
The financial analysis of the Dixon Carphone was evaluated for the trend period
2014-18 and the relevant financial data and the performance of the company was taken into
account for the trend period. The analysis of the company in the field of operating margin,
liquidity position of the company and the gearing or the debt structure of the company was
evaluated. The profitability ratio for the company has fallen consistently for the company and
the company should recognize various areas where it can reduce the operating expense so the
company thereby increasing the net gross margin of the company. It is also essential for the
company to maintain a sound liquidity position in the business so that the operations of the
company does not get hampered. However it is crucial to note that the company on the other
hand has also tried to reduce the debt of the company thereby reducing the financial risk of
the company. Dixons Carphone overall has a wide range of portfolio of products from where
the company can increase the revenue base for the company and examine the possibility of
reducing the operating costs for the company.
⊘ This is a preview!⊘
Do you want full access?
Subscribe today to unlock all pages.
Trusted by 1+ million students worldwide
9DIXONS CARPHONE
Bibliography
Cucchiella, F., D’Adamo, I. and Gastaldi, M., 2015. Financial analysis for investment and
policy decisions in the renewable energy sector. Clean Technologies and Environmental
Policy, 17(4), pp.887-904.
Enekwe, C.I., 2015. The relationship between financial ratio analysis and corporate
profitability: a study of selected quoted oil and gas companies in Nigeria. European Journal
of Accounting, Auditing and Finance Research, 3(2), pp.17-34.
Greco, S., Figueira, J. and Ehrgott, M., 2016. Multiple criteria decision analysis. New York:
Springer.
Nesticò, A. and Pipolo, O., 2015. A protocol for sustainable building interventions: financial
analysis and environmental effects. International Journal of Business Intelligence and Data
Mining, 10(3), pp.199-212.
Omar, N., Koya, R.K., Sanusi, Z.M. and Shafie, N.A., 2014. Financial statement fraud: A
case examination using Beneish Model and ratio analysis. International Journal of Trade,
Economics and Finance, 5(2), p.184.
Shah, M.B., 2015. A financial ratio analysis of Hindustan Unilever Limited
(HUL). RESEARCH HUB-International Multidisciplinary Research Journal (RHIMRJ), 2(5),
pp.1-5.
Shouman, E.R., El Shenawy, E.T. and Khattab, N.M., 2016. Market financial analysis and
cost performance for photovoltaic technology through international and national perspective
with case study for Egypt. Renewable and Sustainable Energy Reviews, 57, pp.540-549.
Paraphrase This Document
Need a fresh take? Get an instant paraphrase of this document with our AI Paraphraser
10DIXONS CARPHONE
Uechi, L., Akutsu, T., Stanley, H.E., Marcus, A.J. and Kenett, D.Y., 2015. Sector dominance
ratio analysis of financial markets. Physica A: Statistical Mechanics and its
Applications, 421, pp.488-509.
Uechi, L., Akutsu, T., Stanley, H.E., Marcus, A.J. and Kenett, D.Y., 2015. Sector dominance
ratio analysis of financial markets. Physica A: Statistical Mechanics and its
Applications, 421, pp.488-509.
Umobong, A.A., 2015. Assessing the impact of liquidity and profitability ratios on growth of
profits in pharmaceutical firms in Nigeria. European Journal of Accounting, Auditing and
Finance Research, 3(10), pp.97-114.
Vogel, H.L., 2014. Entertainment industry economics: A guide for financial analysis.
Cambridge University Press.
Uechi, L., Akutsu, T., Stanley, H.E., Marcus, A.J. and Kenett, D.Y., 2015. Sector dominance
ratio analysis of financial markets. Physica A: Statistical Mechanics and its
Applications, 421, pp.488-509.
Uechi, L., Akutsu, T., Stanley, H.E., Marcus, A.J. and Kenett, D.Y., 2015. Sector dominance
ratio analysis of financial markets. Physica A: Statistical Mechanics and its
Applications, 421, pp.488-509.
Umobong, A.A., 2015. Assessing the impact of liquidity and profitability ratios on growth of
profits in pharmaceutical firms in Nigeria. European Journal of Accounting, Auditing and
Finance Research, 3(10), pp.97-114.
Vogel, H.L., 2014. Entertainment industry economics: A guide for financial analysis.
Cambridge University Press.
11DIXONS CARPHONE
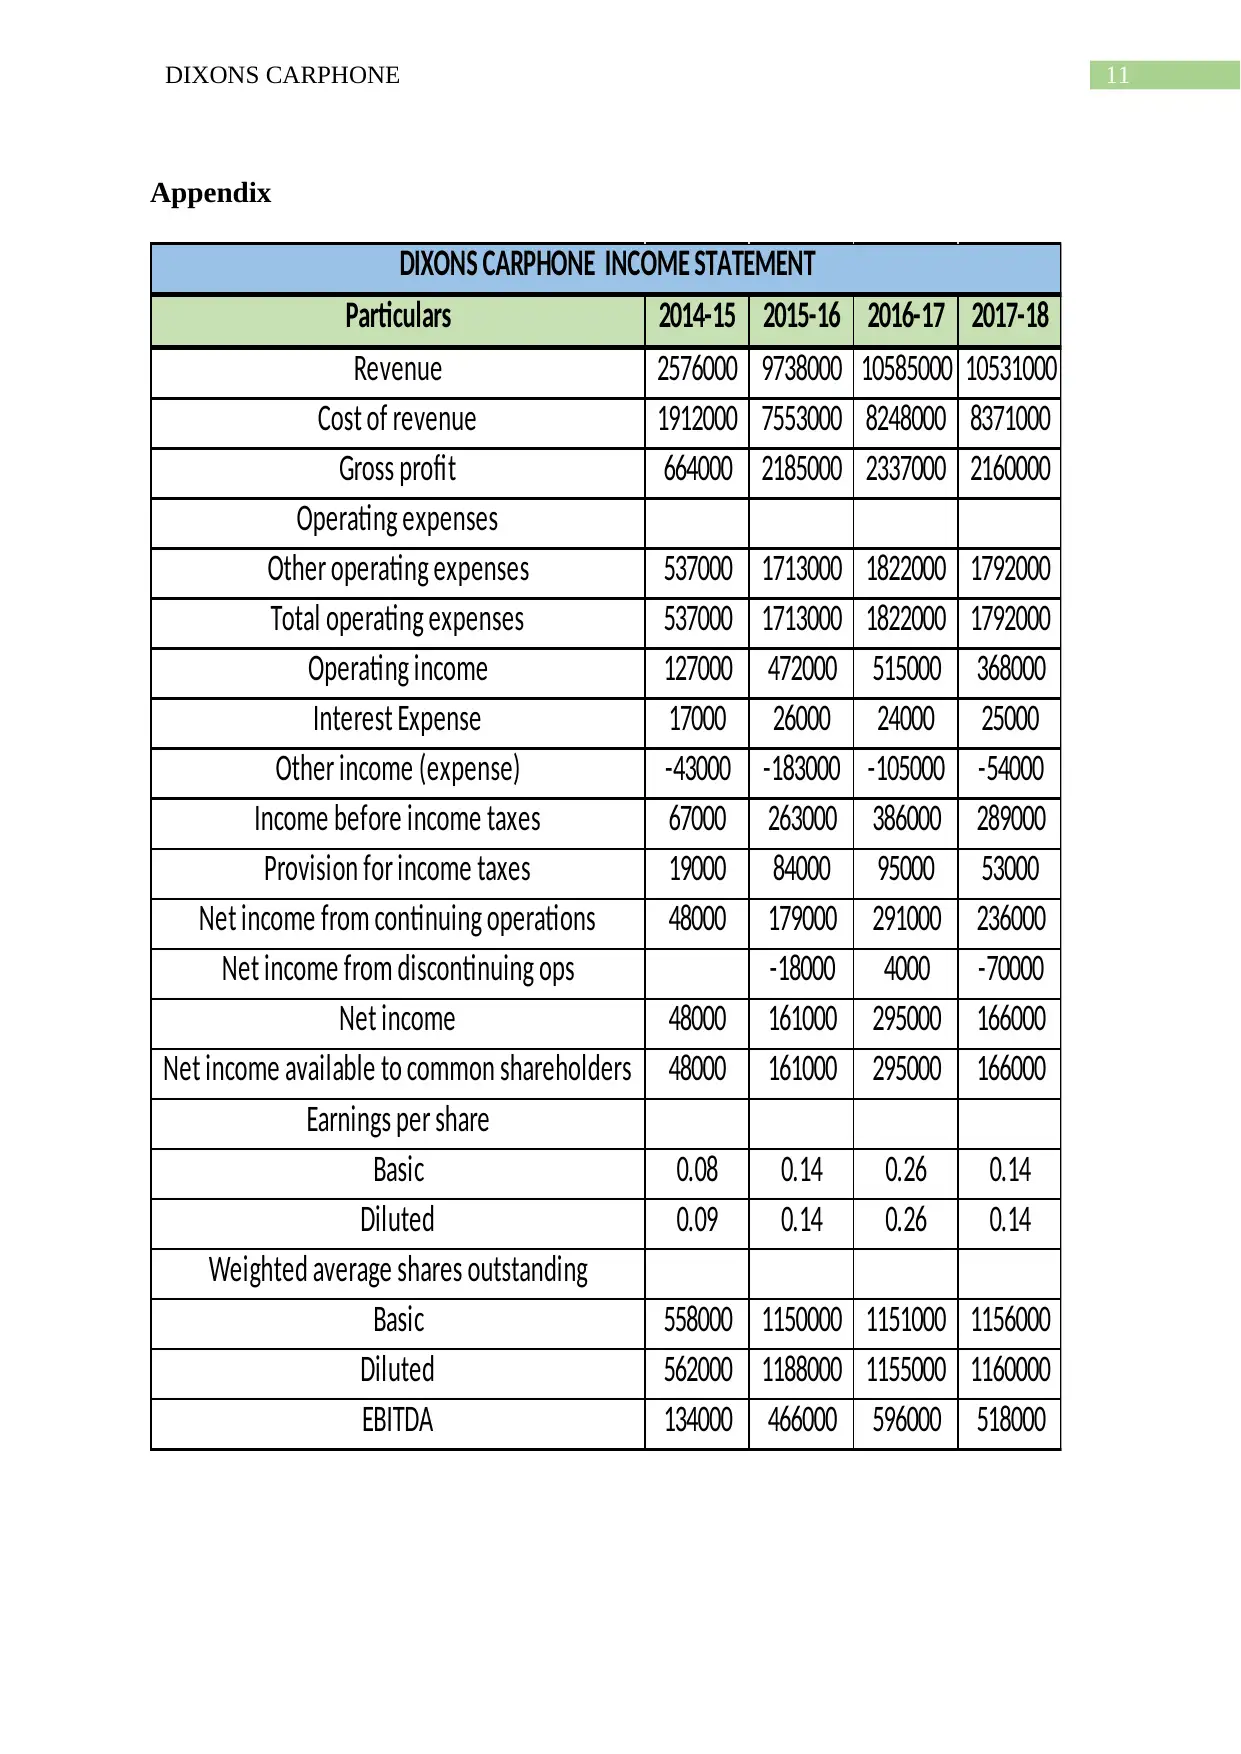
Appendix
Particulars 2014-15 2015-16 2016-17 2017-18
Revenue 2576000 9738000 10585000 10531000
Cost of revenue 1912000 7553000 8248000 8371000
Gross profit 664000 2185000 2337000 2160000
Operating expenses
Other operating expenses 537000 1713000 1822000 1792000
Total operating expenses 537000 1713000 1822000 1792000
Operating income 127000 472000 515000 368000
Interest Expense 17000 26000 24000 25000
Other income (expense) -43000 -183000 -105000 -54000
Income before income taxes 67000 263000 386000 289000
Provision for income taxes 19000 84000 95000 53000
Net income from continuing operations 48000 179000 291000 236000
Net income from discontinuing ops -18000 4000 -70000
Net income 48000 161000 295000 166000
Net income available to common shareholders 48000 161000 295000 166000
Earnings per share
Basic 0.08 0.14 0.26 0.14
Diluted 0.09 0.14 0.26 0.14
Weighted average shares outstanding
Basic 558000 1150000 1151000 1156000
Diluted 562000 1188000 1155000 1160000
EBITDA 134000 466000 596000 518000
DIXONS CARPHONE INCOME STATEMENT
⊘ This is a preview!⊘
Do you want full access?
Subscribe today to unlock all pages.
Trusted by 1+ million students worldwide
1 out of 13
Related Documents


Your All-in-One AI-Powered Toolkit for Academic Success.
+13062052269
info@desklib.com
Available 24*7 on WhatsApp / Email
![[object Object]](/_next/static/media/star-bottom.7253800d.svg)
Unlock your academic potential
Copyright © 2020–2026 A2Z Services. All Rights Reserved. Developed and managed by ZUCOL.