BUS1AFB Semester 2: Dollars and Sense Case Study Assessment

Verified

Added on  2022/10/04

|12
|1494
|18
Case Study
AI Summary
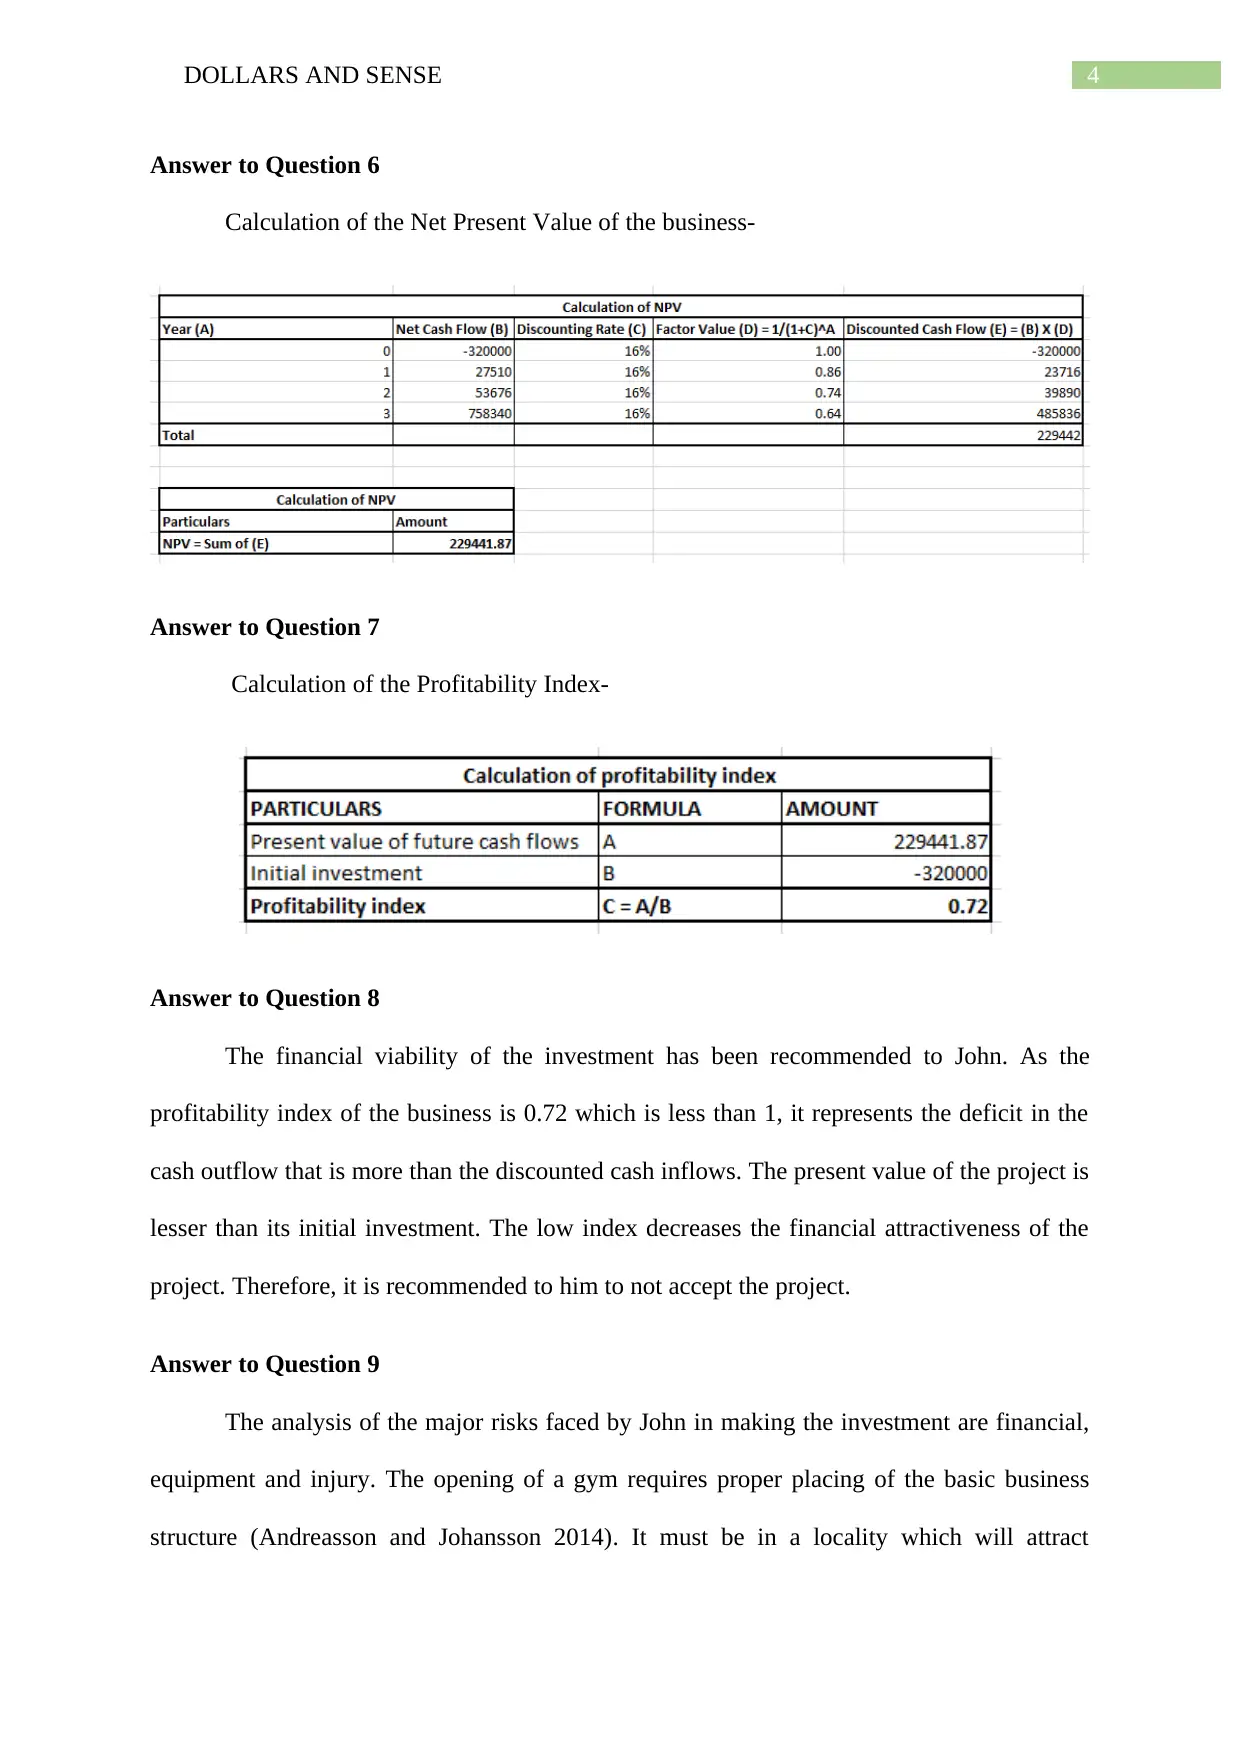
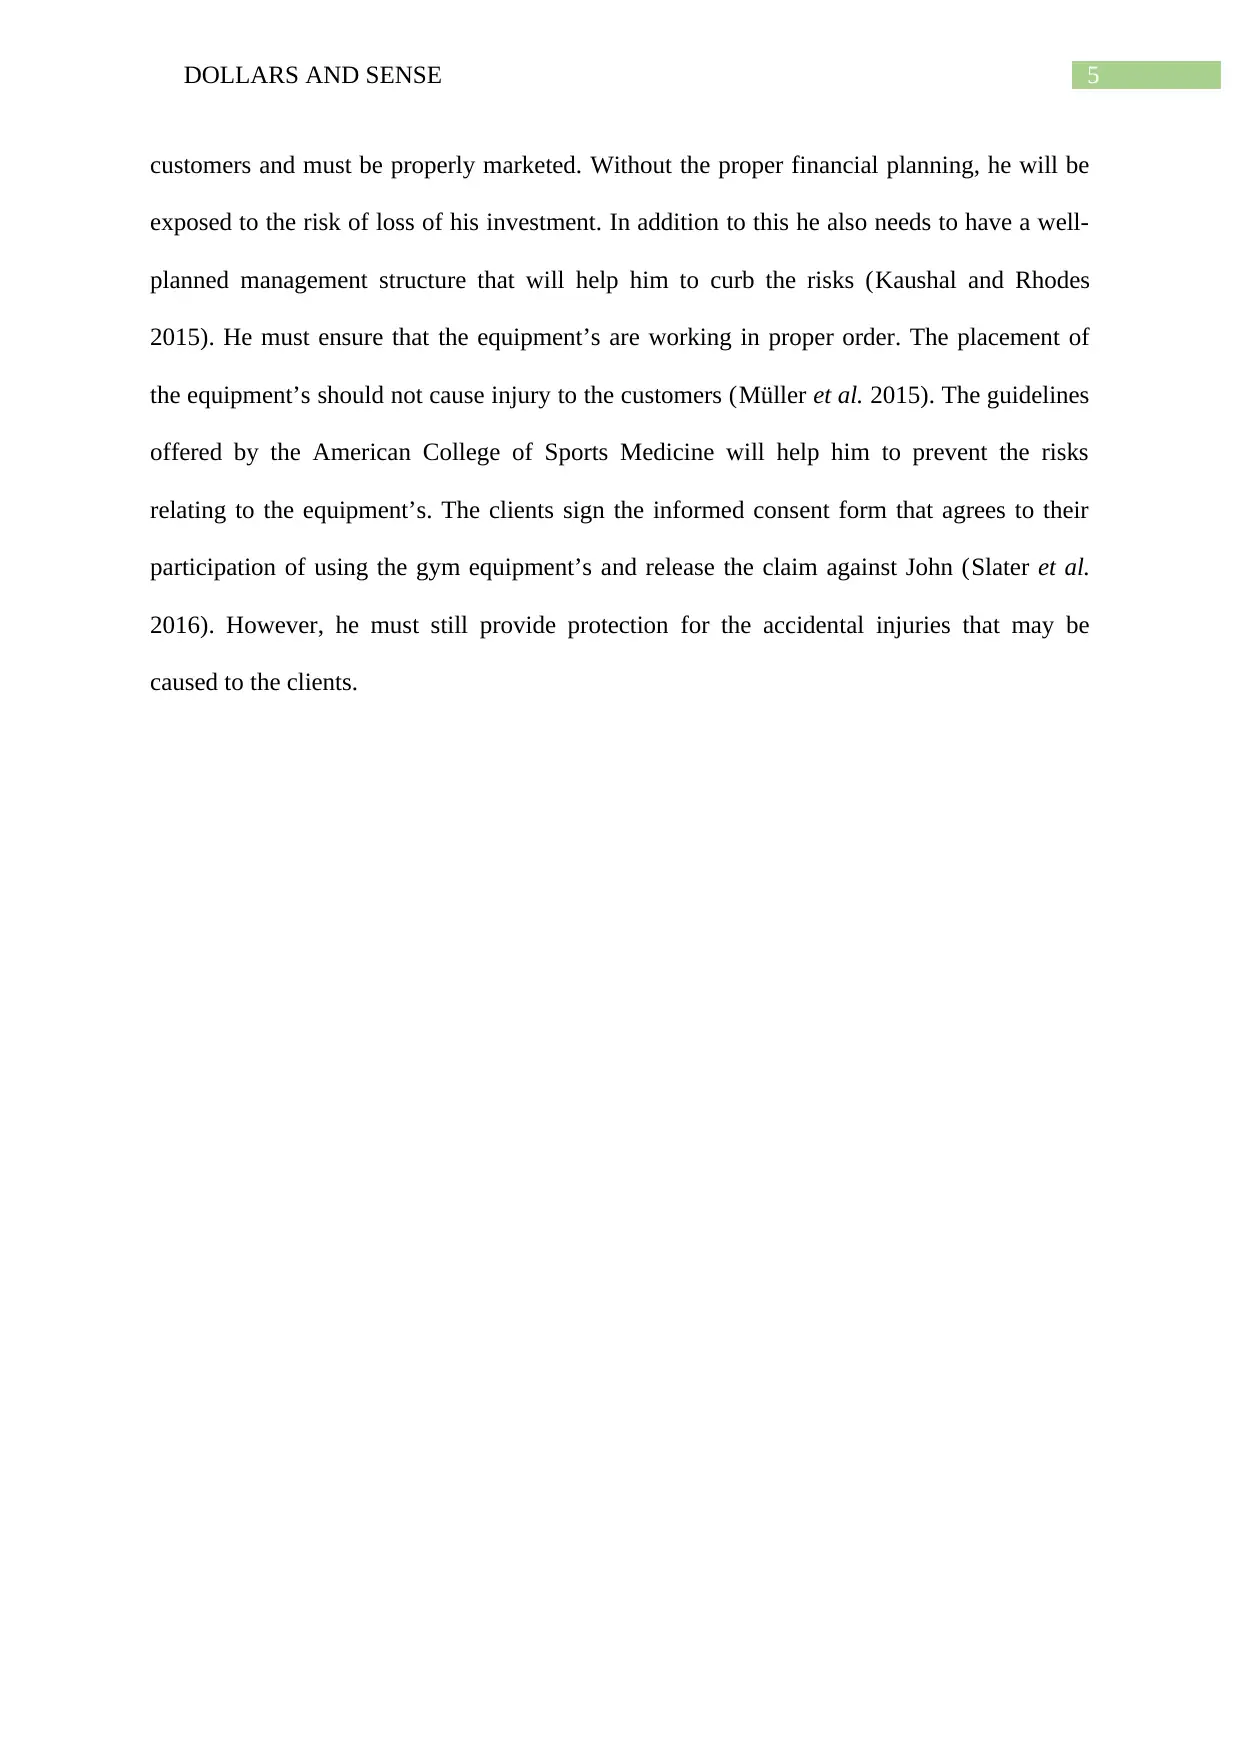
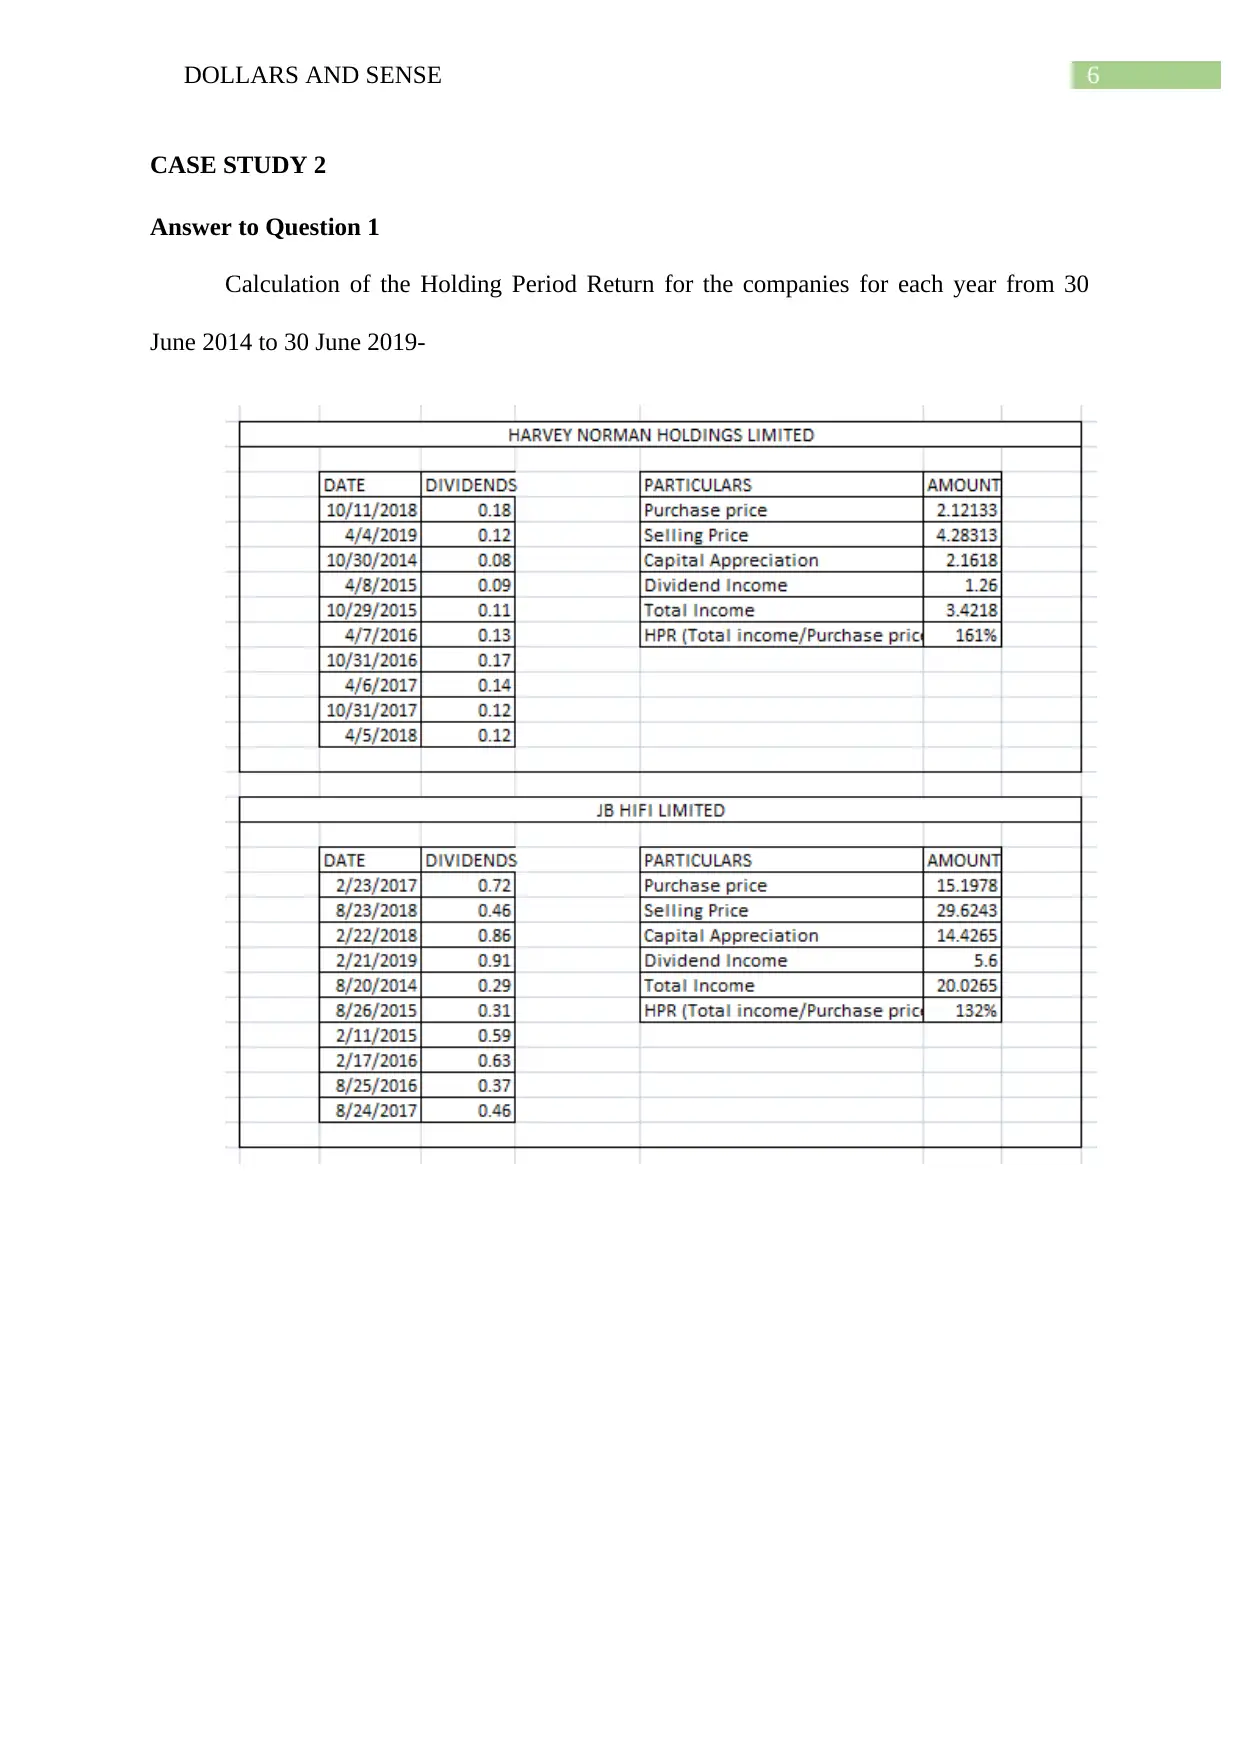
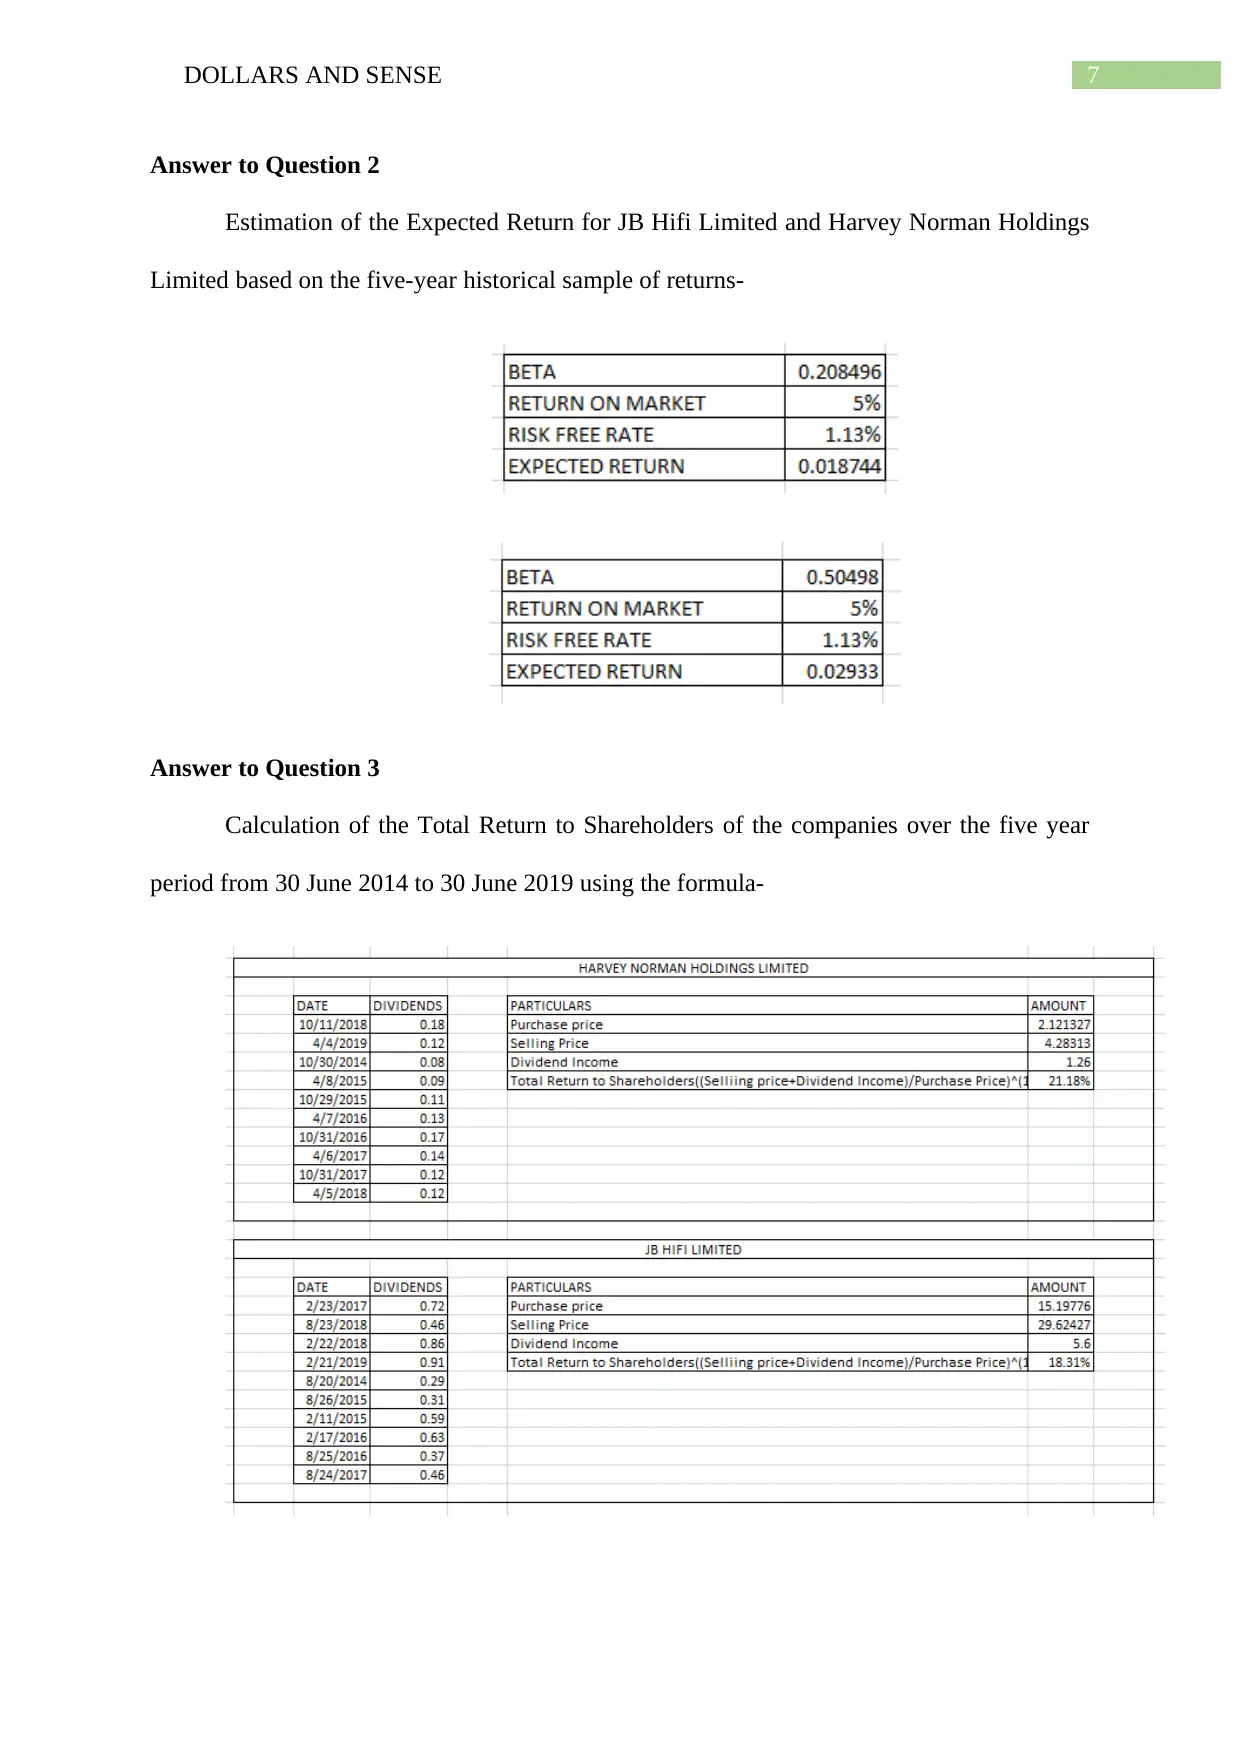
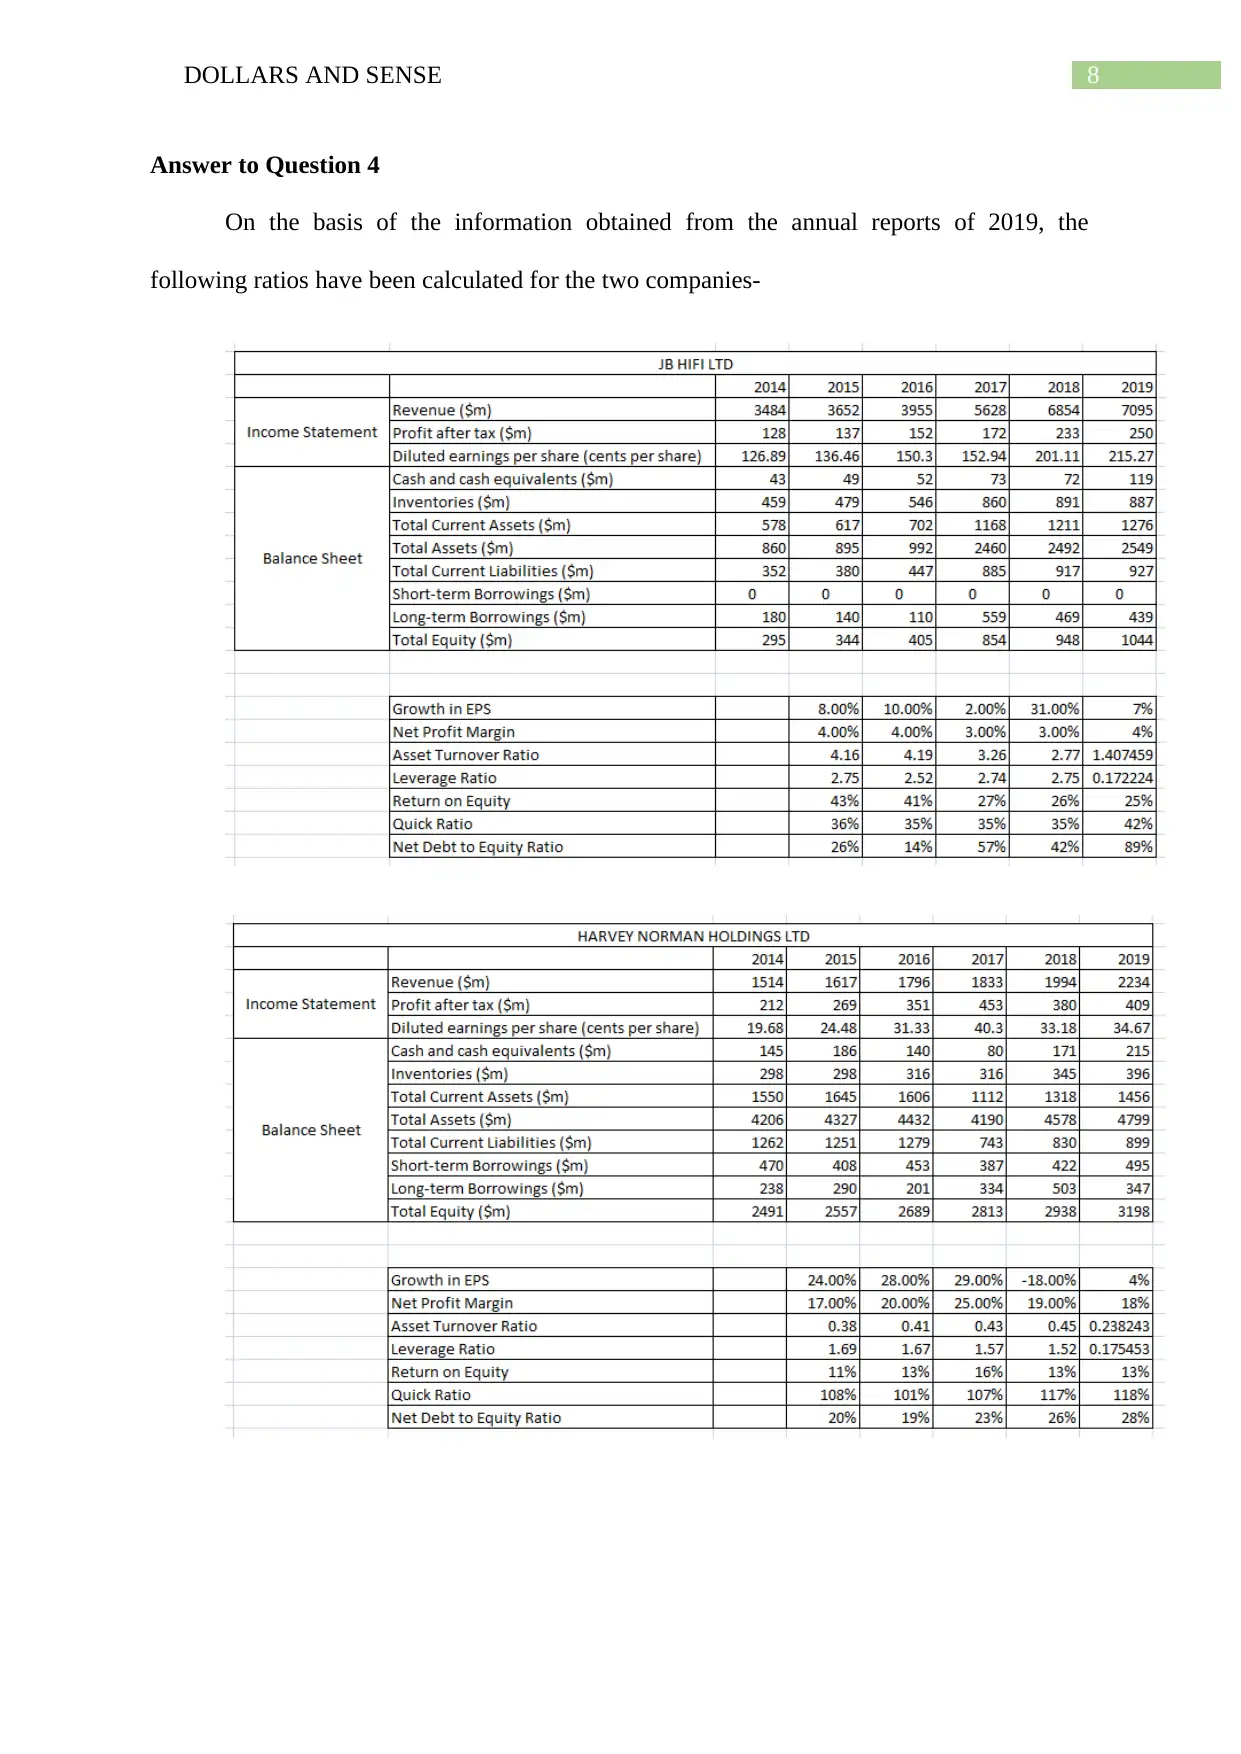
This case study, titled "Dollars and Sense," presents a financial analysis of two distinct scenarios. The first case involves evaluating the financial viability of opening a gym franchise, encompassing calculations for contribution margin, fixed costs, break-even points, net profit, free cash flow, net present value, and profitability index. It also addresses the risks associated with the investment and provides a recommendation. The second case analyzes the performance of two companies, JB Hifi Limited and Harvey Norman Holdings Limited, over a five-year period. It calculates holding period returns, expected returns, and total shareholder returns. The analysis extends to financial ratios, including earnings per share, net profit margin, asset turnover, leverage, return on equity, and quick ratio, culminating in a comparative assessment of the companies' performances and a DuPont analysis to understand the drivers of return on equity.
Document Page
Running head: DOLLARS AND SENSE
Dollars and Sense
Name of the Student:
Name of the University:
Author Note
tabler-icon-diamond-filled.svg

Paraphrase This Document

Need a fresh take? Get an instant paraphrase of this document with our AI Paraphraser
Document Page
1DOLLARS AND SENSE
Table of Contents
CASE STUDY 1........................................................................................................................2
Answer to Question 1.............................................................................................................2
Answer to Question 2.............................................................................................................2
Answer to Question 3.............................................................................................................2
Answer to Question 4.............................................................................................................3
Answer to Question 5.............................................................................................................3
Answer to Question 6.............................................................................................................4
Answer to Question 7.............................................................................................................4
Answer to Question 8.............................................................................................................4
Answer to Question 9.............................................................................................................4
CASE STUDY 2........................................................................................................................6
Answer to Question 1.............................................................................................................6
Answer to Question 2.............................................................................................................7
Answer to Question 3.............................................................................................................7
Answer to Question 4.............................................................................................................8
Answer to Question 5.............................................................................................................9
Answer to Question 6...........................................................................................................10
Reference list............................................................................................................................11
Document Page
2DOLLARS AND SENSE
CASE STUDY 1
Answer to Question 1
The contribution margin per member per year -
Answer to Question 2
Calculation of the yearly fixed costs that would be incurred by John-
Answer to Question 3
Calculation of the break-even number of gym members per year-
Document Page
3DOLLARS AND SENSE
Answer to Question 4
Calculation of Net Profit each year for the first three years of operation-
Answer to Question 5
Estimation of the free cash flow generated by the franchise every year for the first
three years of operation-
tabler-icon-diamond-filled.svg

Paraphrase This Document

Need a fresh take? Get an instant paraphrase of this document with our AI Paraphraser
Document Page
4DOLLARS AND SENSE
Answer to Question 6
Calculation of the Net Present Value of the business-
Answer to Question 7
Calculation of the Profitability Index-
Answer to Question 8
The financial viability of the investment has been recommended to John. As the
profitability index of the business is 0.72 which is less than 1, it represents the deficit in the
cash outflow that is more than the discounted cash inflows. The present value of the project is
lesser than its initial investment. The low index decreases the financial attractiveness of the
project. Therefore, it is recommended to him to not accept the project.
Answer to Question 9
The analysis of the major risks faced by John in making the investment are financial,
equipment and injury. The opening of a gym requires proper placing of the basic business
structure (Andreasson and Johansson 2014). It must be in a locality which will attract
Document Page
5DOLLARS AND SENSE
customers and must be properly marketed. Without the proper financial planning, he will be
exposed to the risk of loss of his investment. In addition to this he also needs to have a well-
planned management structure that will help him to curb the risks (Kaushal and Rhodes
2015). He must ensure that the equipment’s are working in proper order. The placement of
the equipment’s should not cause injury to the customers (Müller et al. 2015). The guidelines
offered by the American College of Sports Medicine will help him to prevent the risks
relating to the equipment’s. The clients sign the informed consent form that agrees to their
participation of using the gym equipment’s and release the claim against John (Slater et al.
2016). However, he must still provide protection for the accidental injuries that may be
caused to the clients.
Document Page
6DOLLARS AND SENSE
CASE STUDY 2
Answer to Question 1
Calculation of the Holding Period Return for the companies for each year from 30
June 2014 to 30 June 2019-
tabler-icon-diamond-filled.svg

Paraphrase This Document

Need a fresh take? Get an instant paraphrase of this document with our AI Paraphraser
Document Page
7DOLLARS AND SENSE
Answer to Question 2
Estimation of the Expected Return for JB Hifi Limited and Harvey Norman Holdings
Limited based on the five-year historical sample of returns-
Answer to Question 3
Calculation of the Total Return to Shareholders of the companies over the five year
period from 30 June 2014 to 30 June 2019 using the formula-
Document Page
8DOLLARS AND SENSE
Answer to Question 4
On the basis of the information obtained from the annual reports of 2019, the
following ratios have been calculated for the two companies-
Document Page
9DOLLARS AND SENSE
Answer to Question 5
The ratios and Total Return to Shareholders that have been calculated from the year
2015 to year 2019 for JB Hifi Limited and Harvey Norman Holdings Limited and the
performances have been analyzed. The Total Return to Shareholders of Harvey Norman
Holdings Limited is more at a value of 21.18% as compared to that of JB Hifi Limited having
a value of 18.31%. The trend in the growth of Earnings per Share has been fluctuating for JB
Hifi Limited as well as for Harvey Norman Holdings Limited. It has also been negative for
Harvey Norman Holdings Limited in the year 2018 due to the decrease in its value from the
previous year. The Net Profit Margin has also fluctuated for both the companies but the
values of Harvey Norman Holdings Limited have been higher than that of JB Hifi Limited.
This has been reflected by the change in Revenue and Profit after tax. The Asset Turnover for
JB Hifi Limited has shown a declining trend whereas for Harvey Norman Holdings it grew
till the 2018 after which it again dropped. The increase in the Total Assets and Revenue was
reflected by the ratio. The Leverage Ratio dropped drastically for JB Hifi Limited in 2019
due to the decrease in its borrowings while it fluctuated for Harvey Norman Holdings
Limited over the 5 years (Brei and Gambacorta 2014). The Return on Equity has decreased
for JB Hifi Limited while it increased initially till the year 2017 for Harvey Norman Holdings
and decreased till 2019. The Quick Ratio for JB Hifi Limited initially showed a declining
trend till 2018 as the Profit after tax as well as the Total Equity decreased and increased again
for 2019 (Oshoke and Sumaina 2015). Harvey Norman Holdings had huge fluctuating values
in its Quick Ratio. The Net Debt to Equity Ratio for JB Hifi Limited fluctuated over the 5
years and finally increased to 3 times in 2019 from 2014 while it increased marginally for
Harvey Norman Holdings Limited due to the increase in the Total Equity of the companies
(Lewis and Tan 2016). Therefore, the overall performance of Harvey Norman Holdings
Limited is in a favorable position on comparison to that of JB Hifi Limited.
tabler-icon-diamond-filled.svg

Paraphrase This Document

Need a fresh take? Get an instant paraphrase of this document with our AI Paraphraser
Document Page
10DOLLARS AND SENSE
Answer to Question 6
The Return on Equity has been calculated by using the DuPont analysis and the
changes have been justified which can be implemented by the underperforming companies to
improve their performance in future. The Net Profit Margin of JB Hifi Limited has been more
than that of Harvey Norman Holdings Limited. The Asset Turnover has shown a declining
trend in the case of JB Hifi Limited whereas an increasing trend for Harvey Norman
Holdings Limited (Mihola, Kotesovcova and Wawrosz 2016). The Leverage of both
companies have reduced. The overall Return on Equity for Harvey Norman Holdings Limited
has increased over the 5 years and decreased for JB Hifi Limited. Therefore, the operational
efficiency of Harvey Norman Holdings Limited is favorable. It gives the investors
information relating to the financial activities of the company that contribute towards the
changes in their Return on Equity. It also helps the managers in identifying the strengths and
weaknesses of the company that require attention.
Document Page
11DOLLARS AND SENSE
Reference list
Andreasson, J. and Johansson, T., 2014. The fitness revolution. Historical transformations in
the global gym and fitness culture. Sport science review, 23(3-4), pp.91-111.
Brei, M. and Gambacorta, L., 2014. The leverage ratio over the cycle.
Kaushal, N. and Rhodes, R.E., 2015. Exercise habit formation in new gym members: a
longitudinal study. Journal of Behavioral Medicine, 38(4), pp.652-663.
Lewis, C.M. and Tan, Y., 2016. Debt-equity choices, R&D investment and market
timing. Journal of financial economics, 119(3), pp.599-610.
Mihola, J., Kotesovcova, J. and Wawrosz, P., 2016. Intensity and Extensity of Firm
Development and Dynamic Dupont Analysis. European Research Studies, 19(4), p.53.
Müller, A., Loeber, S., Söchtig, J., Te Wildt, B. and De Zwaan, M., 2015. Risk for exercise
dependence, eating disorder pathology, alcohol use disorder and addictive behaviors among
clients of fitness centers. Journal of behavioral addictions, 4(4), pp.273-280.
Oshoke, A.S. and Sumaina, J., 2015. Performance evaluation through ratio analysis. Journal
of Accounting and Financial Management, 1, pp.1-10.
Slater, J., McLay-Cooke, R., Brown, R. and Black, K., 2016. Female recreational exercisers
at risk for low energy availability. International journal of sport nutrition and exercise
metabolism, 26(5), pp.421-427.
chevron_up_icon
1 out of 12
circle_padding
hide_on_mobile
zoom_out_icon
[object Object]