DATA5207: Analyzing Domestic Violence in Australia - Report
VerifiedAdded on 2023/04/20
|7
|2131
|159
Report
AI Summary
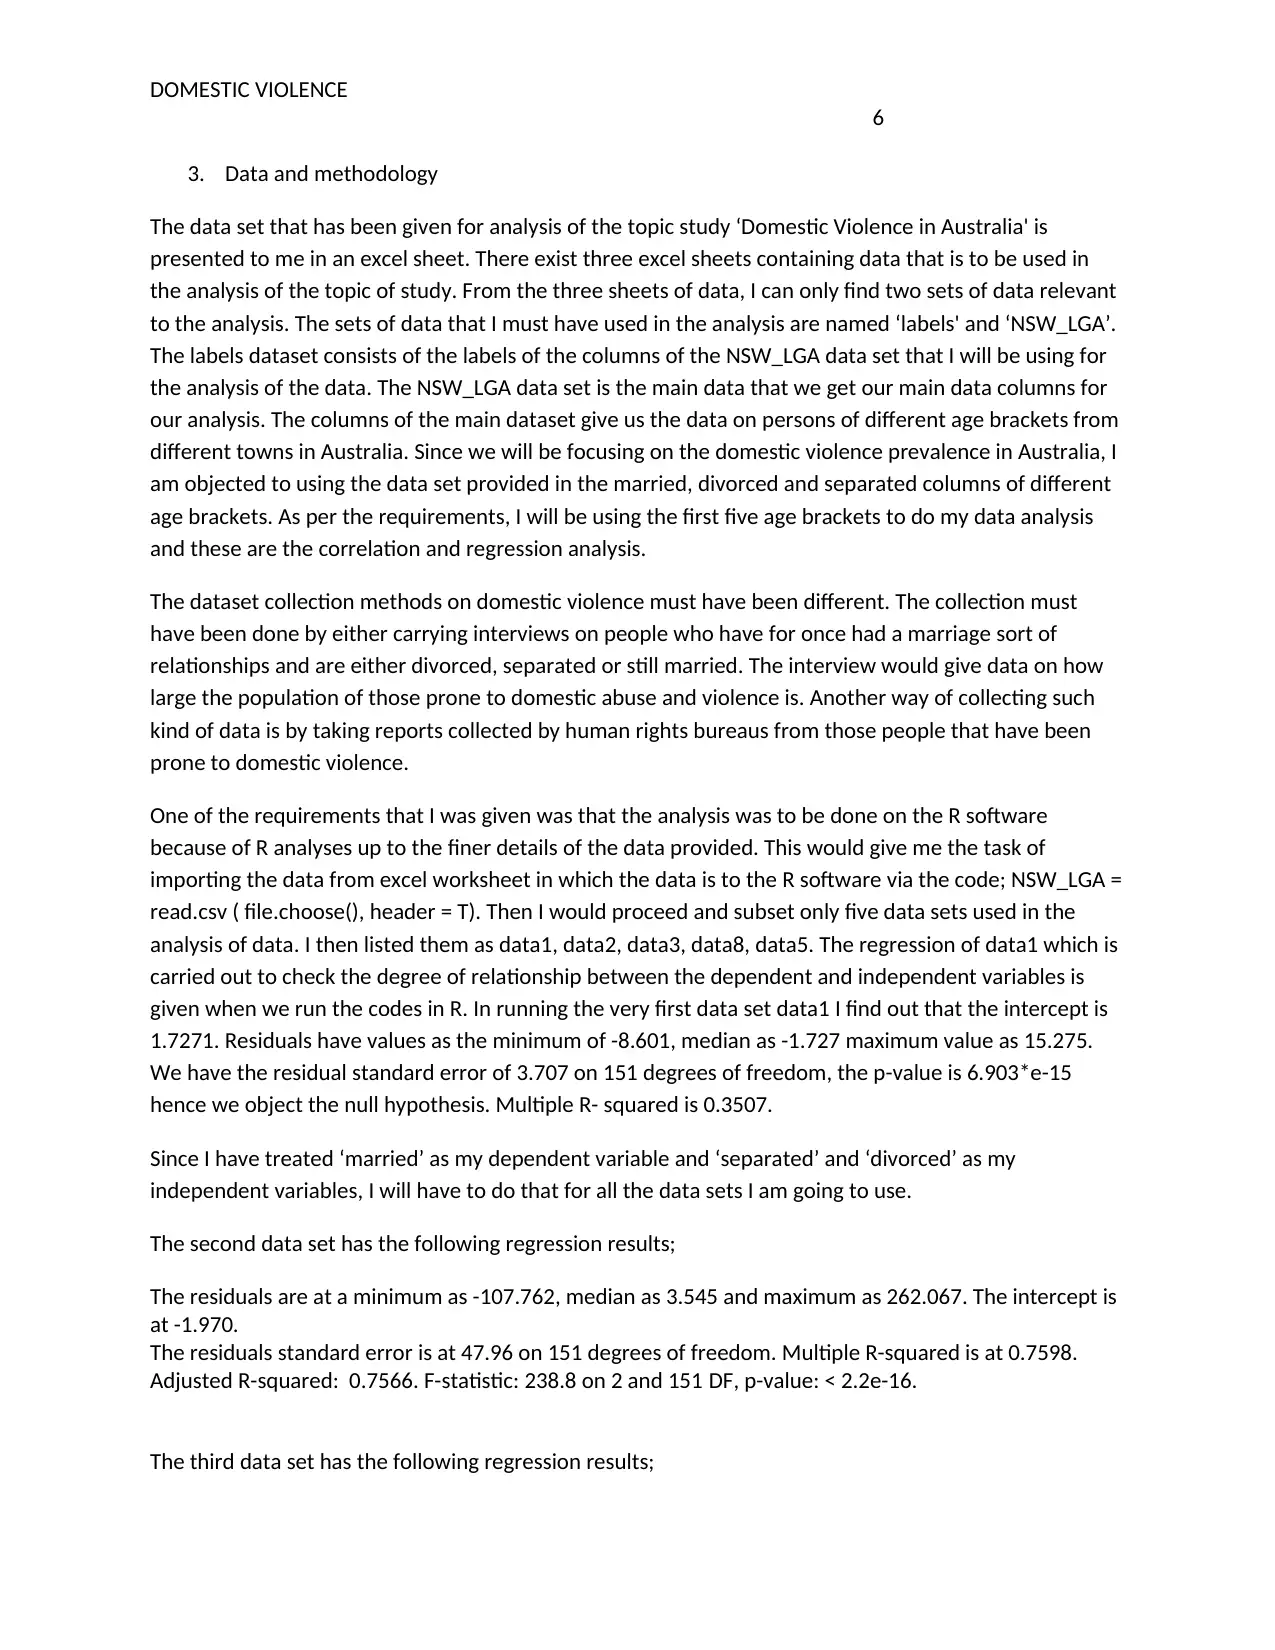
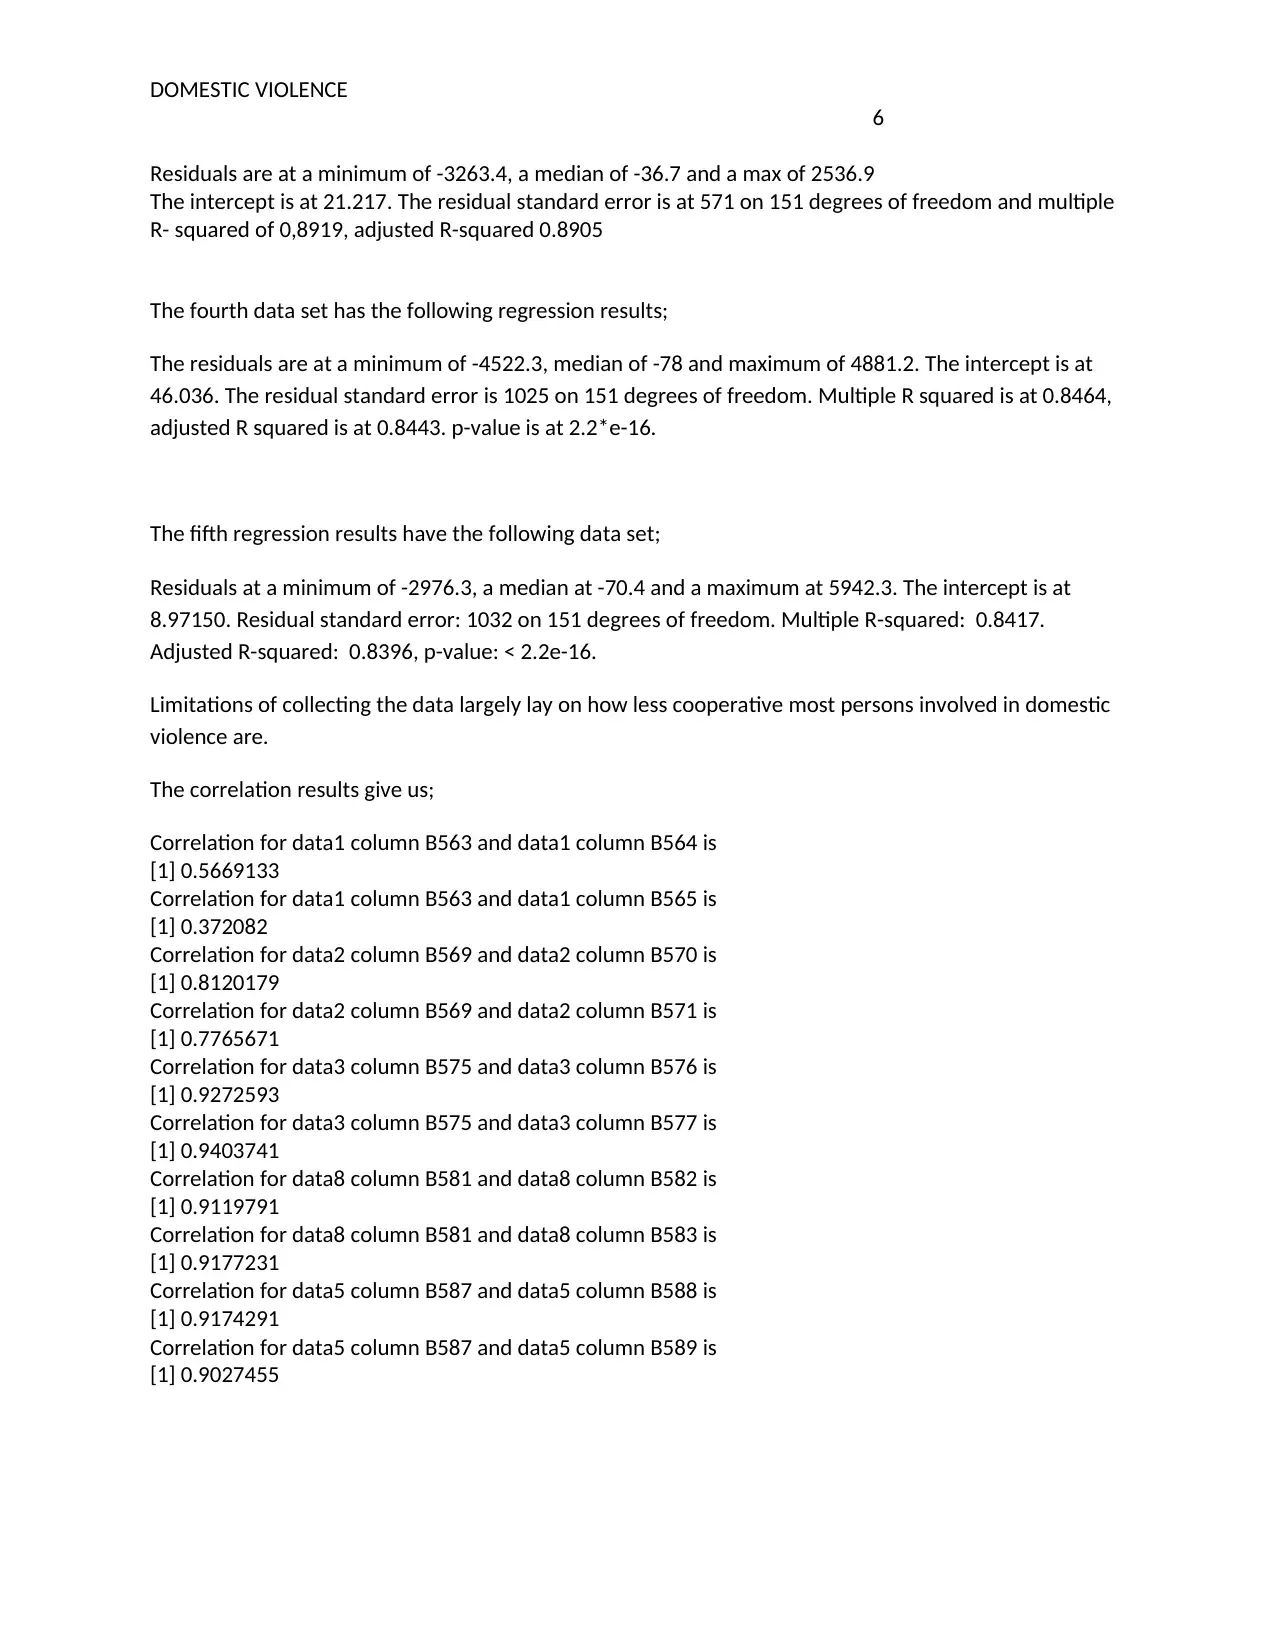
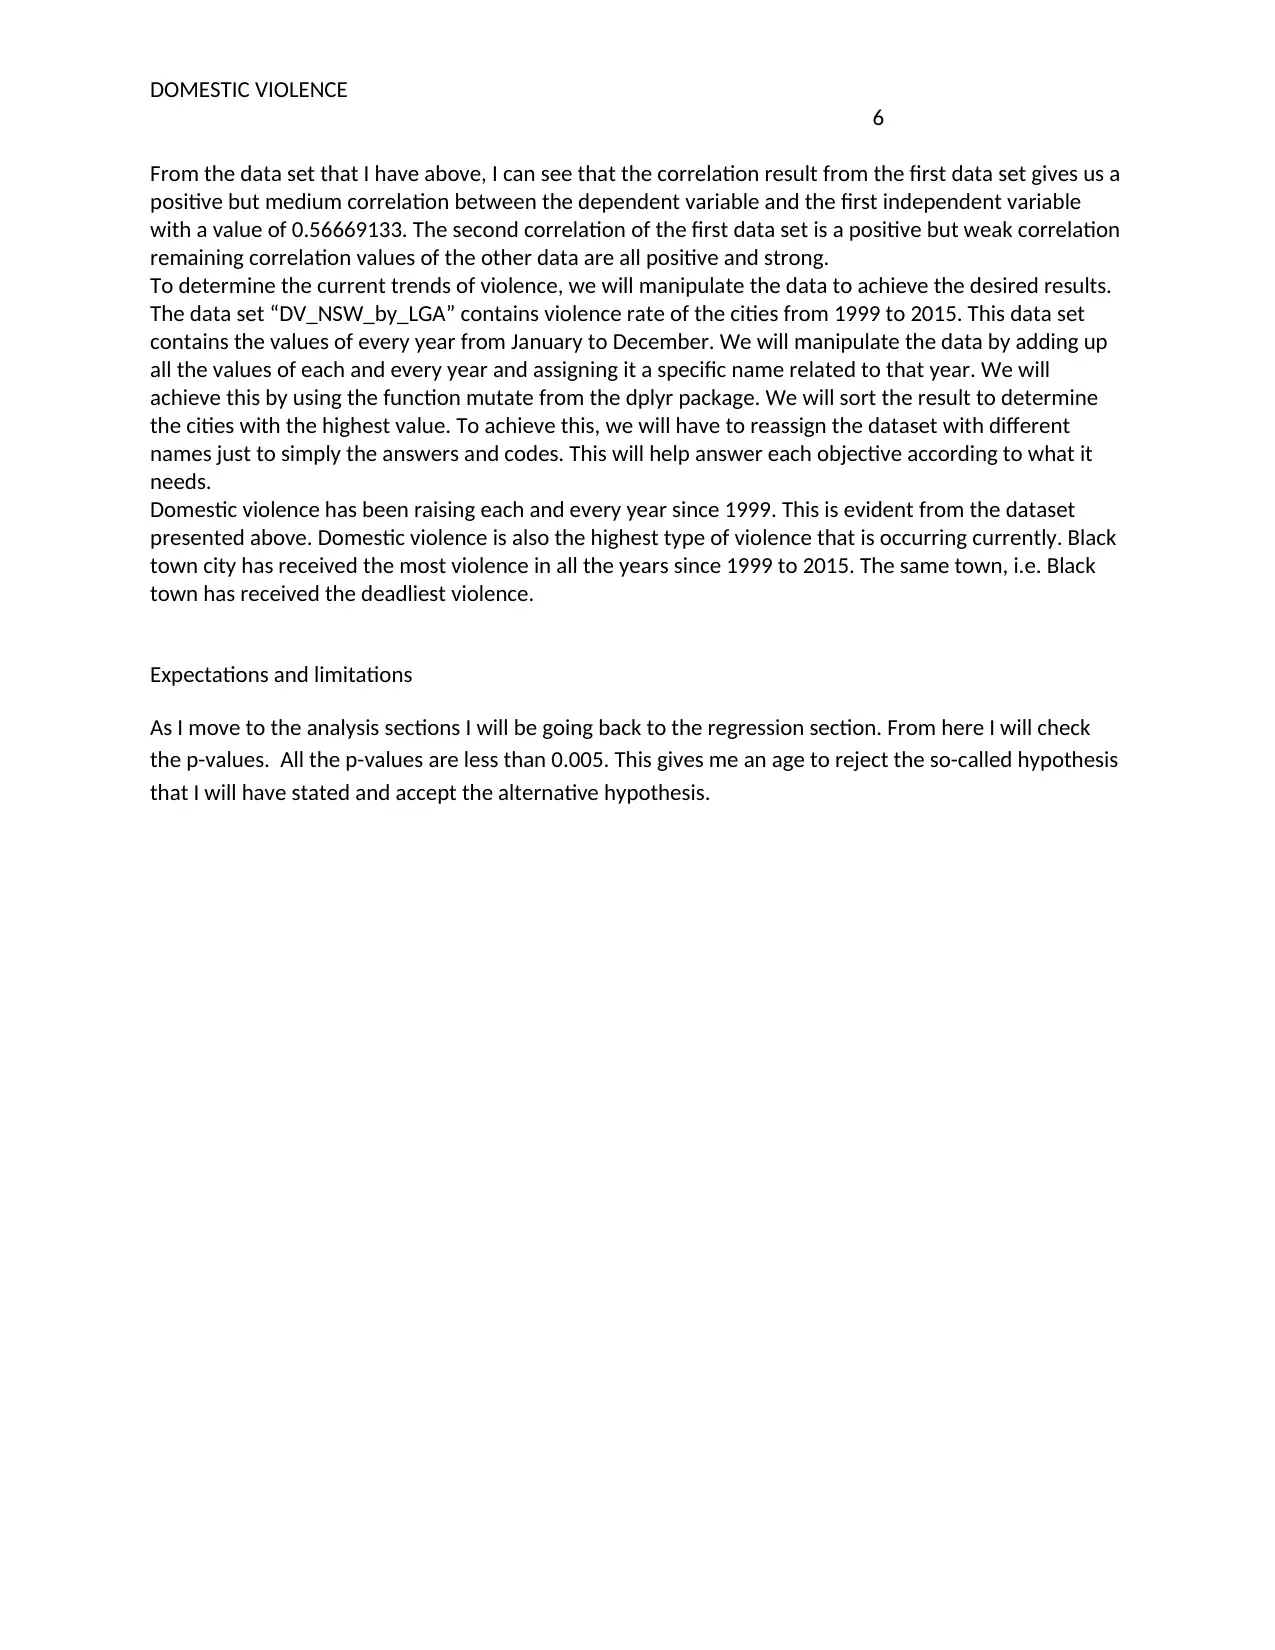
This report presents an analysis of domestic violence in Australia, focusing on data from various towns and age brackets. The study employs data from the NSW_LGA dataset, utilizing the married, divorced, and separated columns for correlation and regression analysis. The methodology involves using R software to analyze the data, including correlation and regression analysis across five age brackets. The analysis includes regression results for multiple datasets, calculating intercepts, residuals, and p-values to assess the relationships between married individuals and those separated or divorced. Correlation results are presented to determine the strength of relationships between variables. The data set “DV_NSW_by_LGA” is also used to determine violence rates from 1999 to 2015, using the mutate function from the dplyr package to determine yearly trends and identify cities with the highest violence rates. The report concludes by discussing expectations and limitations of the analysis, including the rejection of a null hypothesis based on p-values.
Contribute Materials
Your contribution can guide someone’s learning journey. Share your
documents today.

Running head: DOMESTIC VIOLENCE
1
TOPIC
NAME OF AUTHOR
NAME OF CLASS
NAME OF PROFESSOR
NAME OF SCHOOL
CITY AND STATE OF SCHOOL
1
TOPIC
NAME OF AUTHOR
NAME OF CLASS
NAME OF PROFESSOR
NAME OF SCHOOL
CITY AND STATE OF SCHOOL
Secure Best Marks with AI Grader
Need help grading? Try our AI Grader for instant feedback on your assignments.

DOMESTIC VIOLENCE
6
Table of Contents
1. Introduction
2. Literature and theory
3. Data and methodology
4. Expectations and limitations
5. Bibliography
6
Table of Contents
1. Introduction
2. Literature and theory
3. Data and methodology
4. Expectations and limitations
5. Bibliography

DOMESTIC VIOLENCE
6
1. Introduction
Domestic violence for a very long time has been opposed by the human rights bureaus. Women and
men in different countries have set up bodies that actually do not allow both sexes to brutally treat one
another in violent ways. But in all of that effort, we still find in our society, that those who are married
still get tangled up in domestic abuses in the domestic setups in which they are in. This would mean that
the acts which cause the problems of domestic violence are often overlooked, contradicted and let off
the hook. This causes a great problem for those seeking justice for such kinds of abuse. Men in the
recent past have recorded a rise in abuse from their spouses unlike the case of the past where women
were the ones who were mostly abused in various communities. This has been hard for the larger
population to believe, leaving the male generation to silently suffer as we find out that their reports on
domestic violence from their spouses to them are more frequently ignored. Domestic abuse which in
most cases leads to domestic violence is descriptive of a person trying to dominate and rule the other.
Abuses can be to any class, age and economic status. Abuses can be physical or emotional. Men on the
raider experience verbal and emotional abuses, when we are to mention but just a few. There are
different signs of domestic abuses that might eventually lead to domestic violence; fear of one partner is
an example, a partner belittling you and controlling you. After mentioning all that is above, we will now
focus on the analysis of domestic violence in Australia. From the data that we have been provided with I
realize that there is a vast spread of domestic violence in most towns of the country.
From this one we arrive at the thesis statement; there is no domestic violence that is adversely spread in
the towns of Australia. This is a statement that is adversely disputed by the data given for our analysis.
2. Literature and theory
This part asks us to write a literature review. We have a working topic, domestic violence in Australia.
According to the scholarly literature on domestic abuse and violence expounds on different matters
according to as per the different types of communities and different ways of lives. As you can see from
the data that is given, we realize that even in a country with a strong economic standing as Australia
there still exists serious violence domestically in most towns. According to scholarly literature on family,
domestic and sexual violence in Australia, we can find out that the actual reason as to why violence and
abuse exists is because of an individual's insecurity. Insecurity spans differently in different sexes. A man
can be insecure over losing the intimate relator that he has. A woman can be insecure of losing the man
as well or just losing the extent of wealth the man has in case the man gets to marry another woman.
But in all that we see, there are different ways of dealing with abuse stress in a relationship according to
the literature. One major way is by first understanding and accepting the status quo of the partners
since acceptance is a key step towards healing and this helps largely more so when it comes to settling
drama in a relationship.

DOMESTIC VIOLENCE
6
3. Data and methodology
The data set that has been given for analysis of the topic study ‘Domestic Violence in Australia' is
presented to me in an excel sheet. There exist three excel sheets containing data that is to be used in
the analysis of the topic of study. From the three sheets of data, I can only find two sets of data relevant
to the analysis. The sets of data that I must have used in the analysis are named ‘labels' and ‘NSW_LGA’.
The labels dataset consists of the labels of the columns of the NSW_LGA data set that I will be using for
the analysis of the data. The NSW_LGA data set is the main data that we get our main data columns for
our analysis. The columns of the main dataset give us the data on persons of different age brackets from
different towns in Australia. Since we will be focusing on the domestic violence prevalence in Australia, I
am objected to using the data set provided in the married, divorced and separated columns of different
age brackets. As per the requirements, I will be using the first five age brackets to do my data analysis
and these are the correlation and regression analysis.
The dataset collection methods on domestic violence must have been different. The collection must
have been done by either carrying interviews on people who have for once had a marriage sort of
relationships and are either divorced, separated or still married. The interview would give data on how
large the population of those prone to domestic abuse and violence is. Another way of collecting such
kind of data is by taking reports collected by human rights bureaus from those people that have been
prone to domestic violence.
One of the requirements that I was given was that the analysis was to be done on the R software
because of R analyses up to the finer details of the data provided. This would give me the task of
importing the data from excel worksheet in which the data is to the R software via the code; NSW_LGA =
read.csv ( file.choose(), header = T). Then I would proceed and subset only five data sets used in the
analysis of data. I then listed them as data1, data2, data3, data8, data5. The regression of data1 which is
carried out to check the degree of relationship between the dependent and independent variables is
given when we run the codes in R. In running the very first data set data1 I find out that the intercept is
1.7271. Residuals have values as the minimum of -8.601, median as -1.727 maximum value as 15.275.
We have the residual standard error of 3.707 on 151 degrees of freedom, the p-value is 6.903*e-15
hence we object the null hypothesis. Multiple R- squared is 0.3507.
Since I have treated ‘married’ as my dependent variable and ‘separated’ and ‘divorced’ as my
independent variables, I will have to do that for all the data sets I am going to use.
The second data set has the following regression results;
The residuals are at a minimum as -107.762, median as 3.545 and maximum as 262.067. The intercept is
at -1.970.
The residuals standard error is at 47.96 on 151 degrees of freedom. Multiple R-squared is at 0.7598.
Adjusted R-squared: 0.7566. F-statistic: 238.8 on 2 and 151 DF, p-value: < 2.2e-16.
The third data set has the following regression results;
Secure Best Marks with AI Grader
Need help grading? Try our AI Grader for instant feedback on your assignments.

DOMESTIC VIOLENCE
6
Residuals are at a minimum of -3263.4, a median of -36.7 and a max of 2536.9
The intercept is at 21.217. The residual standard error is at 571 on 151 degrees of freedom and multiple
R- squared of 0,8919, adjusted R-squared 0.8905
The fourth data set has the following regression results;
The residuals are at a minimum of -4522.3, median of -78 and maximum of 4881.2. The intercept is at
46.036. The residual standard error is 1025 on 151 degrees of freedom. Multiple R squared is at 0.8464,
adjusted R squared is at 0.8443. p-value is at 2.2*e-16.
The fifth regression results have the following data set;
Residuals at a minimum of -2976.3, a median at -70.4 and a maximum at 5942.3. The intercept is at
8.97150. Residual standard error: 1032 on 151 degrees of freedom. Multiple R-squared: 0.8417.
Adjusted R-squared: 0.8396, p-value: < 2.2e-16.
Limitations of collecting the data largely lay on how less cooperative most persons involved in domestic
violence are.
The correlation results give us;
Correlation for data1 column B563 and data1 column B564 is
[1] 0.5669133
Correlation for data1 column B563 and data1 column B565 is
[1] 0.372082
Correlation for data2 column B569 and data2 column B570 is
[1] 0.8120179
Correlation for data2 column B569 and data2 column B571 is
[1] 0.7765671
Correlation for data3 column B575 and data3 column B576 is
[1] 0.9272593
Correlation for data3 column B575 and data3 column B577 is
[1] 0.9403741
Correlation for data8 column B581 and data8 column B582 is
[1] 0.9119791
Correlation for data8 column B581 and data8 column B583 is
[1] 0.9177231
Correlation for data5 column B587 and data5 column B588 is
[1] 0.9174291
Correlation for data5 column B587 and data5 column B589 is
[1] 0.9027455

DOMESTIC VIOLENCE
6
From the data set that I have above, I can see that the correlation result from the first data set gives us a
positive but medium correlation between the dependent variable and the first independent variable
with a value of 0.56669133. The second correlation of the first data set is a positive but weak correlation
remaining correlation values of the other data are all positive and strong.
To determine the current trends of violence, we will manipulate the data to achieve the desired results.
The data set “DV_NSW_by_LGA” contains violence rate of the cities from 1999 to 2015. This data set
contains the values of every year from January to December. We will manipulate the data by adding up
all the values of each and every year and assigning it a specific name related to that year. We will
achieve this by using the function mutate from the dplyr package. We will sort the result to determine
the cities with the highest value. To achieve this, we will have to reassign the dataset with different
names just to simply the answers and codes. This will help answer each objective according to what it
needs.
Domestic violence has been raising each and every year since 1999. This is evident from the dataset
presented above. Domestic violence is also the highest type of violence that is occurring currently. Black
town city has received the most violence in all the years since 1999 to 2015. The same town, i.e. Black
town has received the deadliest violence.
Expectations and limitations
As I move to the analysis sections I will be going back to the regression section. From here I will check
the p-values. All the p-values are less than 0.005. This gives me an age to reject the so-called hypothesis
that I will have stated and accept the alternative hypothesis.

DOMESTIC VIOLENCE
6
References
A team, R.C., 2014. R: A language and environment for statistical computing.
Harris, P.A., Taylor, R., Thielke, R., Payne, J., Gonzalez, N. and Conde, J.G., 2009. Research electronic data
capture (REDCap)—a metadata-driven methodology and workflow process for providing translational
research informatics support. Journal of biomedical informatics, 42(2), pp.377-381.
Darlington, R.B. and Hayes, A.F., 2016. Regression analysis and linear models: Concepts, applications,
and implementation. Guilford Publications.
Cichocki, A., Zdunek, R., Phan, A.H. and Amari, S.I., 2009. Nonnegative matrix and tensor factorizations:
applications to exploratory multi-way data analysis and blind source separation. John Wiley & Sons.
1 out of 7
Related Documents

Your All-in-One AI-Powered Toolkit for Academic Success.
+13062052269
info@desklib.com
Available 24*7 on WhatsApp / Email
Unlock your academic potential
© 2024 | Zucol Services PVT LTD | All rights reserved.