Relational Database Design and Analysis for Dominican College
VerifiedAdded on 2024/05/17
|62
|6553
|328
Report
AI Summary
This report provides a comprehensive analysis and design of a relational database system for Dominican College. It begins with an overview of different data models, including network, hierarchical, and relational models, along with a comparison of their benefits and limitations. The report also discusses various database technologies and their respective advantages and disadvantages. A significant portion of the report is dedicated to the design and implementation of a relational database system, covering conceptual, logical, and physical schemas, along with normalization techniques. The implementation phase involves creating tables, forms, queries, and reports using a database management system. The report also details the use of manipulation and query tools, specifically SQL, to extract meaningful data from the database. Testing and documentation are crucial aspects, and the report includes test plans, feedback forms, test cases, and user documentation to ensure the system's reliability and usability. Verification and validation methods are also discussed, along with control mechanisms to maintain data integrity.
Data Analysis and
Design
Student Name:
Student ID:
Design
Student Name:
Student ID:
Paraphrase This Document
Need a fresh take? Get an instant paraphrase of this document with our AI Paraphraser
Contents
Introduction...............................................................................................................................6
LO1 Understand data models and database technologies........................................................7
1.1 Critically compare different data models and schemas...................................................7
1.2 Critically discuss the benefits and limitations of different database technologies.......12
1.3 Analyse different approaches to database design.........................................................14
LO2 Be able to design and implement relational database systems.......................................15
2.1 design a relational database system to meet a given requirement...............................15
2.2 Build a relational database system based on a prepared design...................................19
2.3 Apply a range of database tools and techniques to enhance the user interface..........23
LO3 Be able to use manipulation and querying tools..............................................................27
3.1 Explain the benefits of using manipulation and query tools in a relational database
system...................................................................................................................................27
3.2 Implement a query language into the relational database system that has been
implemented........................................................................................................................29
3.3. Critically evaluates how meaningful data has been extracted through the use of query
tools for the given case study...............................................................................................38
LO4 Be able to test and document relational database systems............................................42
4.1 critically reviews and tests the implemented relational database system....................42
4.2 Create documentation to support the implementation and testing of a relational
database system...................................................................................................................43
4.3 Create user documentation for a developed relational database system.....................47
4.4 Explain how verification and validation has been addressed........................................54
4.5 Explain how control mechanisms have been used........................................................55
Conclusion................................................................................................................................58
References................................................................................................................................59
1
List of Figures
Figure 1 Network Data Model....................................................................................................7
Figure 2 Hierarchal Data Model.................................................................................................8
Figure 3 Relational Data Model..................................................................................................9
Figure 4 Physical Schema.........................................................................................................10
Figure 5 Logical Schema...........................................................................................................11
Figure 6 Conceptual Schema....................................................................................................11
Figure 7 Relationship diagram.................................................................................................16
Figure 8 Conceptual Diagram...................................................................................................16
Figure 9 Logical Diagram..........................................................................................................17
Figure 10 Academic Manager Table.........................................................................................19
Figure 11 Academic Manager Datasheet view........................................................................19
Figure 12 Admin Table.............................................................................................................20
Figure 13 Admin Datasheet view.............................................................................................20
Figure 14 Campus Table...........................................................................................................20
Figure 15 Campus Datasheet view...........................................................................................20
Figure 16 Course Table.............................................................................................................20
Figure 17 Course Datasheet view............................................................................................21
Figure 18 Lecturer Table..........................................................................................................21
Figure 19 Lecturer Datasheet View..........................................................................................21
Figure 20 Student Table...........................................................................................................21
Figure 21 Student Datasheet View..........................................................................................22
Figure 22 Units Table...............................................................................................................22
Figure 23 Units Datasheet view...............................................................................................22
Figure 24Units Datasheet view................................................................................................23
Figure 25 Student Table...........................................................................................................23
Figure 26 Relationship..............................................................................................................24
Figure 27 Academic manager form..........................................................................................24
Figure 28Admin form...............................................................................................................25
2
⊘ This is a preview!⊘
Do you want full access?
Subscribe today to unlock all pages.
Trusted by 1+ million students worldwide
Figure 29 Academic manager report.......................................................................................25
Figure 30 Admin report............................................................................................................26
Figure 31 Query1 design view..................................................................................................29
Figure 32 Query1 output..........................................................................................................29
Figure 33 Query1 Report view.................................................................................................30
Figure 34 Query2 design view..................................................................................................31
Figure 35 Query2 Output.........................................................................................................31
Figure 36 Query2 Report view.................................................................................................31
Figure 37 Query3 Design view.................................................................................................32
Figure 38 Query3 Output.........................................................................................................32
Figure 39 Query3 Report view.................................................................................................32
Figure 40 Query4 design view..................................................................................................34
Figure 41 Query4 output..........................................................................................................34
Figure 42 Query4 Report view.................................................................................................34
Figure 43 Query5 design view..................................................................................................35
Figure 44 Query5 Output.........................................................................................................35
Figure 45 Query5 Report view.................................................................................................36
Figure 46 Query6 Design view.................................................................................................37
Figure 47 Query6 output..........................................................................................................37
Figure 48 Query6 report view..................................................................................................37
Figure 49 Academic Manager Query.......................................................................................38
Figure 50 Output of Academic Manager Query.......................................................................38
Figure 51 admin query.............................................................................................................38
Figure 52 Output of Admin query............................................................................................39
Figure 53 Courses Query..........................................................................................................39
Figure 54 Output of Course Query...........................................................................................39
Figure 55 Lecturer Query.........................................................................................................40
Figure 56 Output of Lecture Query..........................................................................................40
Figure 57 Student Query..........................................................................................................41
Figure 58 Output of Student Query.........................................................................................41
Figure 59 Test 1........................................................................................................................44
Figure 60 test-2........................................................................................................................44
3
Paraphrase This Document
Need a fresh take? Get an instant paraphrase of this document with our AI Paraphraser
Figure 61 test-3........................................................................................................................44
Figure 62 test 4.........................................................................................................................45
Figure 63 test 5.........................................................................................................................45
Figure 64 test 6.........................................................................................................................46
Figure 65 Academic manager form..........................................................................................47
Figure 66 Academic-manager report.......................................................................................48
Figure 67 Admin Form..............................................................................................................48
Figure 68 Academic report.......................................................................................................49
Figure 69 Course Form.............................................................................................................49
Figure 70 Course Report..........................................................................................................50
Figure 71 Campus Report.........................................................................................................50
Figure 72 Campus Report.........................................................................................................51
Figure 73 Lecturer Form...........................................................................................................51
Figure 74 Lecturer Report........................................................................................................52
Figure 75 Student Form...........................................................................................................52
Figure 76 Student Report.........................................................................................................52
Figure 77 Units Form................................................................................................................53
Figure 78 Units Report.............................................................................................................53
Figure 79 Validation in Lecturer Table.....................................................................................54
Figure 80 Academic manager control mechanism..................................................................55
Figure 81 academic manager control mechanism...................................................................56
Figure 82 lecture table control mechanism.............................................................................57
4
List of Tables
Table 1 Benefits and Limitation of Different Technologies......................................................12
Table 2 First normal form.........................................................................................................17
Table 3 Second normal form....................................................................................................18
Table 4 Third normal form.......................................................................................................18
Table 5 feedback......................................................................................................................42
Table 6 Test cases.....................................................................................................................43
5
⊘ This is a preview!⊘
Do you want full access?
Subscribe today to unlock all pages.
Trusted by 1+ million students worldwide
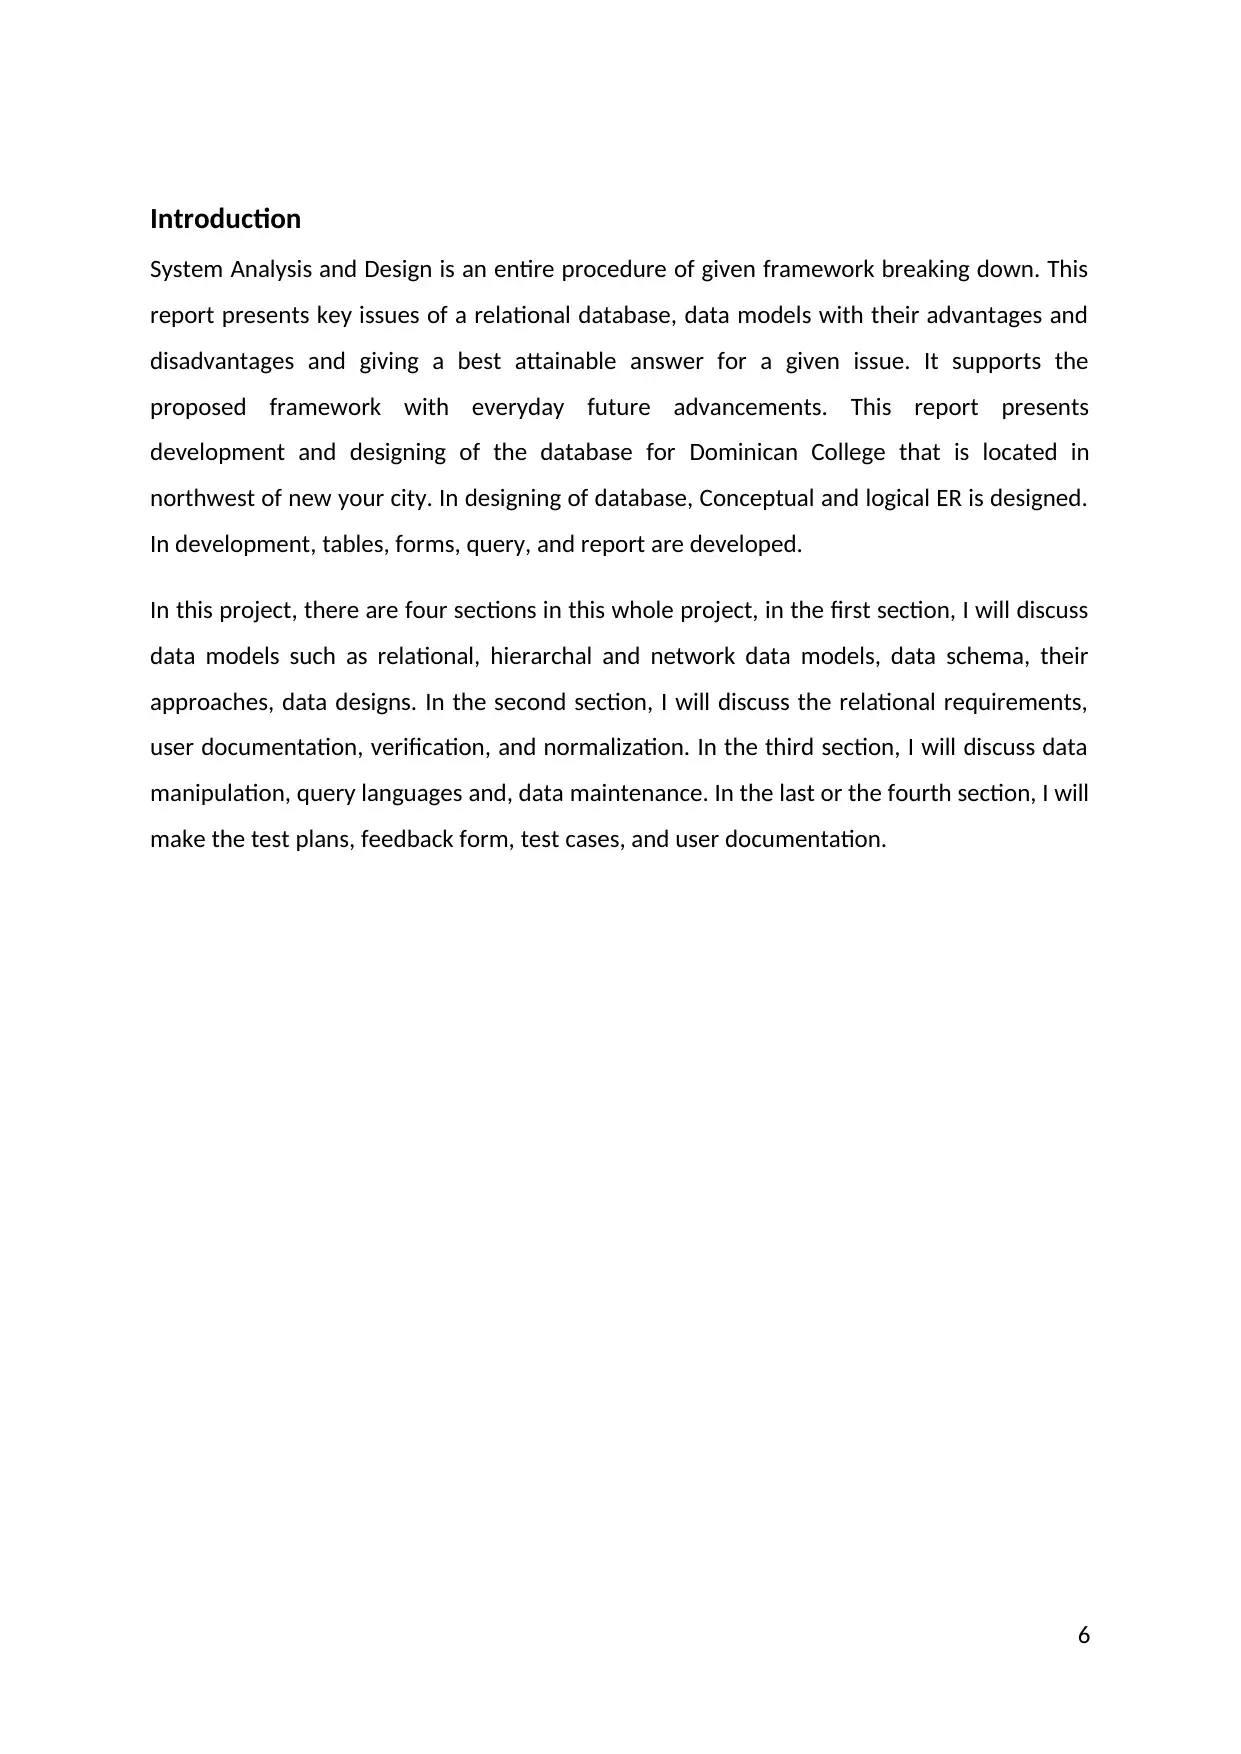
Introduction
System Analysis and Design is an entire procedure of given framework breaking down. This
report presents key issues of a relational database, data models with their advantages and
disadvantages and giving a best attainable answer for a given issue. It supports the
proposed framework with everyday future advancements. This report presents
development and designing of the database for Dominican College that is located in
northwest of new your city. In designing of database, Conceptual and logical ER is designed.
In development, tables, forms, query, and report are developed.
In this project, there are four sections in this whole project, in the first section, I will discuss
data models such as relational, hierarchal and network data models, data schema, their
approaches, data designs. In the second section, I will discuss the relational requirements,
user documentation, verification, and normalization. In the third section, I will discuss data
manipulation, query languages and, data maintenance. In the last or the fourth section, I will
make the test plans, feedback form, test cases, and user documentation.
6
Paraphrase This Document
Need a fresh take? Get an instant paraphrase of this document with our AI Paraphraser
LO1 Understand data models and database technologies
1.1 Critically compare different data models and schemas
A database exhibits the clever design of information, including the associations and flaws
that choose how data can be made more secure. Database models are built according to the
database principles and design requirements. Most data models can be addressed by
database graph.
Types of Data Models
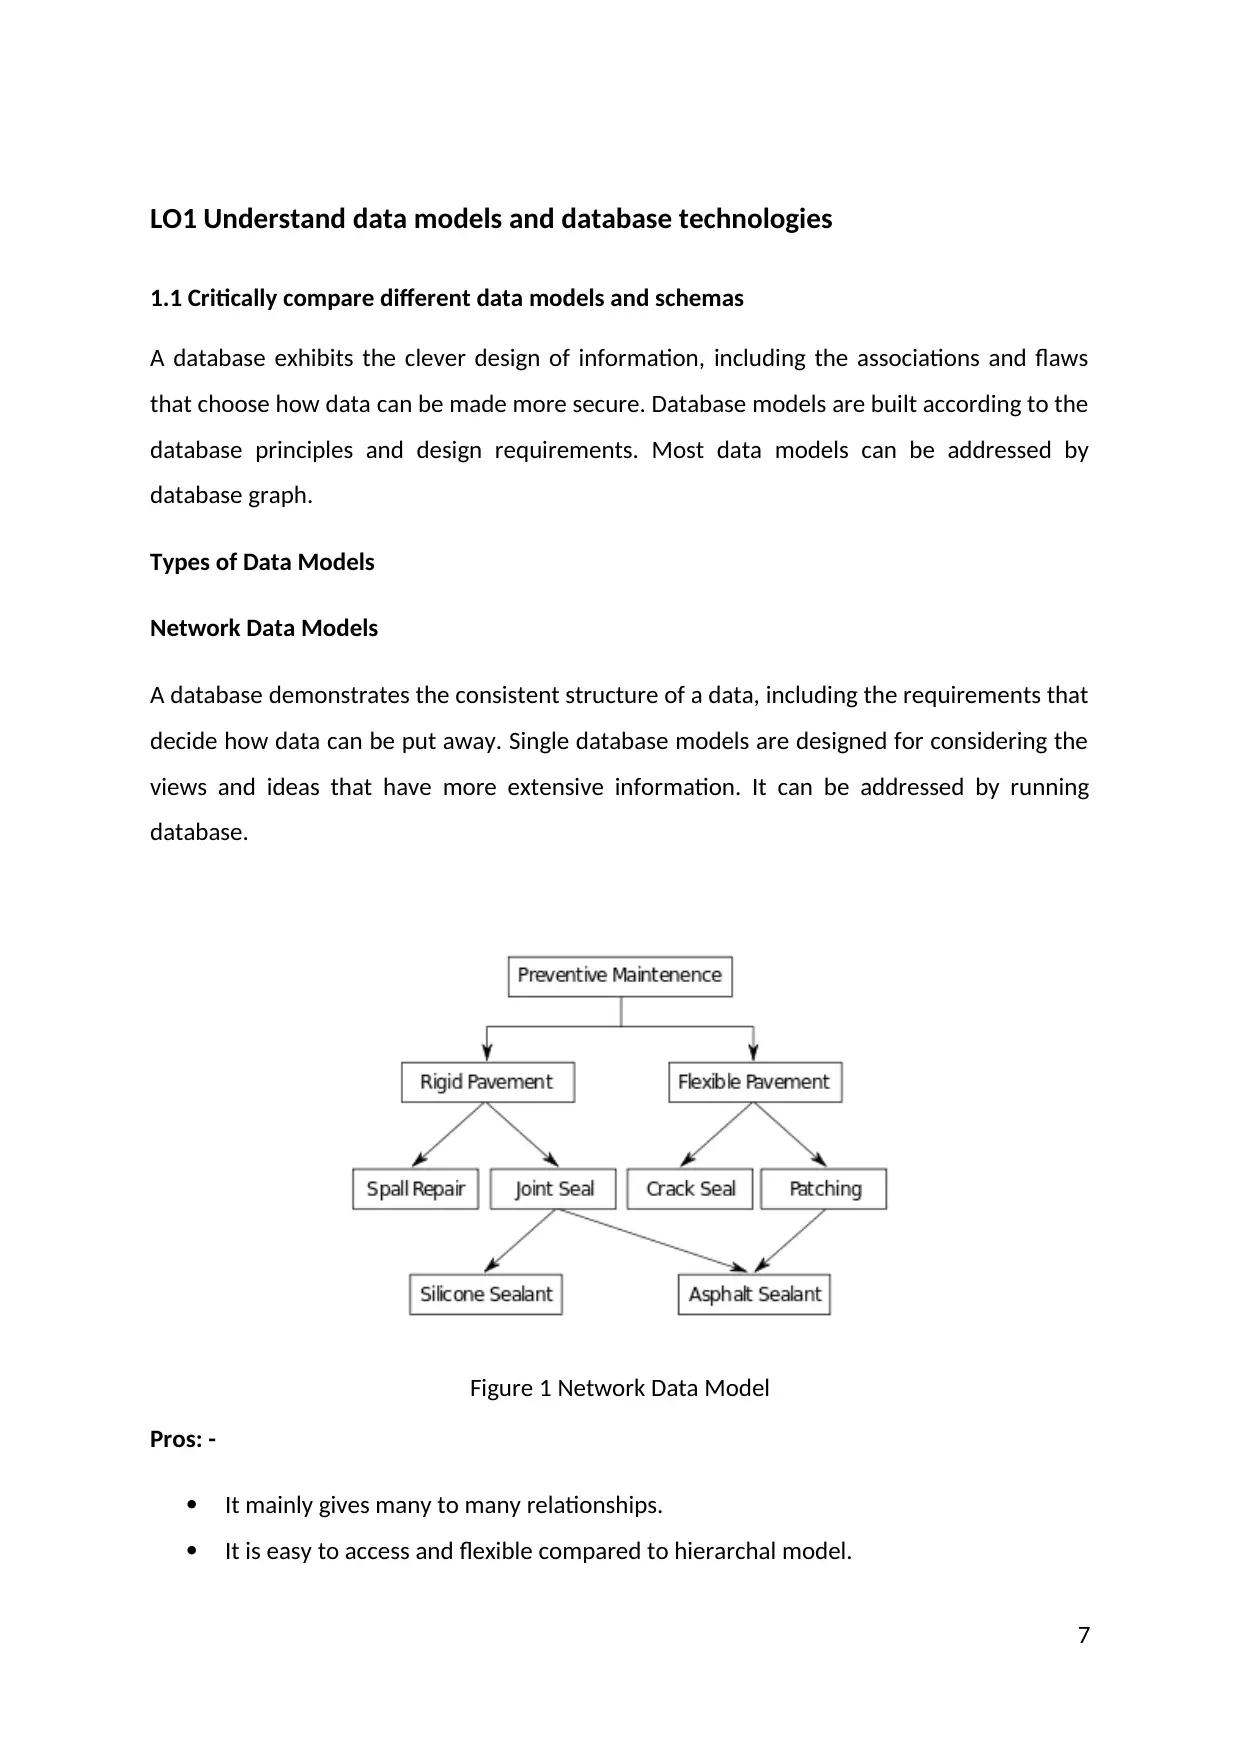
Network Data Models
A database demonstrates the consistent structure of a data, including the requirements that
decide how data can be put away. Single database models are designed for considering the
views and ideas that have more extensive information. It can be addressed by running
database.
Figure 1 Network Data Model
Pros: -
It mainly gives many to many relationships.
It is easy to access and flexible compared to hierarchal model.
7
1.1 Critically compare different data models and schemas
A database exhibits the clever design of information, including the associations and flaws
that choose how data can be made more secure. Database models are built according to the
database principles and design requirements. Most data models can be addressed by
database graph.
Types of Data Models
Network Data Models
A database demonstrates the consistent structure of a data, including the requirements that
decide how data can be put away. Single database models are designed for considering the
views and ideas that have more extensive information. It can be addressed by running
database.
Figure 1 Network Data Model
Pros: -
It mainly gives many to many relationships.
It is easy to access and flexible compared to hierarchal model.
7
Cons: -
In this whole database structure becomes very complex.
If the structure changes to the database are very difficult.
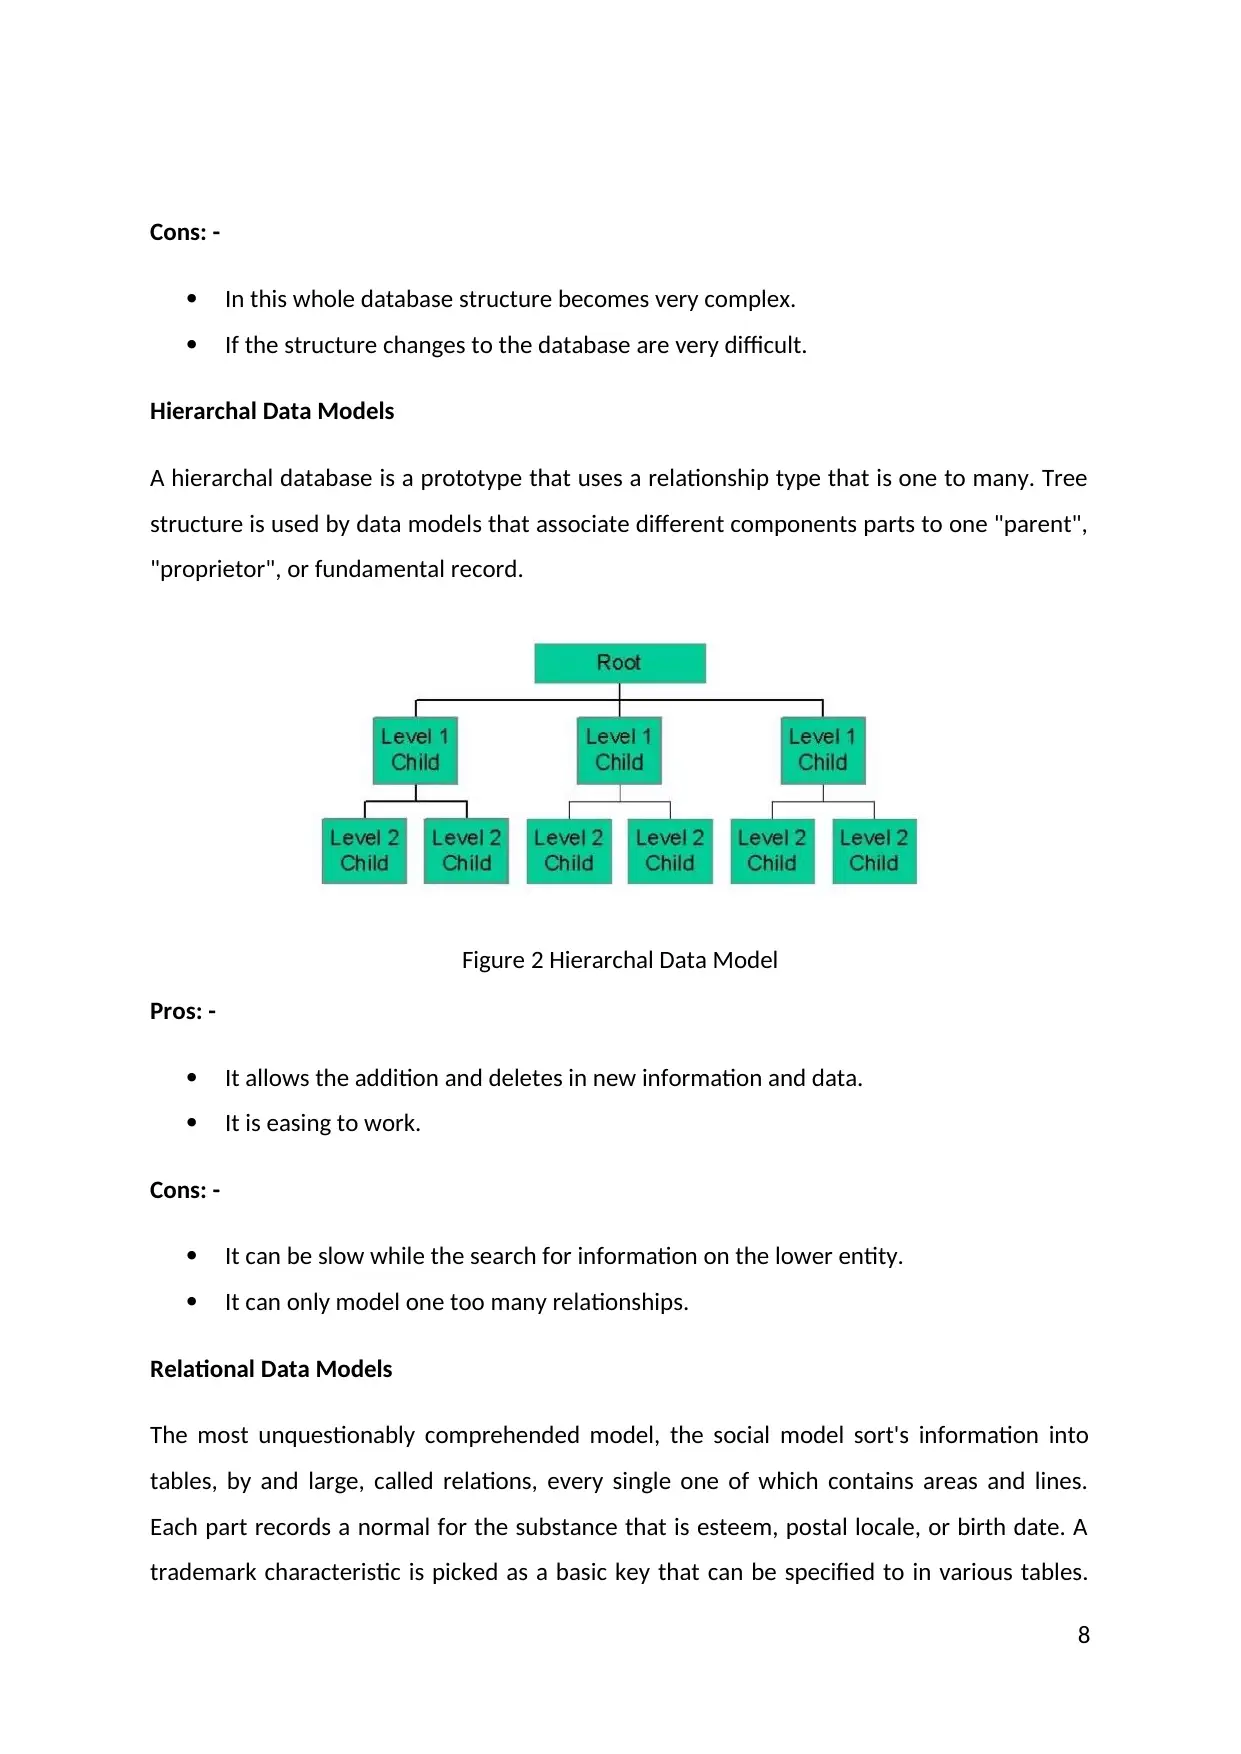
Hierarchal Data Models
A hierarchal database is a prototype that uses a relationship type that is one to many. Tree
structure is used by data models that associate different components parts to one "parent",
"proprietor", or fundamental record.
Figure 2 Hierarchal Data Model
Pros: -
It allows the addition and deletes in new information and data.
It is easing to work.
Cons: -
It can be slow while the search for information on the lower entity.
It can only model one too many relationships.
Relational Data Models
The most unquestionably comprehended model, the social model sort's information into
tables, by and large, called relations, every single one of which contains areas and lines.
Each part records a normal for the substance that is esteem, postal locale, or birth date. A
trademark characteristic is picked as a basic key that can be specified to in various tables.
8
In this whole database structure becomes very complex.
If the structure changes to the database are very difficult.
Hierarchal Data Models
A hierarchal database is a prototype that uses a relationship type that is one to many. Tree
structure is used by data models that associate different components parts to one "parent",
"proprietor", or fundamental record.
Figure 2 Hierarchal Data Model
Pros: -
It allows the addition and deletes in new information and data.
It is easing to work.
Cons: -
It can be slow while the search for information on the lower entity.
It can only model one too many relationships.
Relational Data Models
The most unquestionably comprehended model, the social model sort's information into
tables, by and large, called relations, every single one of which contains areas and lines.
Each part records a normal for the substance that is esteem, postal locale, or birth date. A
trademark characteristic is picked as a basic key that can be specified to in various tables.
8
⊘ This is a preview!⊘
Do you want full access?
Subscribe today to unlock all pages.
Trusted by 1+ million students worldwide
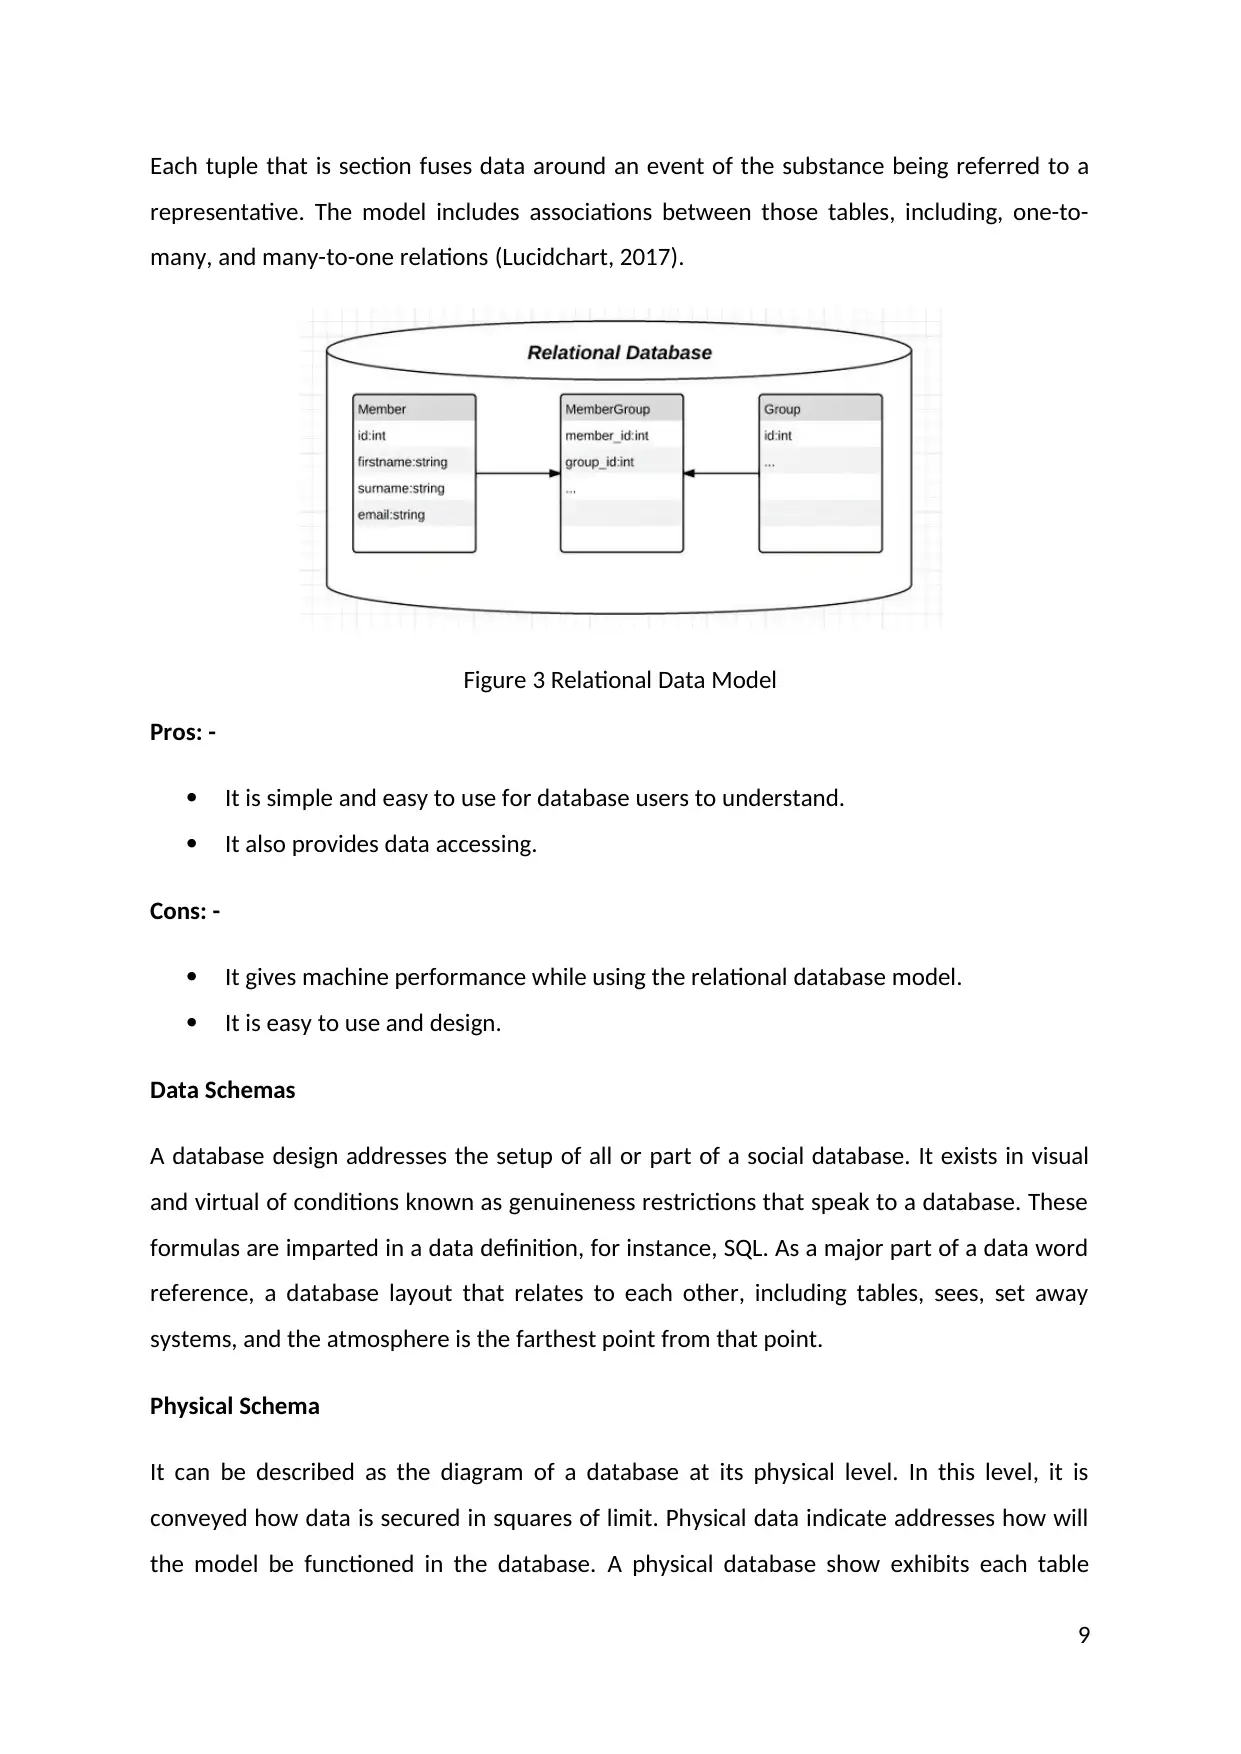
Each tuple that is section fuses data around an event of the substance being referred to a
representative. The model includes associations between those tables, including, one-to-
many, and many-to-one relations (Lucidchart, 2017).
Figure 3 Relational Data Model
Pros: -
It is simple and easy to use for database users to understand.
It also provides data accessing.
Cons: -
It gives machine performance while using the relational database model.
It is easy to use and design.
Data Schemas
A database design addresses the setup of all or part of a social database. It exists in visual
and virtual of conditions known as genuineness restrictions that speak to a database. These
formulas are imparted in a data definition, for instance, SQL. As a major part of a data word
reference, a database layout that relates to each other, including tables, sees, set away
systems, and the atmosphere is the farthest point from that point.
Physical Schema
It can be described as the diagram of a database at its physical level. In this level, it is
conveyed how data is secured in squares of limit. Physical data indicate addresses how will
the model be functioned in the database. A physical database show exhibits each table
9
Paraphrase This Document
Need a fresh take? Get an instant paraphrase of this document with our AI Paraphraser
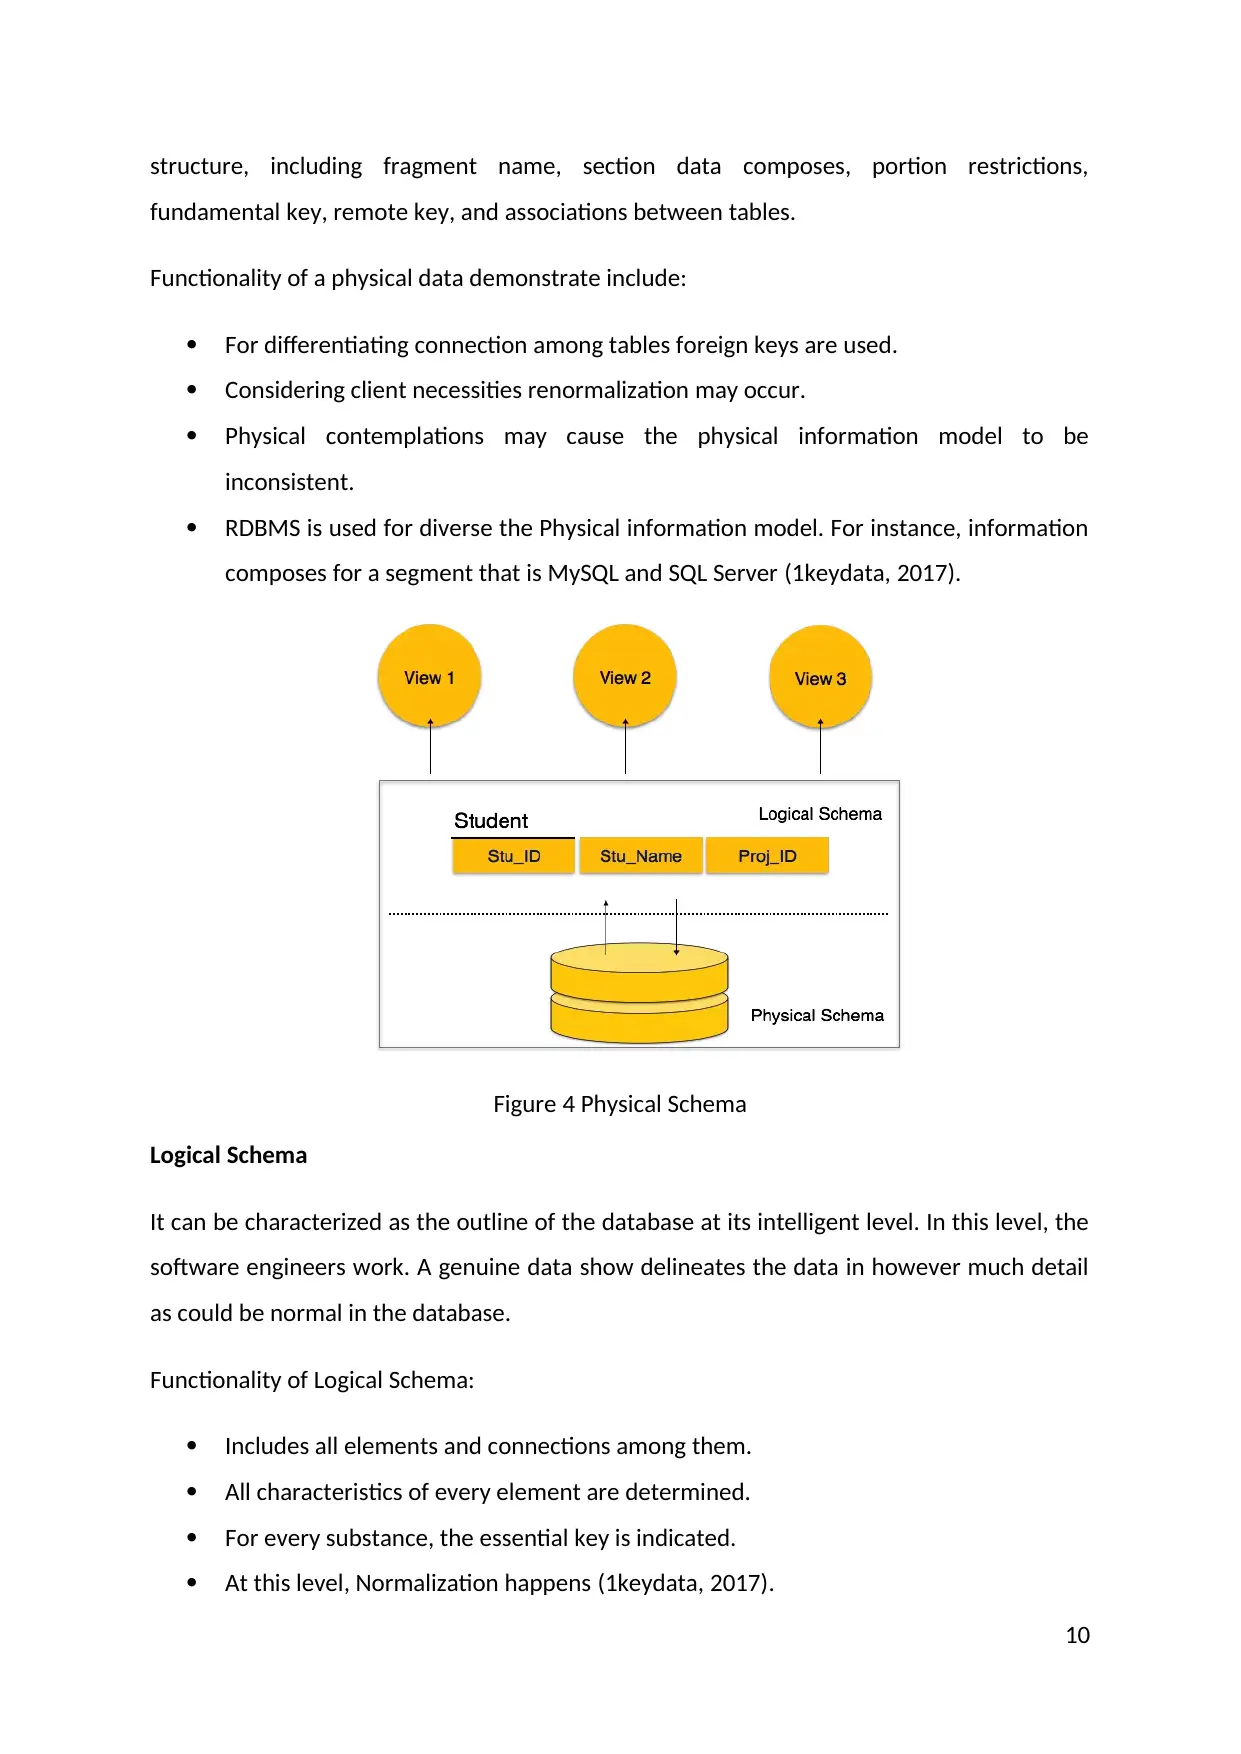
structure, including fragment name, section data composes, portion restrictions,
fundamental key, remote key, and associations between tables.
Functionality of a physical data demonstrate include:
For differentiating connection among tables foreign keys are used.
Considering client necessities renormalization may occur.
Physical contemplations may cause the physical information model to be
inconsistent.
RDBMS is used for diverse the Physical information model. For instance, information
composes for a segment that is MySQL and SQL Server (1keydata, 2017).
Figure 4 Physical Schema
Logical Schema
It can be characterized as the outline of the database at its intelligent level. In this level, the
software engineers work. A genuine data show delineates the data in however much detail
as could be normal in the database.
Functionality of Logical Schema:
Includes all elements and connections among them.
All characteristics of every element are determined.
For every substance, the essential key is indicated.
At this level, Normalization happens (1keydata, 2017).
10
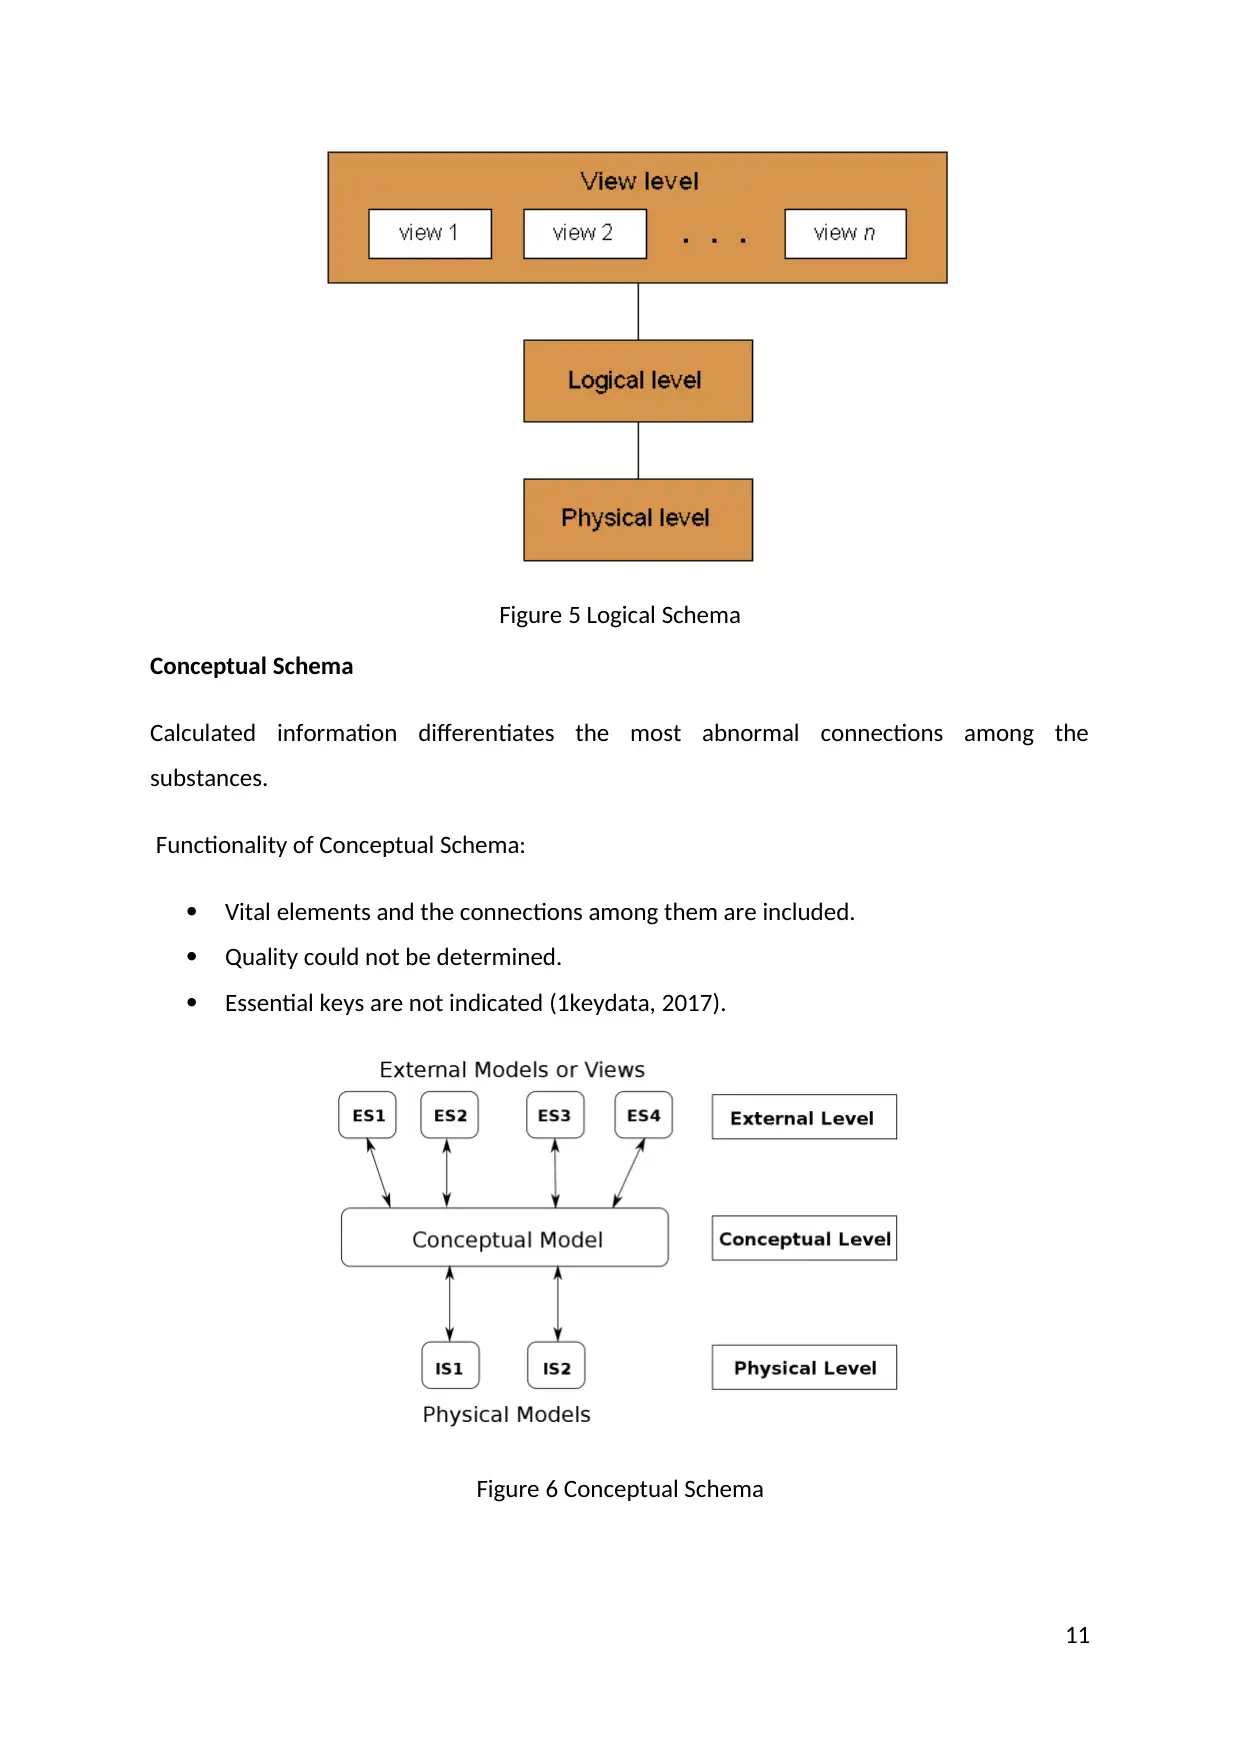
Figure 5 Logical Schema
Conceptual Schema
Calculated information differentiates the most abnormal connections among the
substances.
Functionality of Conceptual Schema:
Vital elements and the connections among them are included.
Quality could not be determined.
Essential keys are not indicated (1keydata, 2017).
Figure 6 Conceptual Schema
11
⊘ This is a preview!⊘
Do you want full access?
Subscribe today to unlock all pages.
Trusted by 1+ million students worldwide
1 out of 62
Related Documents


Your All-in-One AI-Powered Toolkit for Academic Success.
+13062052269
info@desklib.com
Available 24*7 on WhatsApp / Email
![[object Object]](/_next/static/media/star-bottom.7253800d.svg)
Unlock your academic potential
Copyright © 2020–2026 A2Z Services. All Rights Reserved. Developed and managed by ZUCOL.