HI5002 Finance Group Assignment: Domino's Pizza Company Analysis
VerifiedAdded on 2022/11/01
|23
|3916
|177
Report
AI Summary
This report presents a comprehensive financial analysis of Domino's Pizza Enterprises Limited, an ASX-listed company. It examines the company's financial performance using profitability ratios (Return on Total Assets, Net Profit Ratio, and Return on Equity) and operating efficiency ratios (Inventory Turnover Ratio, Account Receivable Turnover Ratio, and Asset Turnover Ratio) from 2015 to 2018. The analysis includes the use of marketable securities for cash management, application of sensitivity analysis in capital budgeting, and an assessment of systematic and unsystematic risks. Furthermore, the report calculates the dividend payout ratio and interprets the company's dividend policy, concluding with a recommendation letter to a potential institutional investor. The study highlights Domino's Pizza's strong financial position, sound cash management, and effective risk management, making it a potentially attractive investment opportunity. The report is designed to provide guidance to investors by providing a clear understanding of the company's financial health and future prospects.
1
HI5002
Finance for Business
Group Assignment
Company Performance Analysis
HI5002
Finance for Business
Group Assignment
Company Performance Analysis
Paraphrase This Document
Need a fresh take? Get an instant paraphrase of this document with our AI Paraphraser
2
Abstract
The report is being developed for providing an understating of the financial analysis
carried out for a company to provide recommendation to an institutional investor aiming to
invest within a company. The overall financial analysis is based on an ASX listed entity, that is,
Dominos Pizza Enterprises Limited. It has been suggested to invest within the company on the
basis of iota good profitability and efficiency position, sound cash management, regular dividend
paid to shareholders and effective management of systematic and unsystematic risks.
3
Contents
Abstract............................................................................................................................................2
I: Introduction..................................................................................................................................4
II: Detailed discussion on financial analysis of Dominos Pizza Enterprise Limited.......................4
2.1: Brief information of the selected company...........................................................................4
2.2: Use of performance ratios to depict the performance of the company.................................5
Profitability Ratios of Domino’s Pizza........................................................................................5
2.3: Use of marketable securities for cash management............................................................10
2.4: Application of sensitivity analysis in capital budgeting problem.......................................12
2.5: Systematic and Unsystematic Risks Associated with Dominos Pizza................................17
Systematic Risks........................................................................................................................18
Unsystematic Risks....................................................................................................................18
2.6: Calculation of dividend payout ratio and interpretation of dividend policy implemented by
the company...............................................................................................................................19
III: Recommendation Letter to client (As a potential investor).....................................................20
IV: Conclusion...............................................................................................................................21
References......................................................................................................................................22
⊘ This is a preview!⊘
Do you want full access?
Subscribe today to unlock all pages.
Trusted by 1+ million students worldwide
4
I: Introduction
The business entities tend to prepare and disclose their financial information through the
financial statements to facilitate the economic decision-making of its investors. The financial
statement assists the investors of an entity from across the world to take investment decisions by
analysis of its past, present and future financial performance. This report has been developed to
undertake an analysis of the financial performance of a selected listed company on the ASX for
the purpose for providing guidance to an institutional investor. The business entity selected for
the purpose is Domino’s Pizza Enterprise Limited, an ASX listed pizza chain in Australia.
The report undertakes an evaluation of the financial performance of the selected entity
through the use of ratio analysis, cash management, conducting sensitivity analysis and
discussing the systematic and unsystematic risks associated with the company operations. It also
calculates the dividend payout ratio for providing an assessment regarding the dividend policy of
the company. Lastly, the overall findings generated are presented within the recommendation
section to provide guidance to an institutional investor regarding investment within the company.
II: Detailed discussion on financial analysis of Dominos Pizza Enterprise Limited
2.1: Brief information of the selected company
Domino’s Pizza Enterprises Limited is regarded as largest pizza chain in Australia in
reference to the number of stores and its wide network. The company realizes high sales within
the Australian market as it is the largest franchise for Domino’s Pizza brand across the world. Its
pizza chain has extended to several countries across the world having about 2,500 stores and thus
largely contributing to the growth and expansion of Domino’s franchise on an international level.
The major markets of the company include Australia, New Zealand, Germany, Denmark,
Luxemburg, Japan, France and the Netherlands. It has been established in the year 1983 and is
presently regarded as one of the biggest pizza franchised business across Australia. It is
headquartered within Queensland in Australia and is regarded as major player within the food
retail sector of the country. The distinctive advantage is acquired by the company in retail sector
of Australia owing to its capabilities of proving faster and fresh quality food to the people and
also has achieved a leadership in the use of innovative technologies in food sector. It is being
Paraphrase This Document
Need a fresh take? Get an instant paraphrase of this document with our AI Paraphraser
5
recognized as first company to introduce drone-delivery pizza and also providing innovative
features such as ordering through app and using artificial intelligence in managing its operational
activities (About Dominos, 2019).
2.2: Use of performance ratios to depict the performance of the company
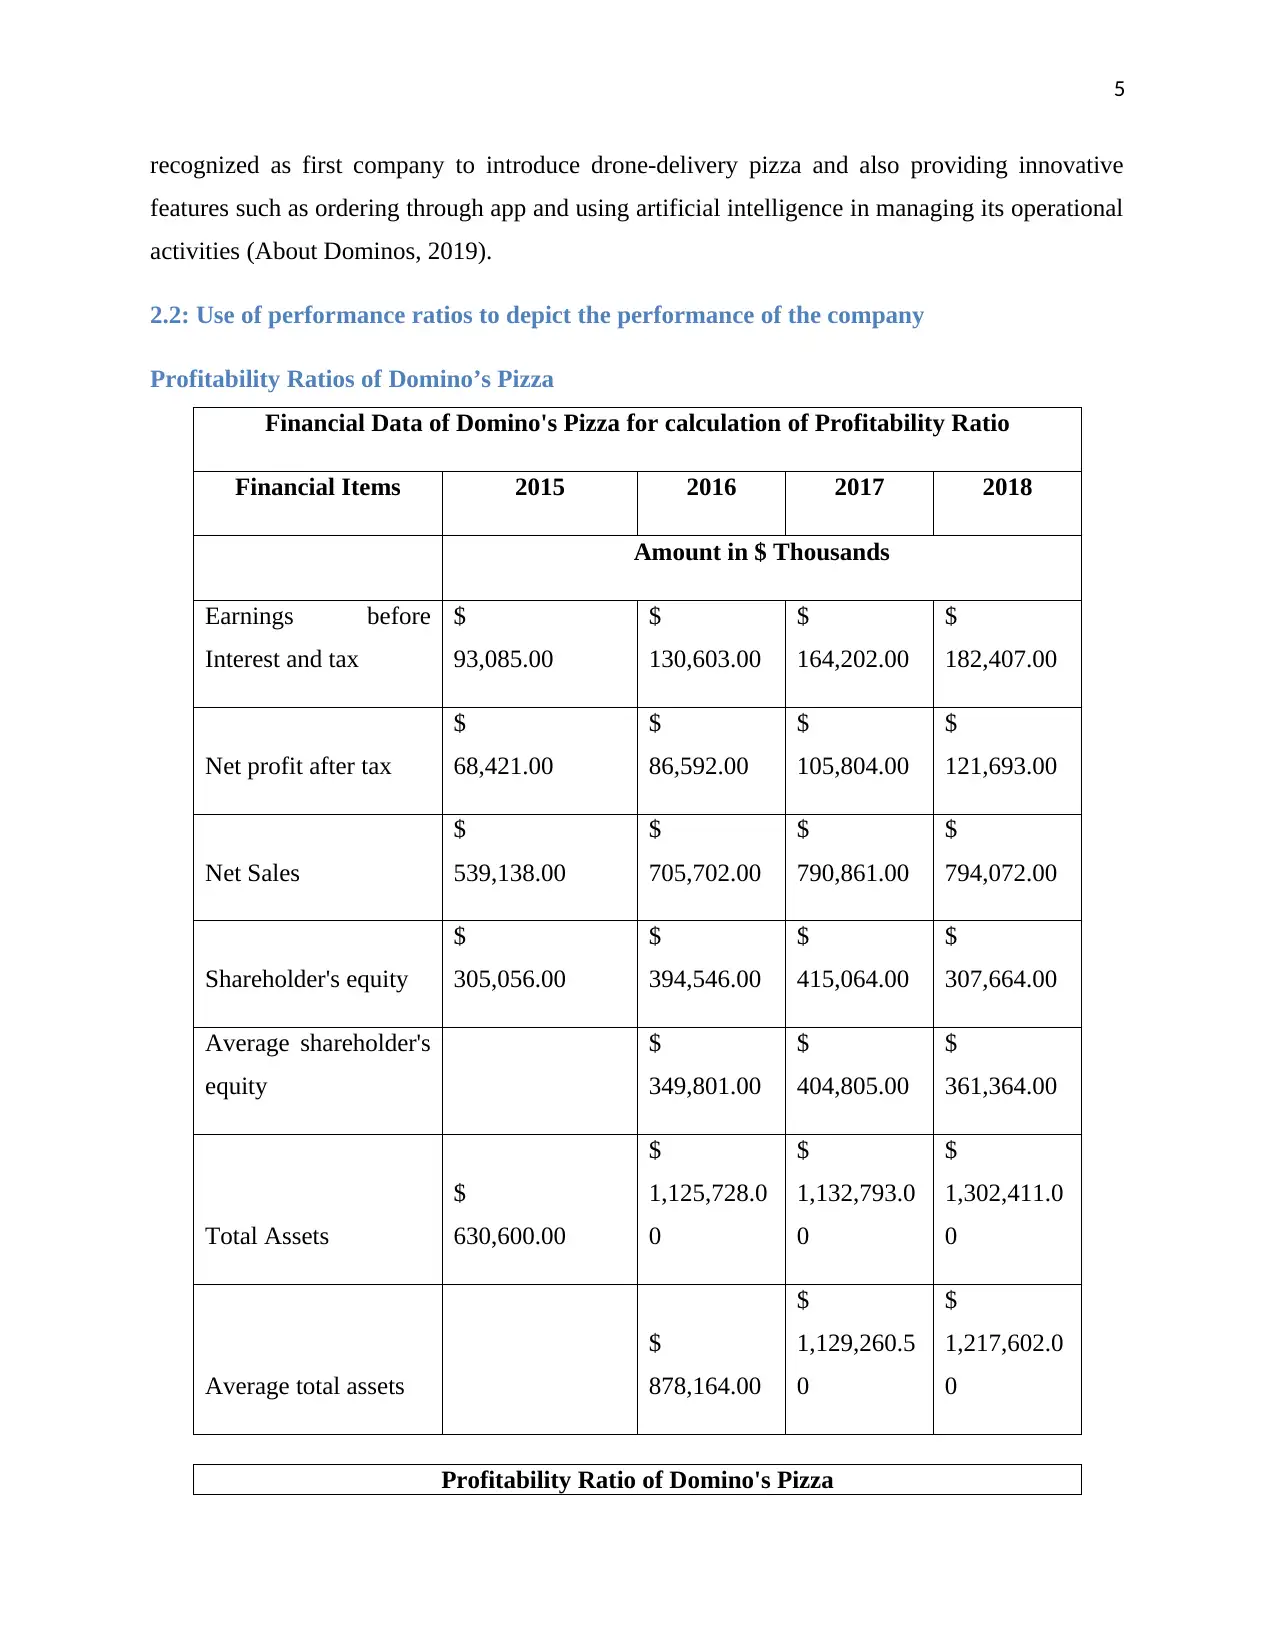
Profitability Ratios of Domino’s Pizza
Financial Data of Domino's Pizza for calculation of Profitability Ratio
Financial Items 2015 2016 2017 2018
Amount in $ Thousands
Earnings before
Interest and tax
$
93,085.00
$
130,603.00
$
164,202.00
$
182,407.00
Net profit after tax
$
68,421.00
$
86,592.00
$
105,804.00
$
121,693.00
Net Sales
$
539,138.00
$
705,702.00
$
790,861.00
$
794,072.00
Shareholder's equity
$
305,056.00
$
394,546.00
$
415,064.00
$
307,664.00
Average shareholder's
equity
$
349,801.00
$
404,805.00
$
361,364.00
Total Assets
$
630,600.00
$
1,125,728.0
0
$
1,132,793.0
0
$
1,302,411.0
0
Average total assets
$
878,164.00
$
1,129,260.5
0
$
1,217,602.0
0
Profitability Ratio of Domino's Pizza
recognized as first company to introduce drone-delivery pizza and also providing innovative
features such as ordering through app and using artificial intelligence in managing its operational
activities (About Dominos, 2019).
2.2: Use of performance ratios to depict the performance of the company
Profitability Ratios of Domino’s Pizza
Financial Data of Domino's Pizza for calculation of Profitability Ratio
Financial Items 2015 2016 2017 2018
Amount in $ Thousands
Earnings before
Interest and tax
$
93,085.00
$
130,603.00
$
164,202.00
$
182,407.00
Net profit after tax
$
68,421.00
$
86,592.00
$
105,804.00
$
121,693.00
Net Sales
$
539,138.00
$
705,702.00
$
790,861.00
$
794,072.00
Shareholder's equity
$
305,056.00
$
394,546.00
$
415,064.00
$
307,664.00
Average shareholder's
equity
$
349,801.00
$
404,805.00
$
361,364.00
Total Assets
$
630,600.00
$
1,125,728.0
0
$
1,132,793.0
0
$
1,302,411.0
0
Average total assets
$
878,164.00
$
1,129,260.5
0
$
1,217,602.0
0
Profitability Ratio of Domino's Pizza
6
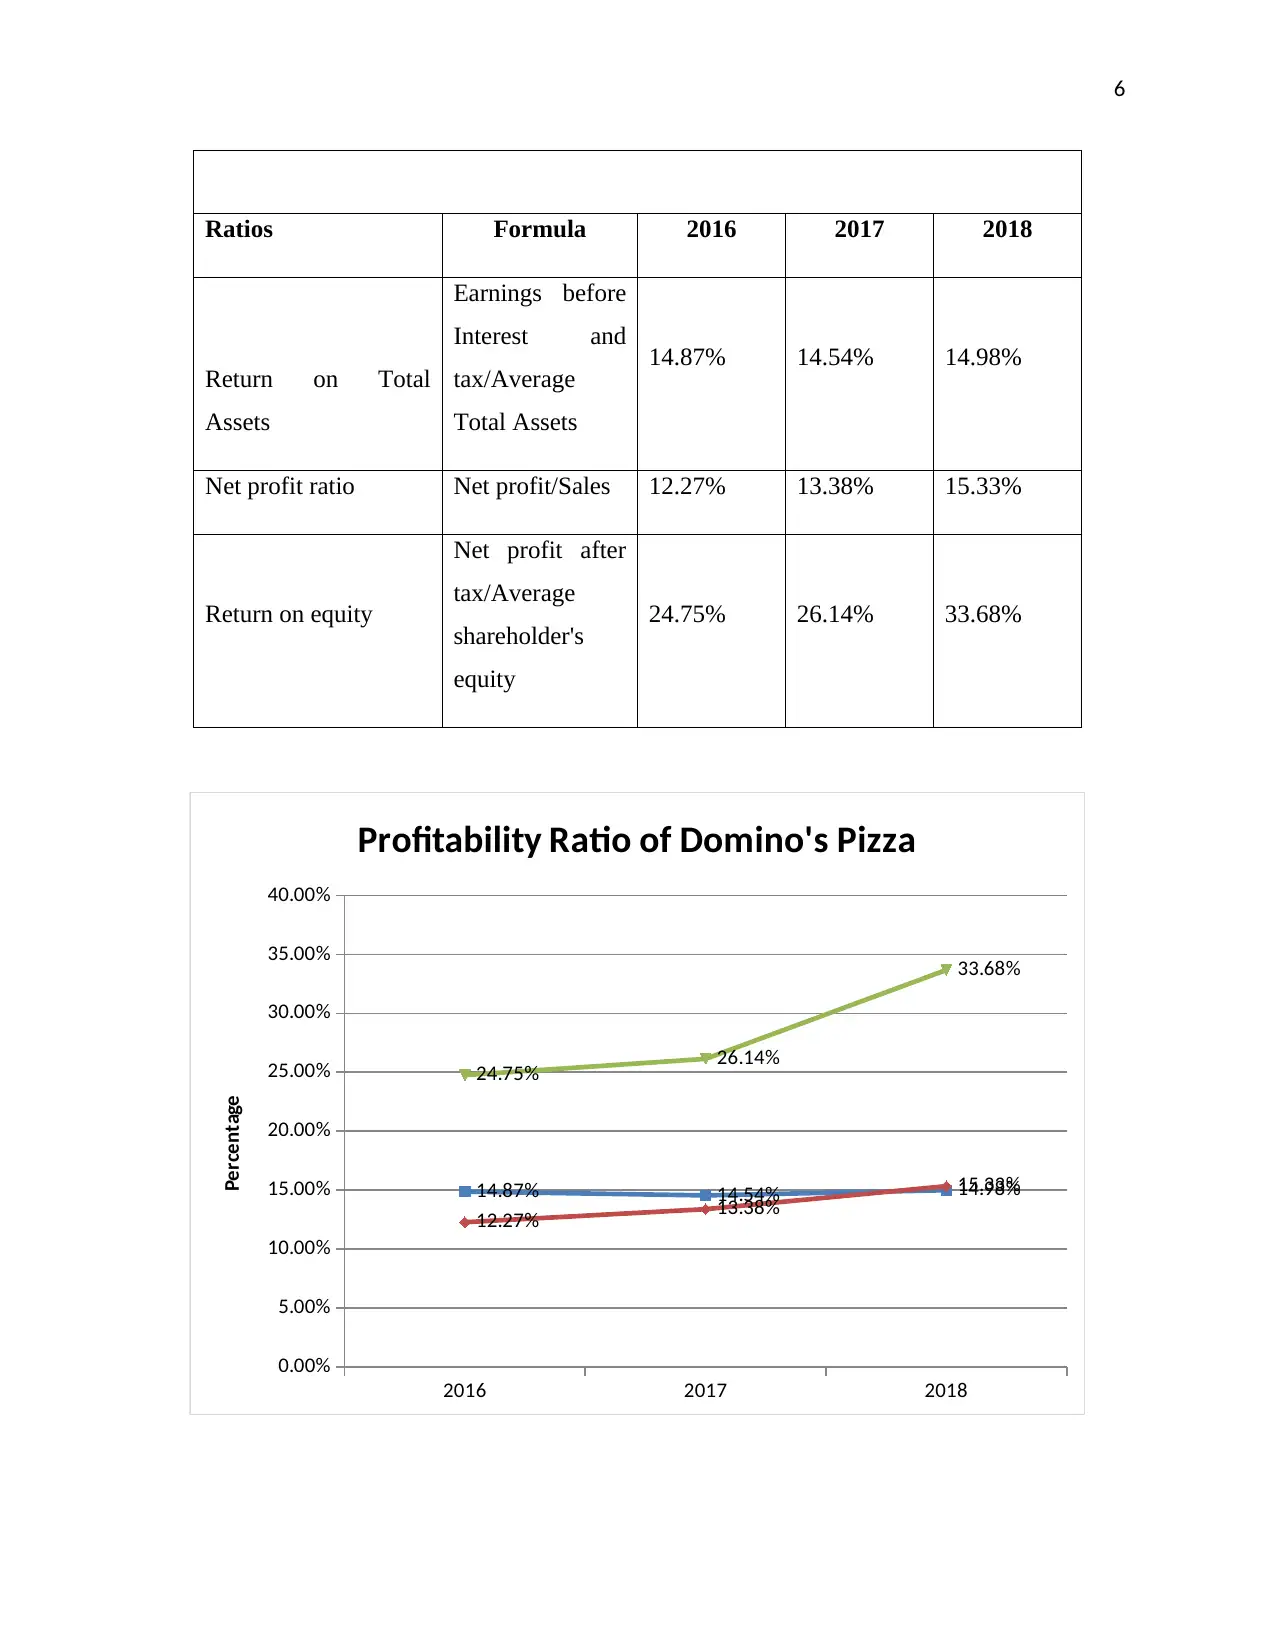
Ratios Formula 2016 2017 2018
Return on Total
Assets
Earnings before
Interest and
tax/Average
Total Assets
14.87% 14.54% 14.98%
Net profit ratio Net profit/Sales 12.27% 13.38% 15.33%
Return on equity
Net profit after
tax/Average
shareholder's
equity
24.75% 26.14% 33.68%
2016 2017 2018
0.00%
5.00%
10.00%
15.00%
20.00%
25.00%
30.00%
35.00%
40.00%
14.87% 14.54% 14.98%
12.27% 13.38%
15.33%
24.75% 26.14%
33.68%
Profitability Ratio of Domino's Pizza
Percentage
⊘ This is a preview!⊘
Do you want full access?
Subscribe today to unlock all pages.
Trusted by 1+ million students worldwide
7
(Source: Domino’s Pizza: Annual Report, 2016, Domino’s Pizza: Annual Report, 2017 &
Domino’s Pizza: Annual Report, 2018)
The profitability position of Domino’s Pizza can be analyzed by the use of following ratios:
Return on Total Assets (ROTA): The return on total assets is the ratio that measures an
entity’s earnings before interest and tax (EBIT) to its total assets. This ratio indicates that
how effectively a company is using its total assets to generate revenue before its finance
cost and tax expenses. The chart depicts a straight line which shows Domino’s Pizza has
a stable trend in respect of return on total assets. However from 2016 to 2017 return on
total assets have fallen from 14.87% to 14.54% and then it has increased in 2018 to
14.98%. Earnings before interest and taxes have increased over the selected financial
period which means that it is able to achieve control over its operational expenses thus
deriving higher profits (Moles and Kidwekk, 2011).
Net Profit Ratio: Net Profit Ratio measures the percentage of profitability in relation to
net sales. This Ratio indicates the profit earned per dollar of net sales. On analyzing the
past three years data it can be said that Domino’s Pizza has an upward trend in respect of
net profit ratio from 12.27 to 15. 33%. This is actually a good sign for the stakeholders as
well as prospective investors. The company is performing good in terms of deriving net
profits from its overall sales figure which supports its future growth prospects (Baker and
Powell, 2009).
Return on Equity: This ratio states the percentage of profit after taxes earned on total
equity of the company. In other words, return on equity measures the effectiveness of a
company is using its equity money to generate revenues after deducting the finance cost
and taxes. The chart depicts upward trend indicating the increase in the ratio in past three
years. This states that company is working very efficiently by using cheap source of
finance (debt) which needs low return to generate higher revenue that can be attributable
to equity investors. The company has attained highest return on its equity in the financial
year 2018 which means that it is bale to effectively generate returns on the shareholders
(Zimmerman and Yahya-Zadeh, 2011).
Operating Efficiency Ratios
Paraphrase This Document
Need a fresh take? Get an instant paraphrase of this document with our AI Paraphraser
8
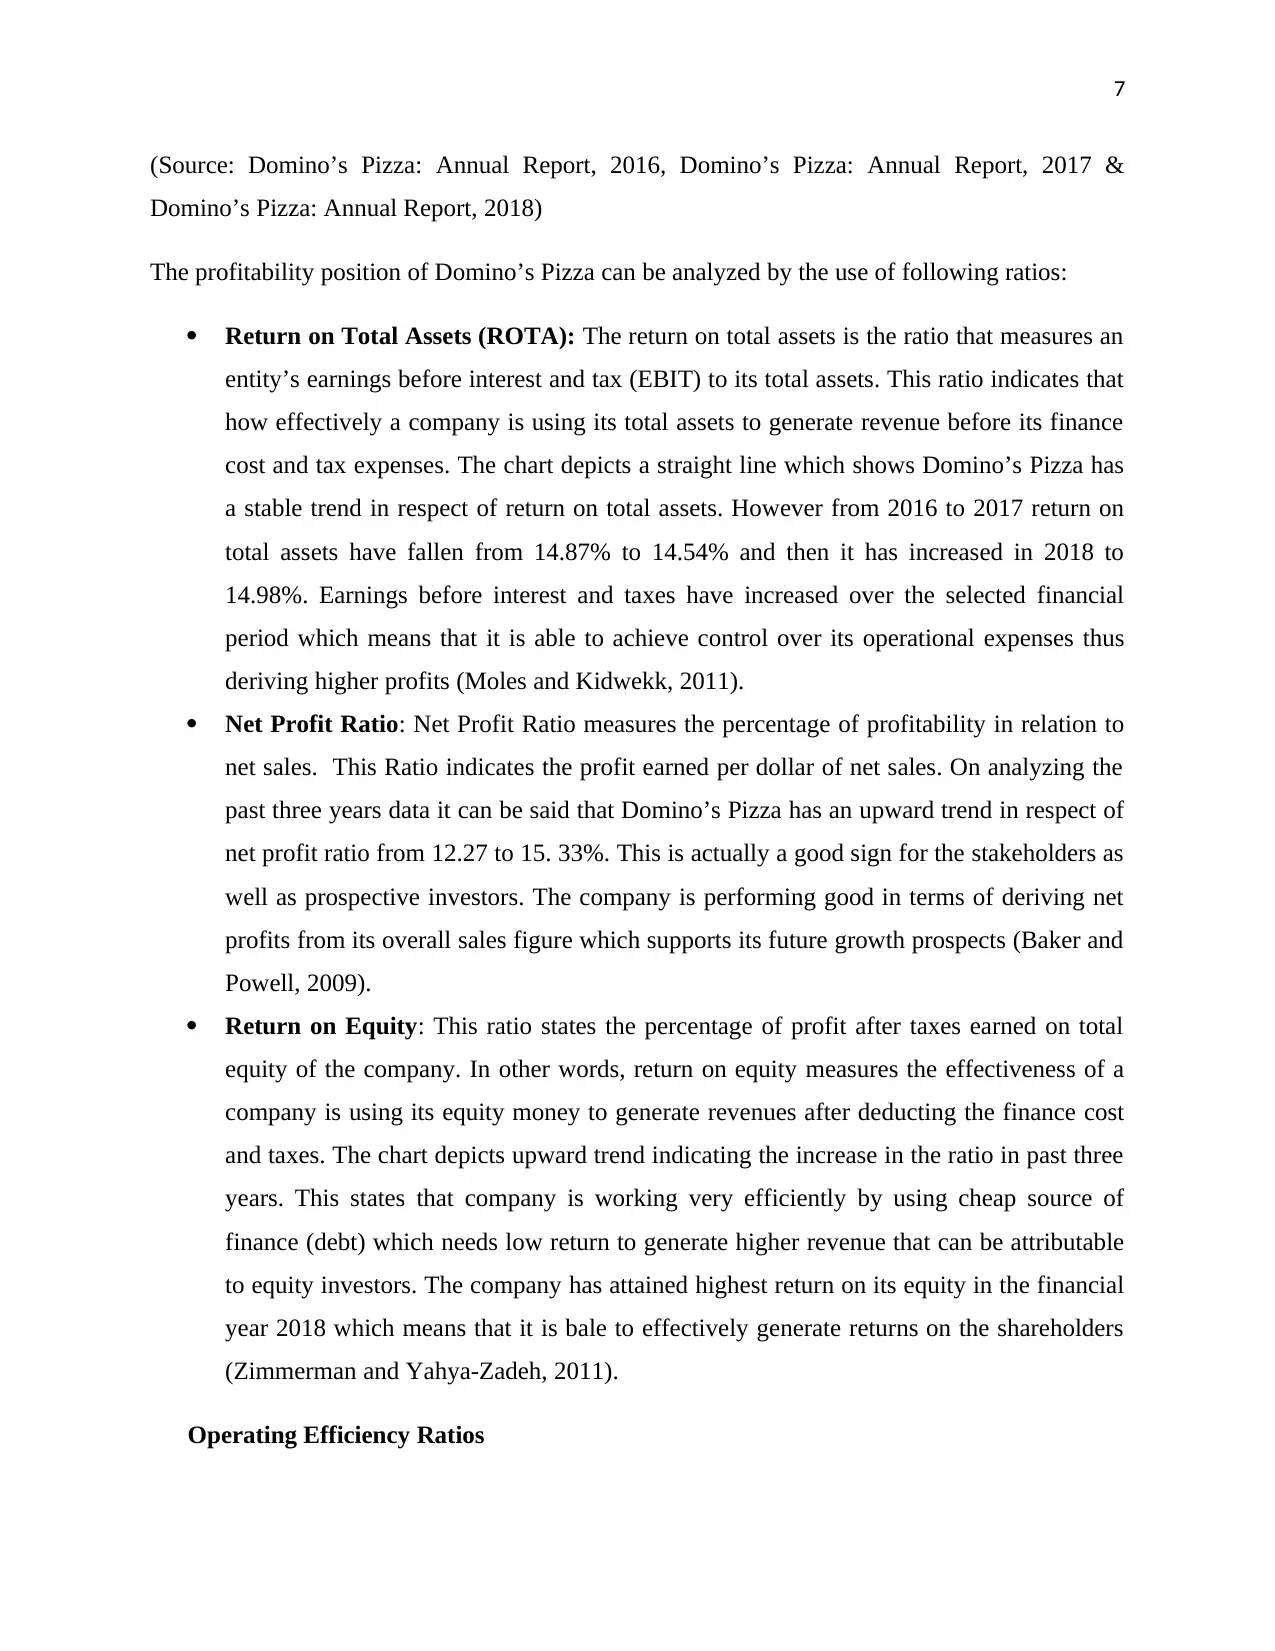
Financial Data of Domino's Pizza for calculation of Operating Efficiency Ratio
Financial Items 2015 2016 2017 2018
Amount in $ Thousands
Net Sales
$
539,138.00
$
705,702.00
$
790,861.00
$
794,072.00
Account Receivables
$
43,883.00
$
72,143.00
$
72,615.00
$
78,181.00
Average account
receivable
$
58,013.00
$
72,379.00
$
75,398.00
Total Assets
$
630,600.00
$
1,125,728.00
$
1,132,793.00
$
1,302,411.00
Average total assets
$
878,164.00
$
1,129,260.50
$
1,217,602.00
Cost of Goods Sold
$
485,182.00
$
638,528.00
$
727,398.00
$
774,136.00
Inventory
$
12,282.00
$
16,675.00
$
21,098.00
$
19,271.00
Average Inventory
$
14,478.50
$
18,886.50
$
20,184.50
Operating Efficiency Ratios of Domino's Pizza
Ratios Formula 2016 2017 2018
Inventory Turnover
ratio
Cost of goods
sold/Average
44.10 38.51 38.35
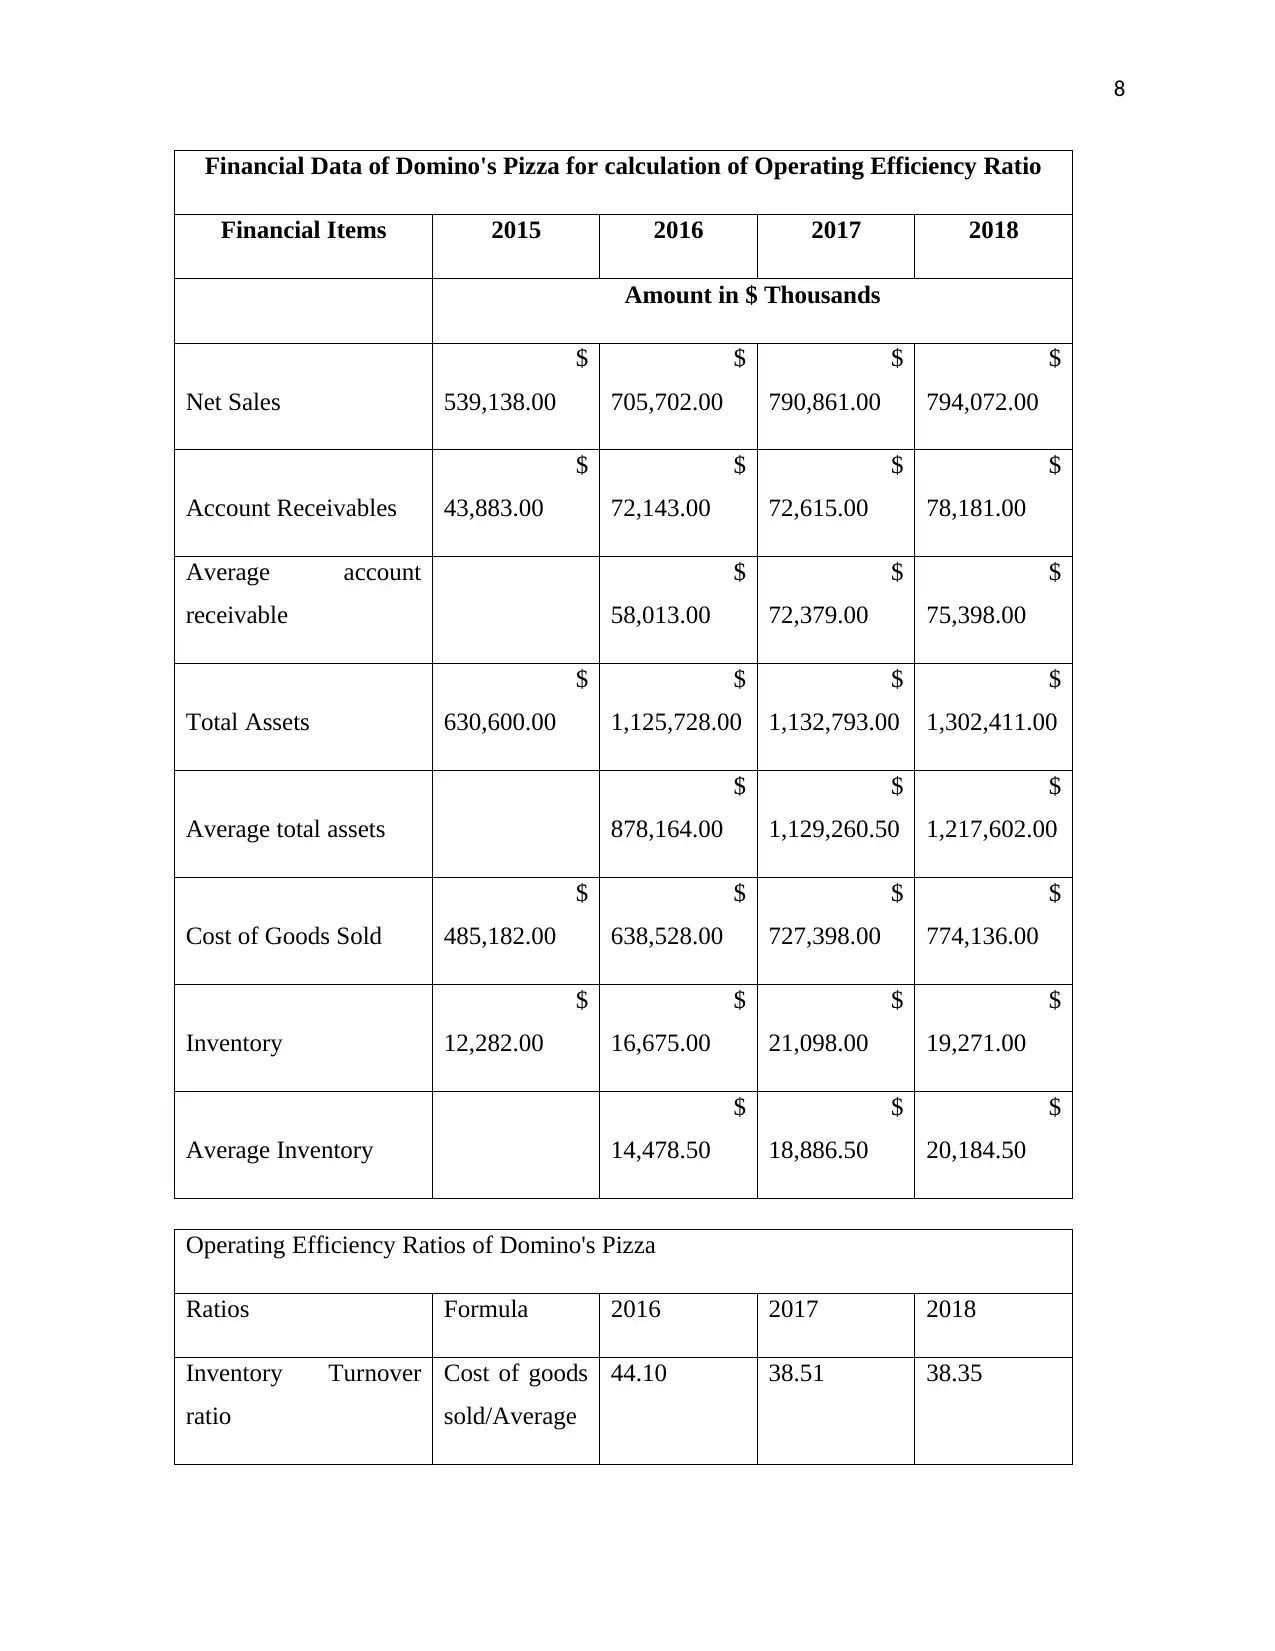
9
inventory
Account Receivable
turnover ratio
Net
sales/Average
account
receivables
12.16 10.93 10.53
Asset Turnover ratio
Net
Sales/Average
total assets
0.80 0.70 0.65
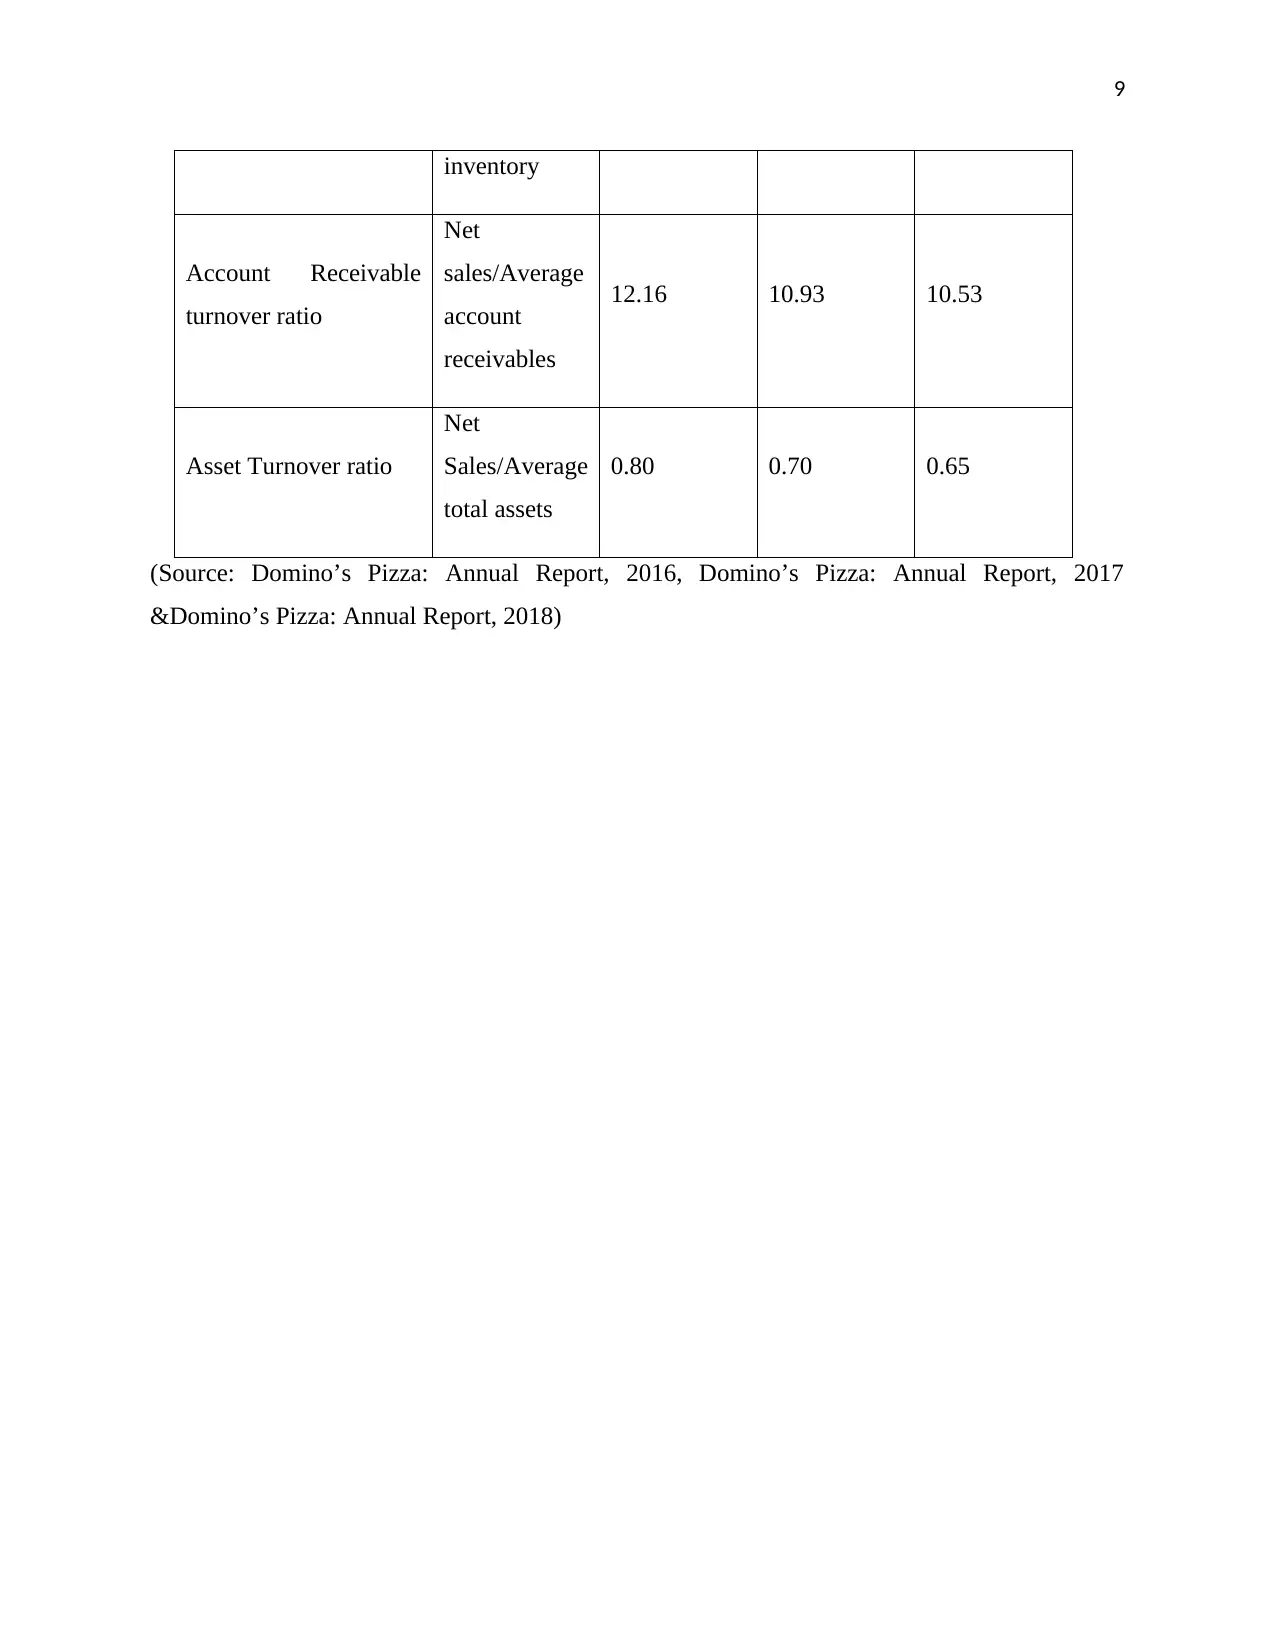
(Source: Domino’s Pizza: Annual Report, 2016, Domino’s Pizza: Annual Report, 2017
&Domino’s Pizza: Annual Report, 2018)
inventory
Account Receivable
turnover ratio
Net
sales/Average
account
receivables
12.16 10.93 10.53
Asset Turnover ratio
Net
Sales/Average
total assets
0.80 0.70 0.65
(Source: Domino’s Pizza: Annual Report, 2016, Domino’s Pizza: Annual Report, 2017
&Domino’s Pizza: Annual Report, 2018)
⊘ This is a preview!⊘
Do you want full access?
Subscribe today to unlock all pages.
Trusted by 1+ million students worldwide
10
2016
2017
2018
0.00
5.00
10.00
15.00
20.00
25.00
30.00
35.00
40.00
45.00
44.10
38.51 38.35
12.16
10.93
10.53
0.80
0.70
0.65
Operating Effeciency Ratio
Axis Title
Times
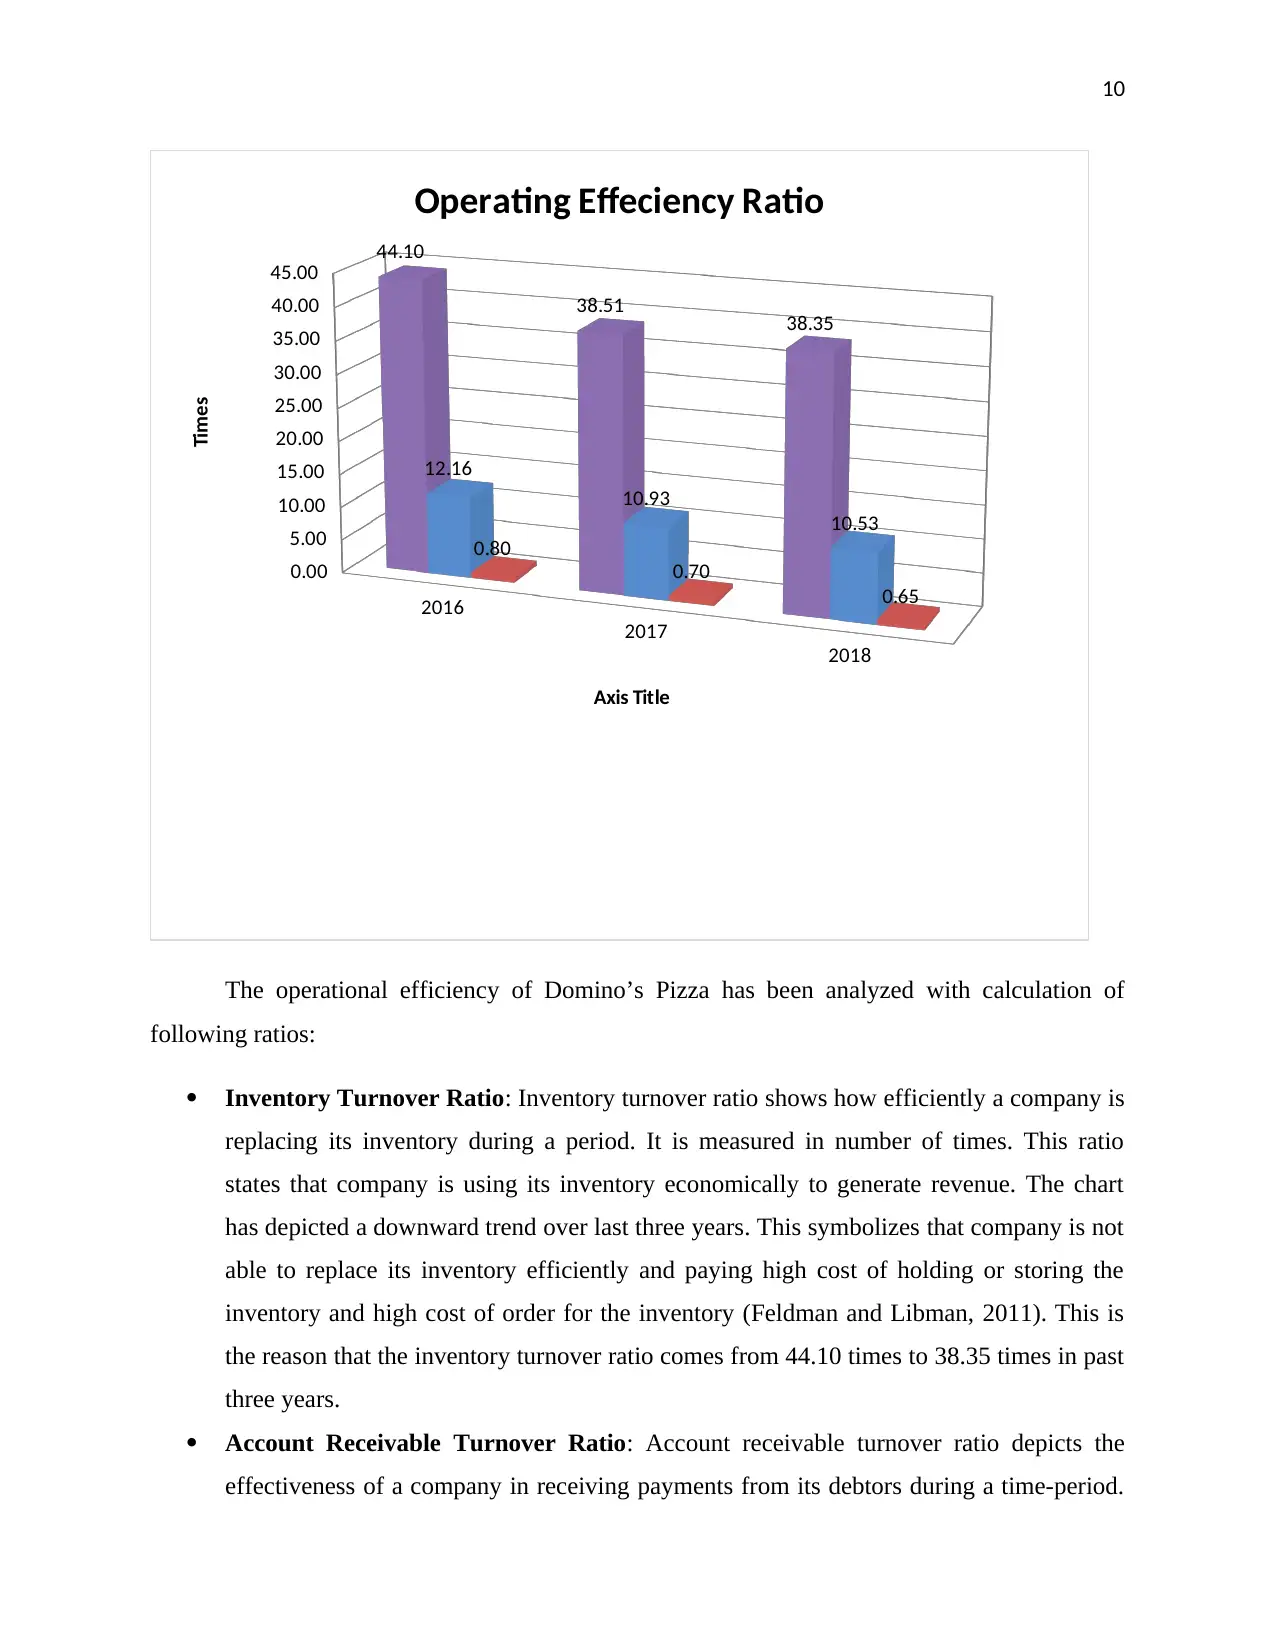
The operational efficiency of Domino’s Pizza has been analyzed with calculation of
following ratios:
Inventory Turnover Ratio: Inventory turnover ratio shows how efficiently a company is
replacing its inventory during a period. It is measured in number of times. This ratio
states that company is using its inventory economically to generate revenue. The chart
has depicted a downward trend over last three years. This symbolizes that company is not
able to replace its inventory efficiently and paying high cost of holding or storing the
inventory and high cost of order for the inventory (Feldman and Libman, 2011). This is
the reason that the inventory turnover ratio comes from 44.10 times to 38.35 times in past
three years.
Account Receivable Turnover Ratio: Account receivable turnover ratio depicts the
effectiveness of a company in receiving payments from its debtors during a time-period.
2016
2017
2018
0.00
5.00
10.00
15.00
20.00
25.00
30.00
35.00
40.00
45.00
44.10
38.51 38.35
12.16
10.93
10.53
0.80
0.70
0.65
Operating Effeciency Ratio
Axis Title
Times
The operational efficiency of Domino’s Pizza has been analyzed with calculation of
following ratios:
Inventory Turnover Ratio: Inventory turnover ratio shows how efficiently a company is
replacing its inventory during a period. It is measured in number of times. This ratio
states that company is using its inventory economically to generate revenue. The chart
has depicted a downward trend over last three years. This symbolizes that company is not
able to replace its inventory efficiently and paying high cost of holding or storing the
inventory and high cost of order for the inventory (Feldman and Libman, 2011). This is
the reason that the inventory turnover ratio comes from 44.10 times to 38.35 times in past
three years.
Account Receivable Turnover Ratio: Account receivable turnover ratio depicts the
effectiveness of a company in receiving payments from its debtors during a time-period.
Paraphrase This Document
Need a fresh take? Get an instant paraphrase of this document with our AI Paraphraser
11
The graph has depicted a downward trend in past three years which indicates that
company is not able to collect its debts on time and company is selling its product on
credit. It shows that company is following the strategy to sale on credit to increase its
sales and then collecting its debts. This can results in negatively impacting the future
financial performance of the company (Arnold, 2013).
Asset Turnover Ratio: Asset Turnover Ratio depicts the company efficiency in using its
assets to generate revenue. It measures the assets contribution towards per dollar of sales.
In the past three years we can say company is not efficiently using its resources to
generate revenue as there is a downward trend in asset turnover ratio. It was 0.80 times in
2016 which comes to 0.65 times in 2018. Net sales have been increased in the past three
years but still company is not using its resources to its best. Domino’s Pizza is able to
generate higher revenue with the available resources. It should have a look in to it
(Krantz, 2016).
2.3: Use of marketable securities for cash management
Marketable securities are financial instrument that can be realized in cash at a reasonable
price. Marketable securities are held by company for cash management because maturity of these
securities are between 3 months to 1 year and can be easily liquidated whenever cash is required
on stock exchange or in any other way. The rates of marketable securities are affected very little
in terms of price and that is why it can easily bought and sold in the market (Schlichting, 2013).
Marketable securities that are available in Domino’s Pizza’s current assets are investment
in mutual funds, cash equivalents, advertising Fund cash equivalent and advertising fund
investments. Restriction is imposed on some funds so that the fund can be used for the purpose
for which it is being reserved. By using these securities as an instrument company can manage
its cash. Investment in marketable securities are far better than idle cash because idle cash
doesn’t give return and cash deposited in bank offers very low returns whereas investment in
securities offers a better return and safety of investment too (Gibson, 2011). Short term liabilities
are generally due for payment in a year. The period of maturity of these marketable securities is
also falls within a year which is the best way to pay off short term liabilities. The Company has
to fulfill some regulatory requirements too such as maintaining working capital at a specified
level or for measuring company’s solvency and liquidity (Reilly and Brown, 2011).
12
Domino’s Pizza is investing in mutual funds and cash equivalents so that it can pay off its
short term liabilities. Company’s investment in marketable securities such as advertisement fund
and advertisement fund investment which are restricted is for advertisement and promotion of
domino’s brand in future. By investing in such securities company is also complying with its
regulatory requirements and attaining faith of bankers and creditors by maintaining liquidity and
solvency.
2.4: Application of sensitivity analysis in capital budgeting problem
Project Life 4 Years
Cost of Equipment 2,000,000.00$
Reisdual Value 200,000.00$
Depreciation Method Straight Line
Life of Equipment 4 years
Depreciation of Equipment per
year 450,000.00$
Initial Working Capital 600,000.00$
Recovery of working capital 600,000.00$
Selling Units per year 300000 per year
Selling Price 20.00$
Variable Cost 12.00$
Fixed Cost 300,000.00$
Discount Rate 10%
Tax Rate 30%
Information Provided
⊘ This is a preview!⊘
Do you want full access?
Subscribe today to unlock all pages.
Trusted by 1+ million students worldwide
1 out of 23
Related Documents


Your All-in-One AI-Powered Toolkit for Academic Success.
+13062052269
info@desklib.com
Available 24*7 on WhatsApp / Email
![[object Object]](/_next/static/media/star-bottom.7253800d.svg)
Unlock your academic potential
Copyright © 2020–2026 A2Z Services. All Rights Reserved. Developed and managed by ZUCOL.