Literature Review: Factors Contributing to Drink and Drive Accidents
VerifiedAdded on 2023/04/19
|24
|5194
|237
Literature Review
AI Summary
This literature review examines the factors contributing to drink and drive accidents in the USA. The study investigates the prevalence of drunk driving, identifying young adults and teenagers as high-risk groups. It explores the influence of alcohol, peer pressure, and lack of experience as key factors. The review highlights the need for education on alcohol abuse and the importance of strict legal measures to deter drunk driving. The study employed a quantitative statistical approach using survey data from a sample population to determine the percentage of people who admit to drink and drive and factors responsible for such issues. The results show a significant percentage of the sample population admitting to drink and drive, while also revealing that the majority do not support the practice. The review emphasizes the importance of targeting young people with preventative measures to reduce the incidence of alcohol-related accidents.
Literature Review
Ryan Jeffery
Southern Arkansas University
February 11, 2019
Ryan Jeffery
Southern Arkansas University
February 11, 2019
Paraphrase This Document
Need a fresh take? Get an instant paraphrase of this document with our AI Paraphraser
1LITERATURE REVIEW
ABSTRACT
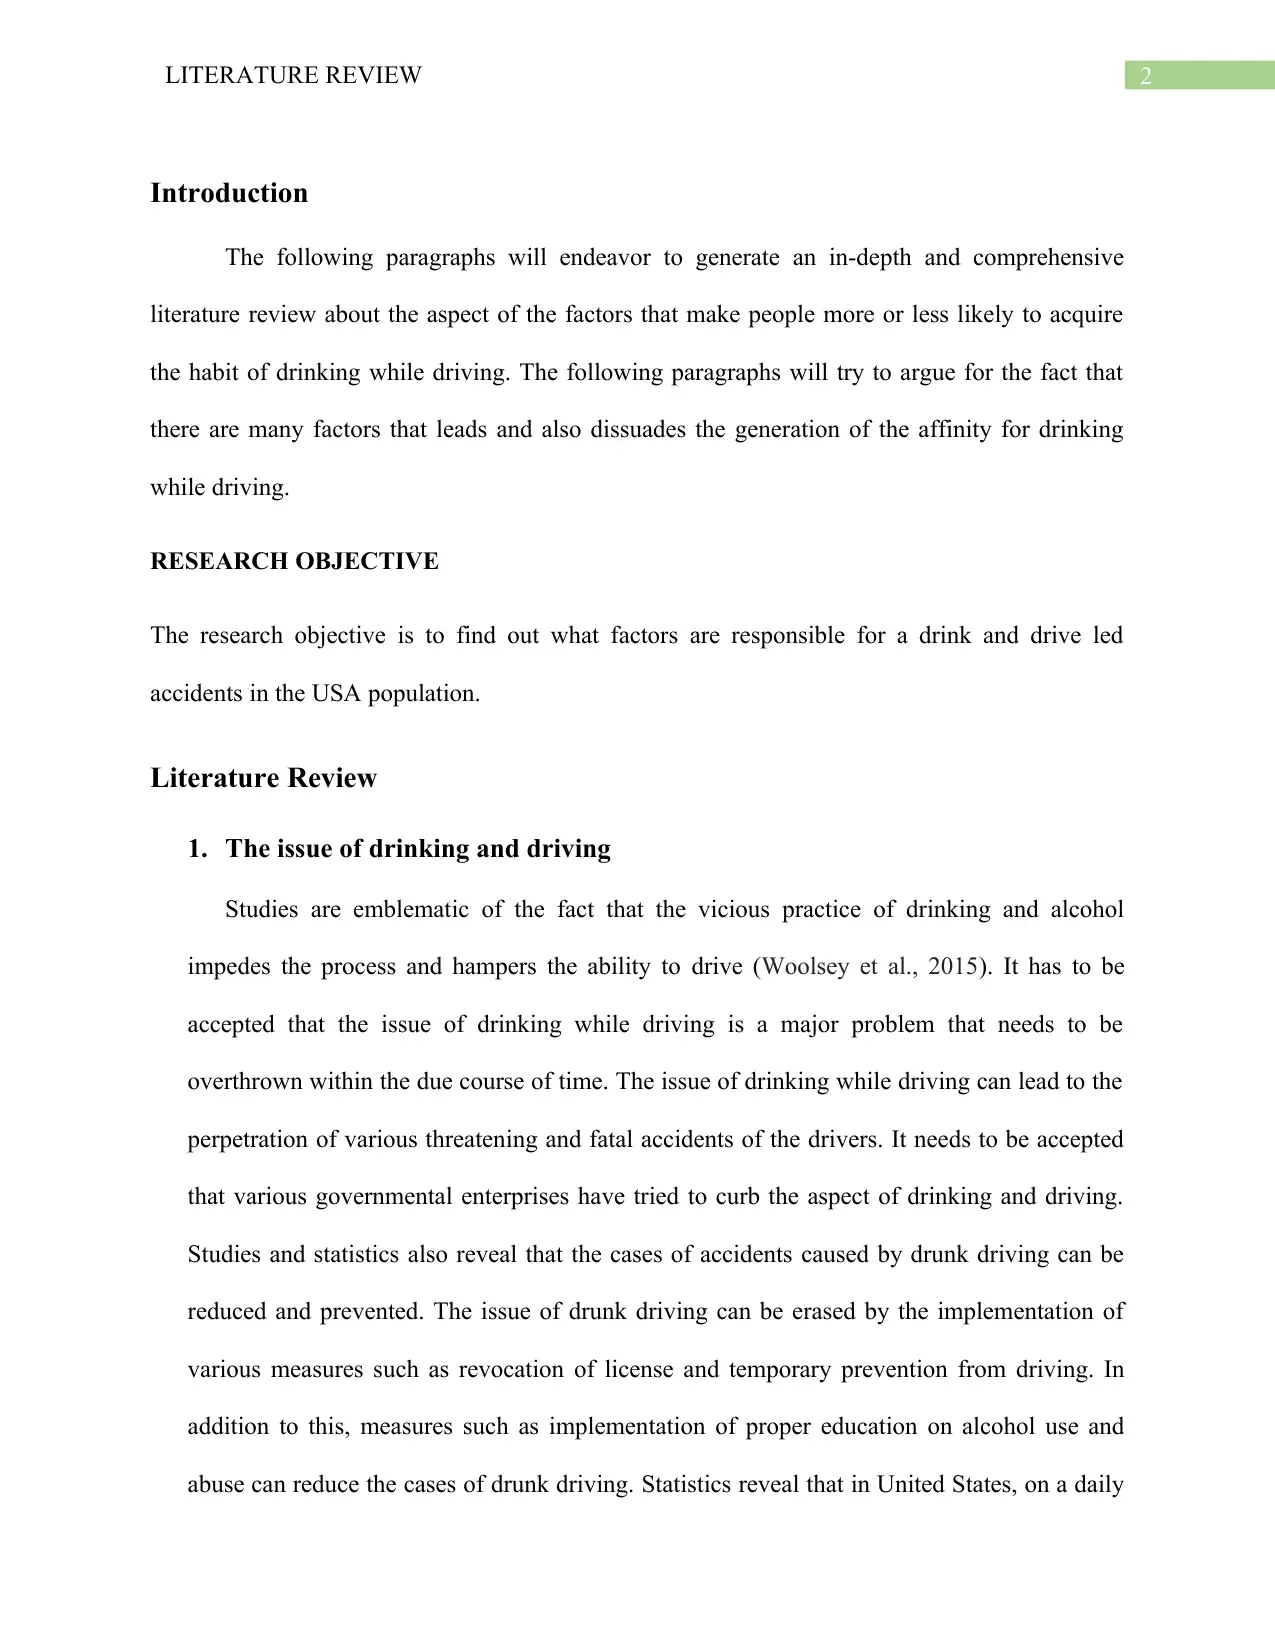
In the USA, every year thousands die due to drinking and driving. Although the dying
individuals include persons from all the age groups, national report implicates young and
teen aged drivers are more prone to alcohol and driving accidents. The issue has been
extensively studied and reported worldwide, however, what factors exactly motivates
individuals to drink and drive is less studied, and current perception of drink and drive is
also limited. The current study employed a quantitative simple statistical approach to find
out the prevalence of drink and drive accidents in a random sample population and what
factors are responsible for such issues. The current study found nearly 32% of the sample
population admitted of drink and drive, but at the same time, 91% of the population
admitted they do not support drink and drive. The factors that resonated with previous
research studies include young adults, and young teenagers are more prone to drink and
drive, the prevalence of accident in case of less experienced in driving is more as compared
to more experienced. The study concludes more emphasis should be given on young people
who are more prone to such issues.
ABSTRACT
In the USA, every year thousands die due to drinking and driving. Although the dying
individuals include persons from all the age groups, national report implicates young and
teen aged drivers are more prone to alcohol and driving accidents. The issue has been
extensively studied and reported worldwide, however, what factors exactly motivates
individuals to drink and drive is less studied, and current perception of drink and drive is
also limited. The current study employed a quantitative simple statistical approach to find
out the prevalence of drink and drive accidents in a random sample population and what
factors are responsible for such issues. The current study found nearly 32% of the sample
population admitted of drink and drive, but at the same time, 91% of the population
admitted they do not support drink and drive. The factors that resonated with previous
research studies include young adults, and young teenagers are more prone to drink and
drive, the prevalence of accident in case of less experienced in driving is more as compared
to more experienced. The study concludes more emphasis should be given on young people
who are more prone to such issues.
2LITERATURE REVIEW
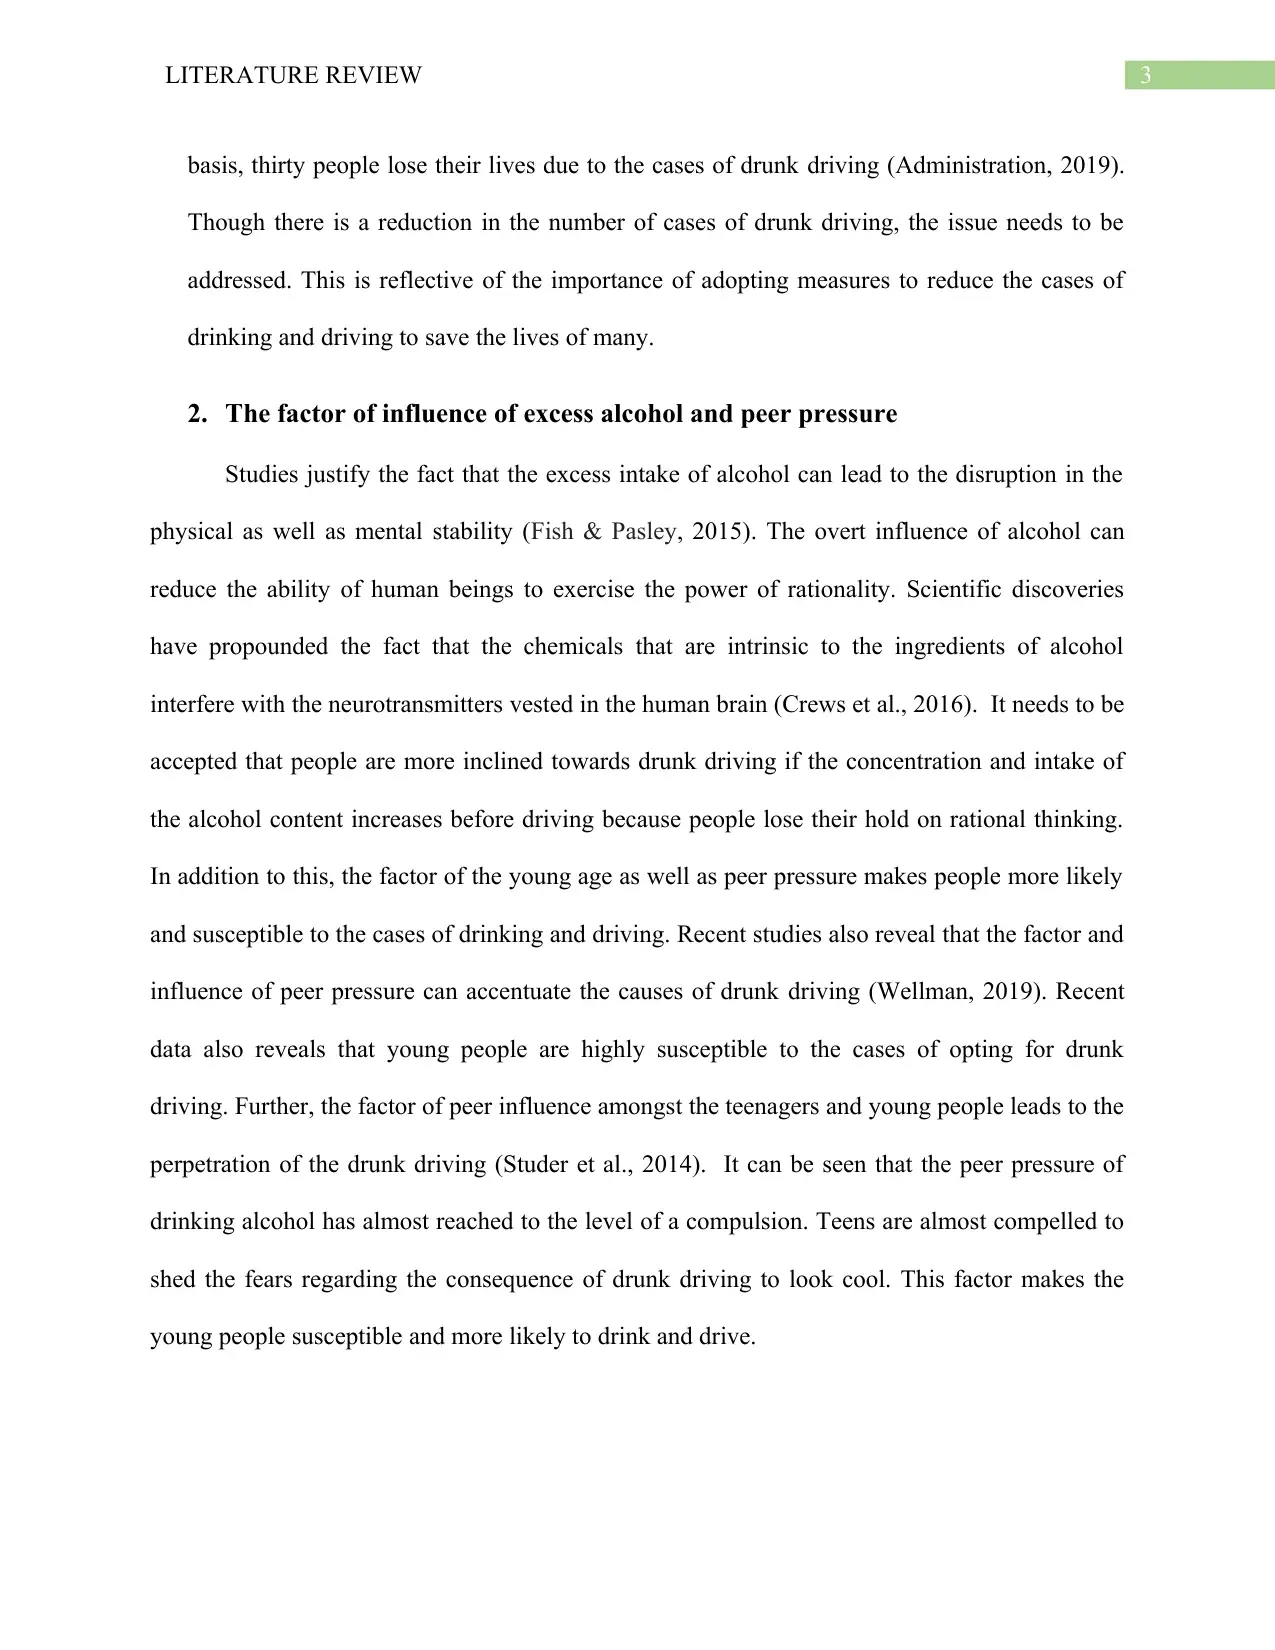
Introduction
The following paragraphs will endeavor to generate an in-depth and comprehensive
literature review about the aspect of the factors that make people more or less likely to acquire
the habit of drinking while driving. The following paragraphs will try to argue for the fact that
there are many factors that leads and also dissuades the generation of the affinity for drinking
while driving.
RESEARCH OBJECTIVE
The research objective is to find out what factors are responsible for a drink and drive led
accidents in the USA population.
Literature Review
1. The issue of drinking and driving
Studies are emblematic of the fact that the vicious practice of drinking and alcohol
impedes the process and hampers the ability to drive (Woolsey et al., 2015). It has to be
accepted that the issue of drinking while driving is a major problem that needs to be
overthrown within the due course of time. The issue of drinking while driving can lead to the
perpetration of various threatening and fatal accidents of the drivers. It needs to be accepted
that various governmental enterprises have tried to curb the aspect of drinking and driving.
Studies and statistics also reveal that the cases of accidents caused by drunk driving can be
reduced and prevented. The issue of drunk driving can be erased by the implementation of
various measures such as revocation of license and temporary prevention from driving. In
addition to this, measures such as implementation of proper education on alcohol use and
abuse can reduce the cases of drunk driving. Statistics reveal that in United States, on a daily
⊘ This is a preview!⊘
Do you want full access?
Subscribe today to unlock all pages.
Trusted by 1+ million students worldwide
3LITERATURE REVIEW
basis, thirty people lose their lives due to the cases of drunk driving (Administration, 2019).
Though there is a reduction in the number of cases of drunk driving, the issue needs to be
addressed. This is reflective of the importance of adopting measures to reduce the cases of
drinking and driving to save the lives of many.
2. The factor of influence of excess alcohol and peer pressure
Studies justify the fact that the excess intake of alcohol can lead to the disruption in the
physical as well as mental stability (Fish & Pasley, 2015). The overt influence of alcohol can
reduce the ability of human beings to exercise the power of rationality. Scientific discoveries
have propounded the fact that the chemicals that are intrinsic to the ingredients of alcohol
interfere with the neurotransmitters vested in the human brain (Crews et al., 2016). It needs to be
accepted that people are more inclined towards drunk driving if the concentration and intake of
the alcohol content increases before driving because people lose their hold on rational thinking.
In addition to this, the factor of the young age as well as peer pressure makes people more likely
and susceptible to the cases of drinking and driving. Recent studies also reveal that the factor and
influence of peer pressure can accentuate the causes of drunk driving (Wellman, 2019). Recent
data also reveals that young people are highly susceptible to the cases of opting for drunk
driving. Further, the factor of peer influence amongst the teenagers and young people leads to the
perpetration of the drunk driving (Studer et al., 2014). It can be seen that the peer pressure of
drinking alcohol has almost reached to the level of a compulsion. Teens are almost compelled to
shed the fears regarding the consequence of drunk driving to look cool. This factor makes the
young people susceptible and more likely to drink and drive.
Paraphrase This Document
Need a fresh take? Get an instant paraphrase of this document with our AI Paraphraser
4LITERATURE REVIEW
3. The factor of education regarding alcohol abuse and its effects
The factor of educating people regarding the abuse and ill-effects of drunk driving can
lead to people being less likely to drink and drive (Hammoudi, Karani & Littlewood, 2014). This
factor can impede the prospective drivers from exercising precaution at the time of driving. This
can also make the people refrain from indulging in drinking habits before driving. Studies justify
the fact that proper education measures such as distribution of anti-drinking pamphlets before
driving can help the people in refraining from indulging in cases of drunk driving. In addition to
this, the factor of proper and strict implementation of the legal measures can make the drivers
refrain from drunk driving. Studies reveal the fact that the adoption of strict measures such as
regular punishment by legal proceedings can make people less likely to drink and drive (Hansen,
2015). Legal proceedings such as incorporation of temporary ban and other measures can make
people refrain from indulging in drunk driving.
Data and Methods
The habit of drinking and driving is very common in the United States where it leads to
many deaths every year (Fan, Grant, Ruan, Huang, and Chou, 2019). Research has shown that
about thirty people lose their lives daily due to the habit of drinking and driving (Administration,
2019). This clearly shows that the habit of drinking and driving is a major problem in the United
States and should be given the required attention to reduce the number of deaths resulting from
the problem (Strand and Garr, 2018). This paper aims to collect the data of the people who drink
and drive in the United States, and thus help in proposing some appropriate measures which can
help in reducing these cases. The main data collection method which will be used in the
collection of the required data will be the survey method. To encourage and motivate the
5LITERATURE REVIEW
participants (people who drive) to take part in the survey process, the participants will be
promised some rewards (lunch vouchers) upon successful completion of the survey process. The
participants will also be assured that their data/information won’t be used for any other purpose
other than the intended purpose. The confidentiality of the collected data will be maintained as
required by research ethics (Petrova, Dewing, and Camilleri, 2016).
All the participants who will successfully answer all the questions which will be asked in the
survey process will be rewarded with lunch vouchers to the restaurants/hotels of their choice.
Data
The main data of our concern will be the data of the number of people who drink and
drive in the United States. This data will be collected through the survey method where some of
the people who drive will be required to answer the survey questions. It’s hard to consider all the
people who drink and drive in the United States, and so, a sample of 1000 participants will be
considered in the research. This sample size will be appropriate to help us to make the necessary
estimations and deductions about drinking and driving in the United States (Boddy, 2016).
The data required in this research will be collected through the survey method where
some survey forms with the relevant survey questions will be designed, printed and issued to the
participants. These survey forms will also be uploaded on a website, and the participants who
would like to fill the survey forms online will be given special login details which will enable
them to access the website and the survey forms (Mei and Brown, 2018). After successfully
answering all the survey questions, it will take about 12 to 24 hours for the participant to receive
his/her lunch voucher. The main data which will be collected in the survey process is shown in
the survey form below:
⊘ This is a preview!⊘
Do you want full access?
Subscribe today to unlock all pages.
Trusted by 1+ million students worldwide
6LITERATURE REVIEW
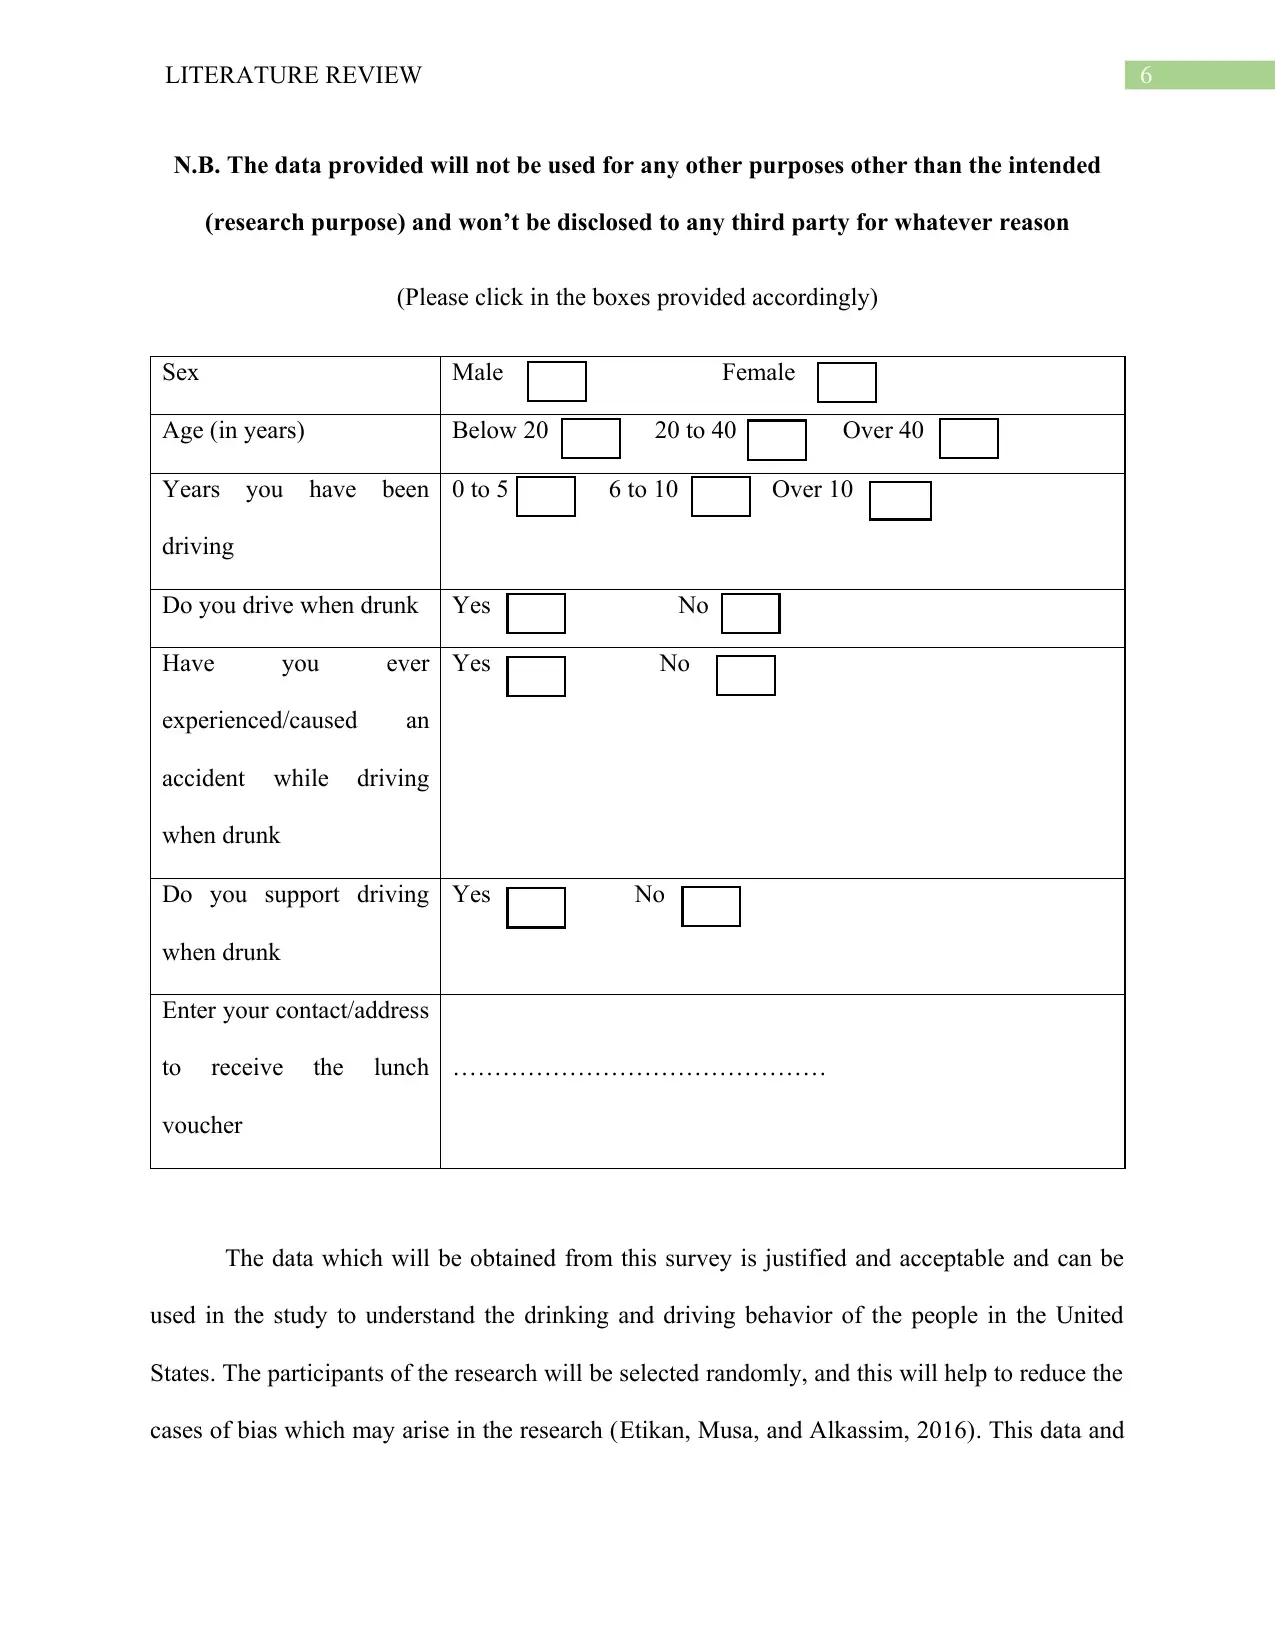
N.B. The data provided will not be used for any other purposes other than the intended
(research purpose) and won’t be disclosed to any third party for whatever reason
(Please click in the boxes provided accordingly)
Sex Male Female
Age (in years) Below 20 20 to 40 Over 40
Years you have been
driving
0 to 5 6 to 10 Over 10
Do you drive when drunk Yes No
Have you ever
experienced/caused an
accident while driving
when drunk
Yes No
Do you support driving
when drunk
Yes No
Enter your contact/address
to receive the lunch
voucher
………………………………………
The data which will be obtained from this survey is justified and acceptable and can be
used in the study to understand the drinking and driving behavior of the people in the United
States. The participants of the research will be selected randomly, and this will help to reduce the
cases of bias which may arise in the research (Etikan, Musa, and Alkassim, 2016). This data and
Paraphrase This Document
Need a fresh take? Get an instant paraphrase of this document with our AI Paraphraser
7LITERATURE REVIEW
the sampling method chosen in this research are better than the other data and sampling methods
which can be used and lead to bias in the research. This research is appropriate and justified and
can help the researchers to understand the drinking and driving behavior in the US. In statistics, a
good sample size helps to represent the characteristics of a whole population effectively, and so
using a sample size of 1000 people will help us to understand the characteristics of the whole
population, where in our case the whole population represents the entire population of the United
States (Chatterjee and Diaconis, 2018). The collected data will be operationalized and coded as
required for it to be used effectively in the data analysis stage.
The study participant’s age ranges from 18 to 60 + years, as 18 is the legal age for individuals to
apply for the license. The sample collection as random, to prevent any bias in the study. The
participant's informed consent was taken before data collection through a mail based approach.
Out of 300 mails sent, we received consent from 100 participants having 54 males and 46
females. The data collected maintained ethical regulations and obtained approval from the ethical
committee from the university. The names are kept confidential due to data privacy; the names
are numbered as 1, 2, 3. The data obtained are saved in a secured location with access to author’s
only. The results obtained are shared with the participants with no information on participants
name, address, contact number or age in specific. Since the data pool is a less and lesser number
of variables are used, the current study will employ simple statistics to find out what it implicates
against the objectives set for the study.
The methods
After collecting the required data, the main methods which will be used in the analysis of
the data will be quantitative methods of data analysis. Our research mainly aims to study
numbers, where it’s concerned with understanding the number and the percentage of the people
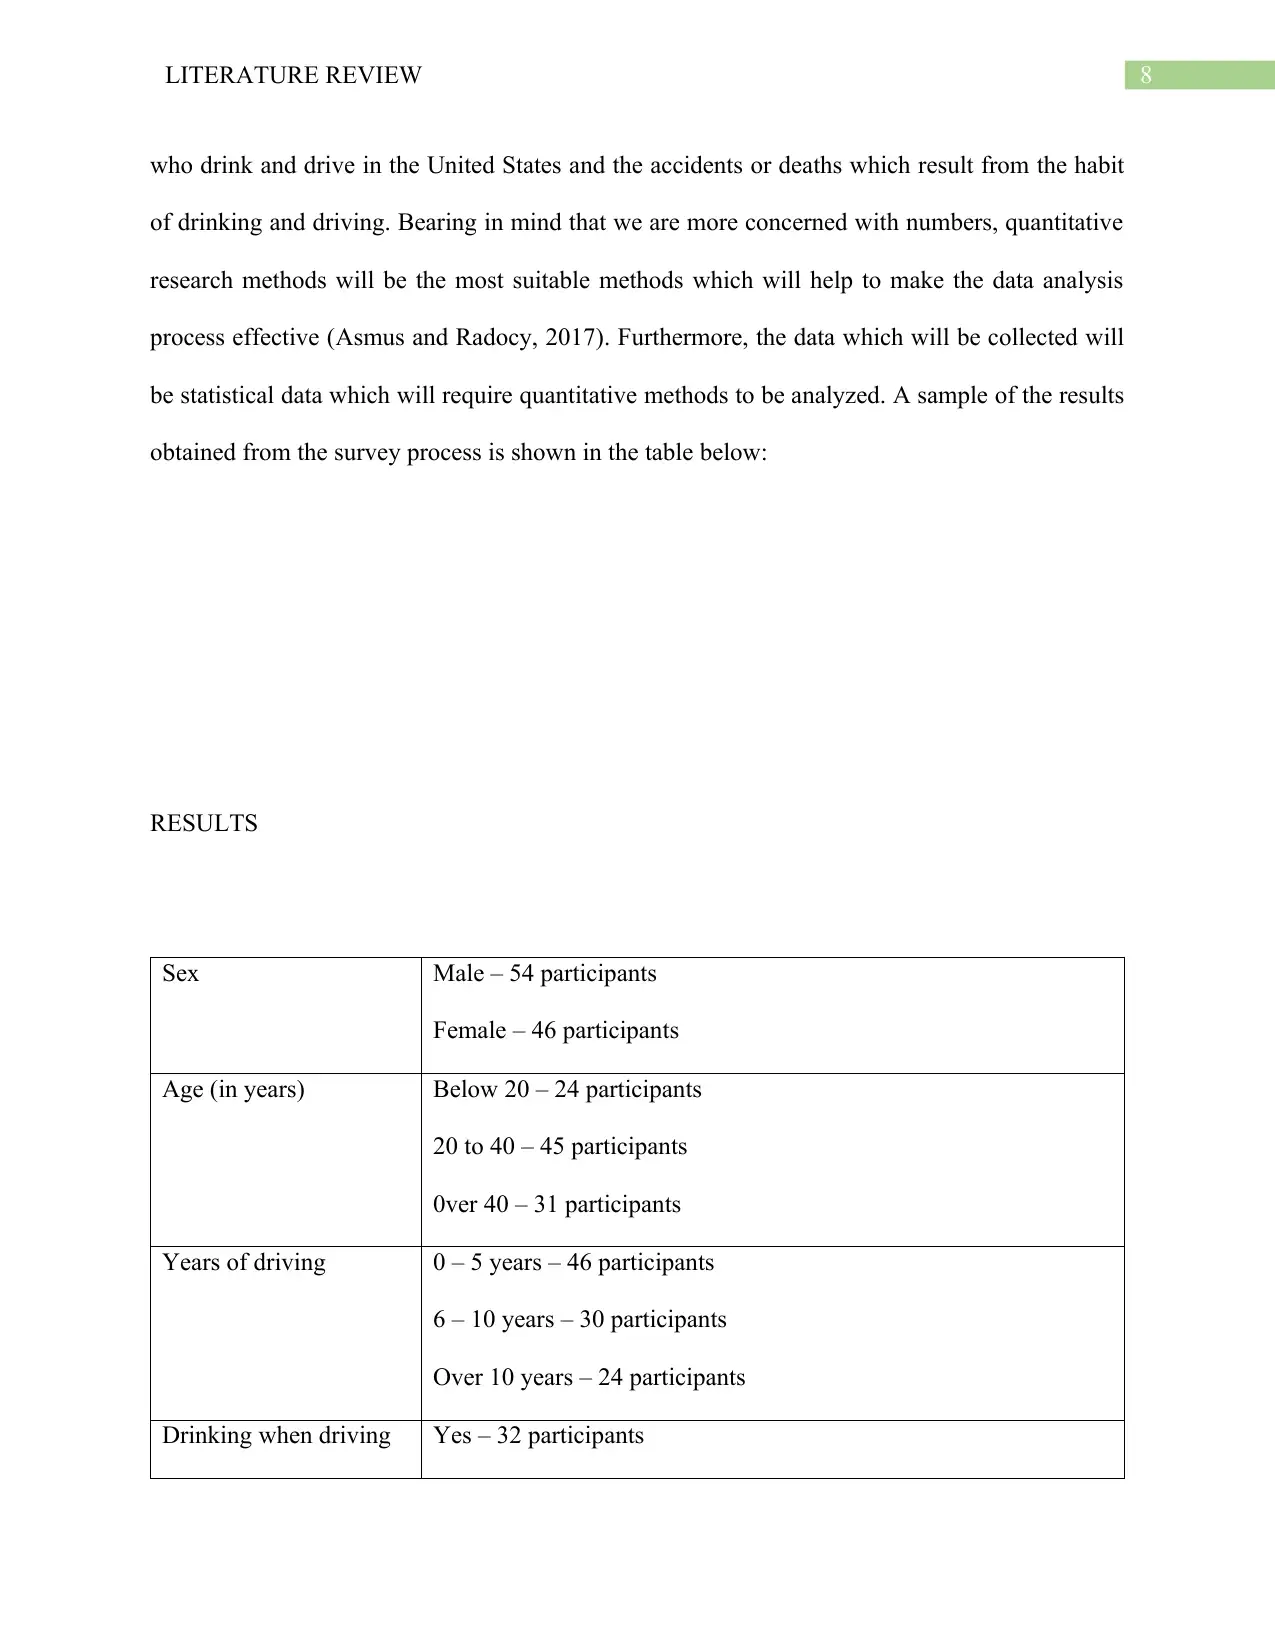
8LITERATURE REVIEW
who drink and drive in the United States and the accidents or deaths which result from the habit
of drinking and driving. Bearing in mind that we are more concerned with numbers, quantitative
research methods will be the most suitable methods which will help to make the data analysis
process effective (Asmus and Radocy, 2017). Furthermore, the data which will be collected will
be statistical data which will require quantitative methods to be analyzed. A sample of the results
obtained from the survey process is shown in the table below:
RESULTS
Sex Male – 54 participants
Female – 46 participants
Age (in years) Below 20 – 24 participants
20 to 40 – 45 participants
0ver 40 – 31 participants
Years of driving 0 – 5 years – 46 participants
6 – 10 years – 30 participants
Over 10 years – 24 participants
Drinking when driving Yes – 32 participants
⊘ This is a preview!⊘
Do you want full access?
Subscribe today to unlock all pages.
Trusted by 1+ million students worldwide
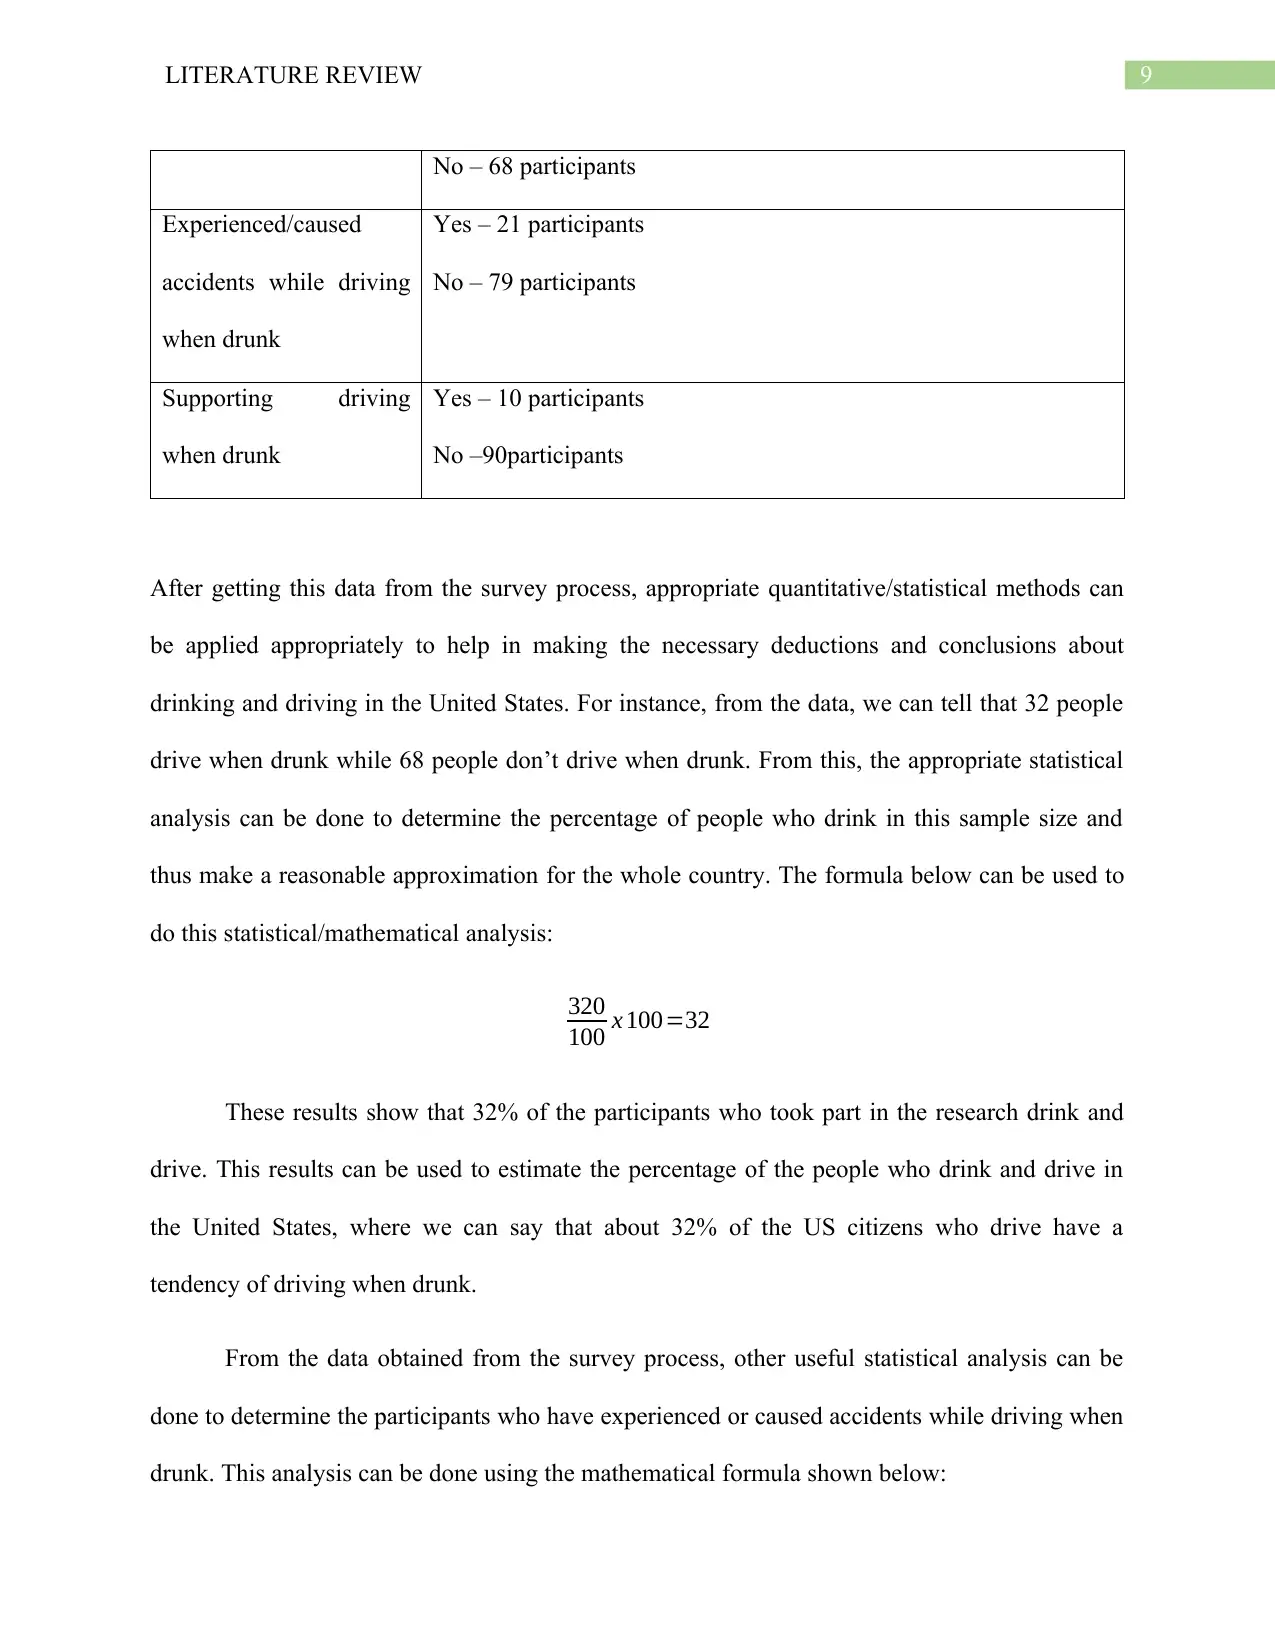
9LITERATURE REVIEW
No – 68 participants
Experienced/caused
accidents while driving
when drunk
Yes – 21 participants
No – 79 participants
Supporting driving
when drunk
Yes – 10 participants
No –90participants
After getting this data from the survey process, appropriate quantitative/statistical methods can
be applied appropriately to help in making the necessary deductions and conclusions about
drinking and driving in the United States. For instance, from the data, we can tell that 32 people
drive when drunk while 68 people don’t drive when drunk. From this, the appropriate statistical
analysis can be done to determine the percentage of people who drink in this sample size and
thus make a reasonable approximation for the whole country. The formula below can be used to
do this statistical/mathematical analysis:
320
100 x 100=32
These results show that 32% of the participants who took part in the research drink and
drive. This results can be used to estimate the percentage of the people who drink and drive in
the United States, where we can say that about 32% of the US citizens who drive have a
tendency of driving when drunk.
From the data obtained from the survey process, other useful statistical analysis can be
done to determine the participants who have experienced or caused accidents while driving when
drunk. This analysis can be done using the mathematical formula shown below:
Paraphrase This Document
Need a fresh take? Get an instant paraphrase of this document with our AI Paraphraser
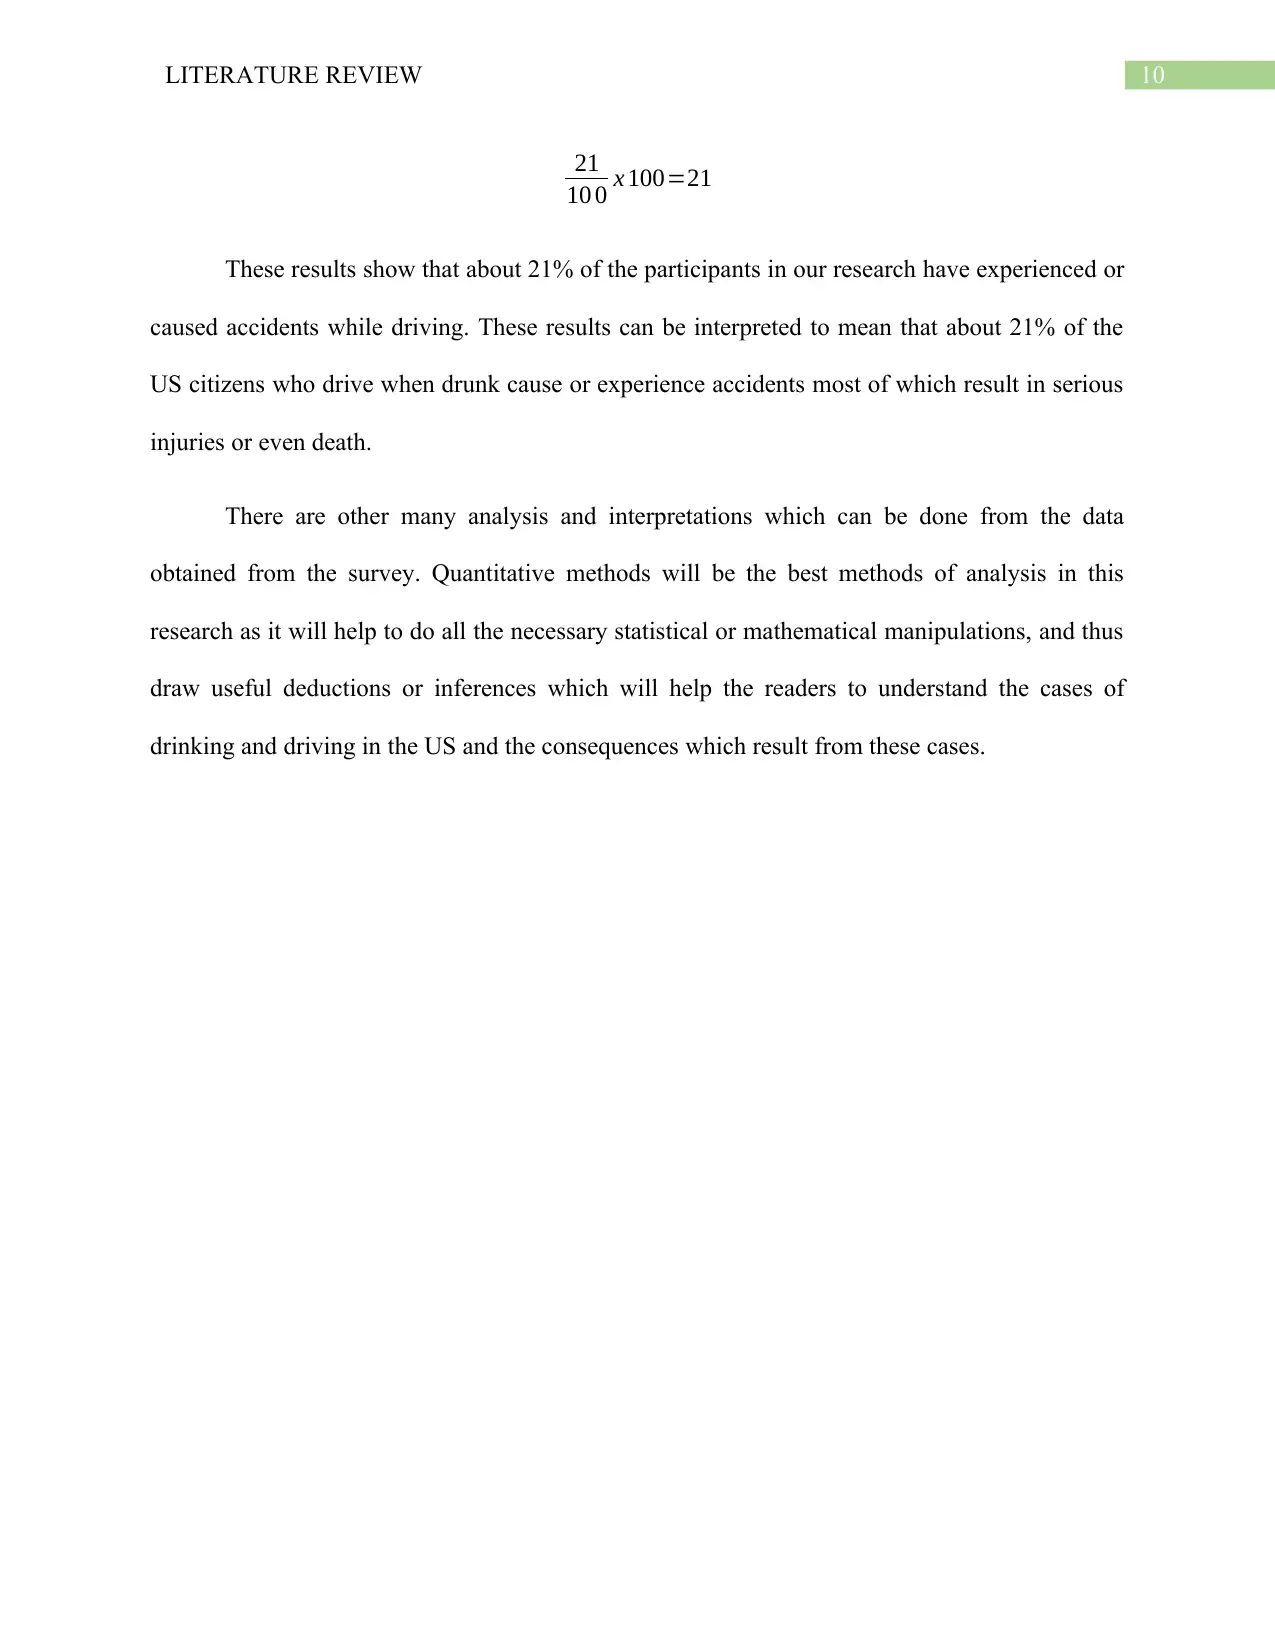
10LITERATURE REVIEW
21
10 0 x 100=21
These results show that about 21% of the participants in our research have experienced or
caused accidents while driving. These results can be interpreted to mean that about 21% of the
US citizens who drive when drunk cause or experience accidents most of which result in serious
injuries or even death.
There are other many analysis and interpretations which can be done from the data
obtained from the survey. Quantitative methods will be the best methods of analysis in this
research as it will help to do all the necessary statistical or mathematical manipulations, and thus
draw useful deductions or inferences which will help the readers to understand the cases of
drinking and driving in the US and the consequences which result from these cases.
11LITERATURE REVIEW
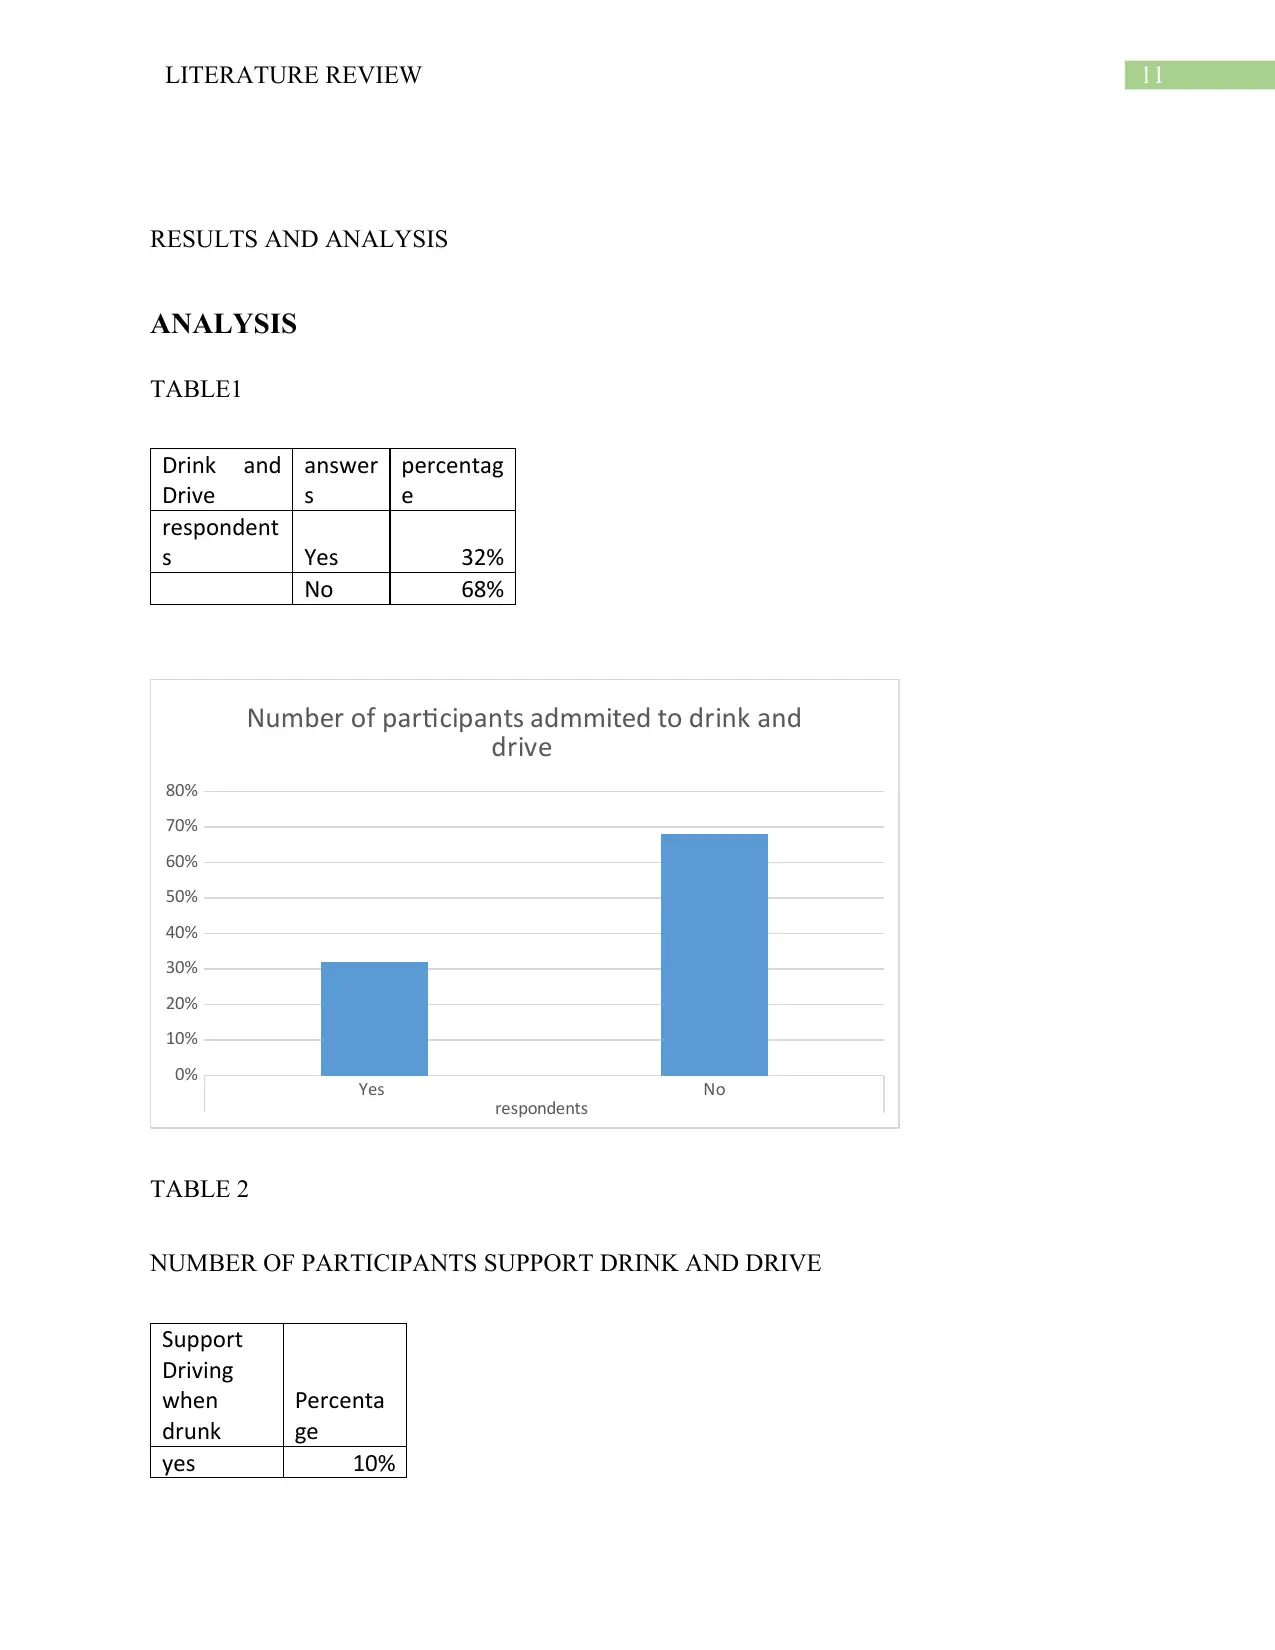
RESULTS AND ANALYSIS
ANALYSIS
TABLE1
Drink and
Drive
answer
s
percentag
e
respondent
s Yes 32%
No 68%
Yes No
respondents
0%
10%
20%
30%
40%
50%
60%
70%
80%
Number of participants admmited to drink and
drive
TABLE 2
NUMBER OF PARTICIPANTS SUPPORT DRINK AND DRIVE
Support
Driving
when
drunk
Percenta
ge
yes 10%
⊘ This is a preview!⊘
Do you want full access?
Subscribe today to unlock all pages.
Trusted by 1+ million students worldwide
1 out of 24
Related Documents


Your All-in-One AI-Powered Toolkit for Academic Success.
+13062052269
info@desklib.com
Available 24*7 on WhatsApp / Email
![[object Object]](/_next/static/media/star-bottom.7253800d.svg)
Unlock your academic potential
Copyright © 2020–2026 A2Z Services. All Rights Reserved. Developed and managed by ZUCOL.