Efficiency Evaluation of Drinking Water Treatment Plant: A Study
VerifiedAdded on 2022/08/24
|15
|10358
|28
Report
AI Summary
This research article investigates the efficiency of a drinking water treatment plant in Turkey, evaluating its effluent water quality using the Water Quality Index (WQI) and health risk assessment (HRA). The study monitored the influent and effluent water quality monthly from January 2017 to January 2019, comparing the results with Turkish and WHO drinking water standards. Principal component analysis (PCA) identified key water quality parameters, including trace elements, heavy metals, and nitrogen compounds. WQI and HRA, incorporating hazard quotient (HQ) and hazard index (HI), were used to assess water quality and potential health impacts. The WQI values indicated 'excellent' water quality for drinking purposes. The health risk assessment revealed 'negligible' acute, sub-chronic, and chronic risks from metal contamination for different age groups. The study highlights the importance of monitoring water quality and assessing health risks in drinking water treatment plants.
See discussions, stats, and author profiles for this publication at: https://www.researchgate.net/publication/333856676
Evaluation of Conventional Drinking Water Treatment Plant Efficiency
According to Water Quality Index and Health Risk Assessment
Article in Environmental Science and Pollution Research · June 2019
DOI: 10.1007/s11356-019-05801-y
CITATION
1
READS
61
1 author:
Some of the authors of this publication are also working on these related projects:
Determination of know and unknow oxidation by-products from natural organic matter fractions during chlorination, chloramination, and ozonationView project
Alper Alver
Aksaray University, Turkey, Aksaray
12PUBLICATIONS45CITATIONS
SEE PROFILE
All content following this page was uploaded by Alper Alver on 15 December 2019.
The user has requested enhancement of the downloaded file.
Paraphrase This Document
Need a fresh take? Get an instant paraphrase of this document with our AI Paraphraser
RESEARCH ARTICLE
Evaluation of conventional drinking water treatment plant efficiency
according to water quality index and health risk assessment
Alper Alver1
Received:21 March 2019 / Accepted:19 June 2019
# Springer-Verlag GmbH Germany,part of Springer Nature 2019
Abstract
The objective of this research is to investigate the effluent water quality of a treatment plant in Turkey fed fro
groundwater, according to water quality index (WOI) and health risk assessment (HRA). In order to achieve th
of the influent and effluent water of the treatment plant was monitored monthly from January 2017 to Januar
parameter results were compared with the Turkish drinking water standards and the World Health Organizati
ing that all parameters were within approved limits. Principal component analysis (PCA) was applied to determ
quality parameter impacts in the overall quality of water and the most attractive parameters were trace elem
NH3-N, NO3, and TKN. To evaluate water quality and the impacts on human health, WQI and HRA, including ha
(HQ) and hazard index (HI),were used.The WQI values were calculated by taking into account PCA results.WQI results
demonstrated that the influent and effluent of water treatment plant values have a small number of WQI rank
the water category was “excellent” for drinking purpose.Finally,metalcontamination in influentand effluentwaters was
assessed and the associated health risks to rural populations were estimated for different age groups, childre
service area of the treatment plant. The health risk assessment with similar to WQI results, the acute, sub-ch
risks of trace elements was “negligible” level, i.e., to a level affecting 1 person in 1,000,000 inhabitants.
KeywordsDrinking water. Treatment plant. Principal component analysis. Water quality index. Health risk assessment.
Non-carcinogens
Introduction
Water resources and quality are very crucial parameters, par-
ticularly in areas of severe water shortage, for urban develop-
mentand ecological environment(Vörösmarty etal. 2010).
Typically, surface waters such as dams are an important part of
the totalpotable water supply for a community.There is a
great need to good water quality because of the effect in public
health and aquatic life due to the toxicity,persistence,and
bioaccumulative nature of some trace elements,microbial
compounds,etc.(Dong etal. 2017;Li et al. 2014;Varol
2013).According to the world health organization (WHO),
statistically,water pollution is the main reason for approxi-
mately 80% ofhuman disease (Zhang etal. 2018).
Therefore,ongoing research on dissolved heavy metals can
be a key to shedding more lighton some of the effects of
pollution. In addition,one of the most direct and significant
ways to evaluate water pollution is to assess the effects of
dissolved heavy metals on human health and water system
(Jiang et al. 2017; Liang et al. 2018; Meng et al. 2016; Zha
et al. 2018). Many people are face to face about serious w
security problems related to water safety and scarcity are
creasing day by day (Vörösmarty et al. 2010). Anthropoge
factors such as industrial wastes, sewage discharge, coal c
bustion, mining, and vehicle transportation and/or natural
cesses such as bedrock weathering or volcanism increase
concentrations of these pollutants and limit the use of wat
resources in drinking, recreational, industrial, and agricult
(Hahn et al. 2018; Kazi et al. 2009; Kumar et al. 2017; Wa
et al. 2017).
The most important issue is to develop water security st
egies thatcan increase the watersupply capacity of
Responsible editor: Philippe Garrigues
* Alper Alver
alperalver@gmail.com
1 Department of Environmental Engineering, Engineering Faculty,
Aksaray University, Aksaray, Turkey
Environmental Science and Pollution Research
https://doi.org/10.1007/s11356-019-05801-y
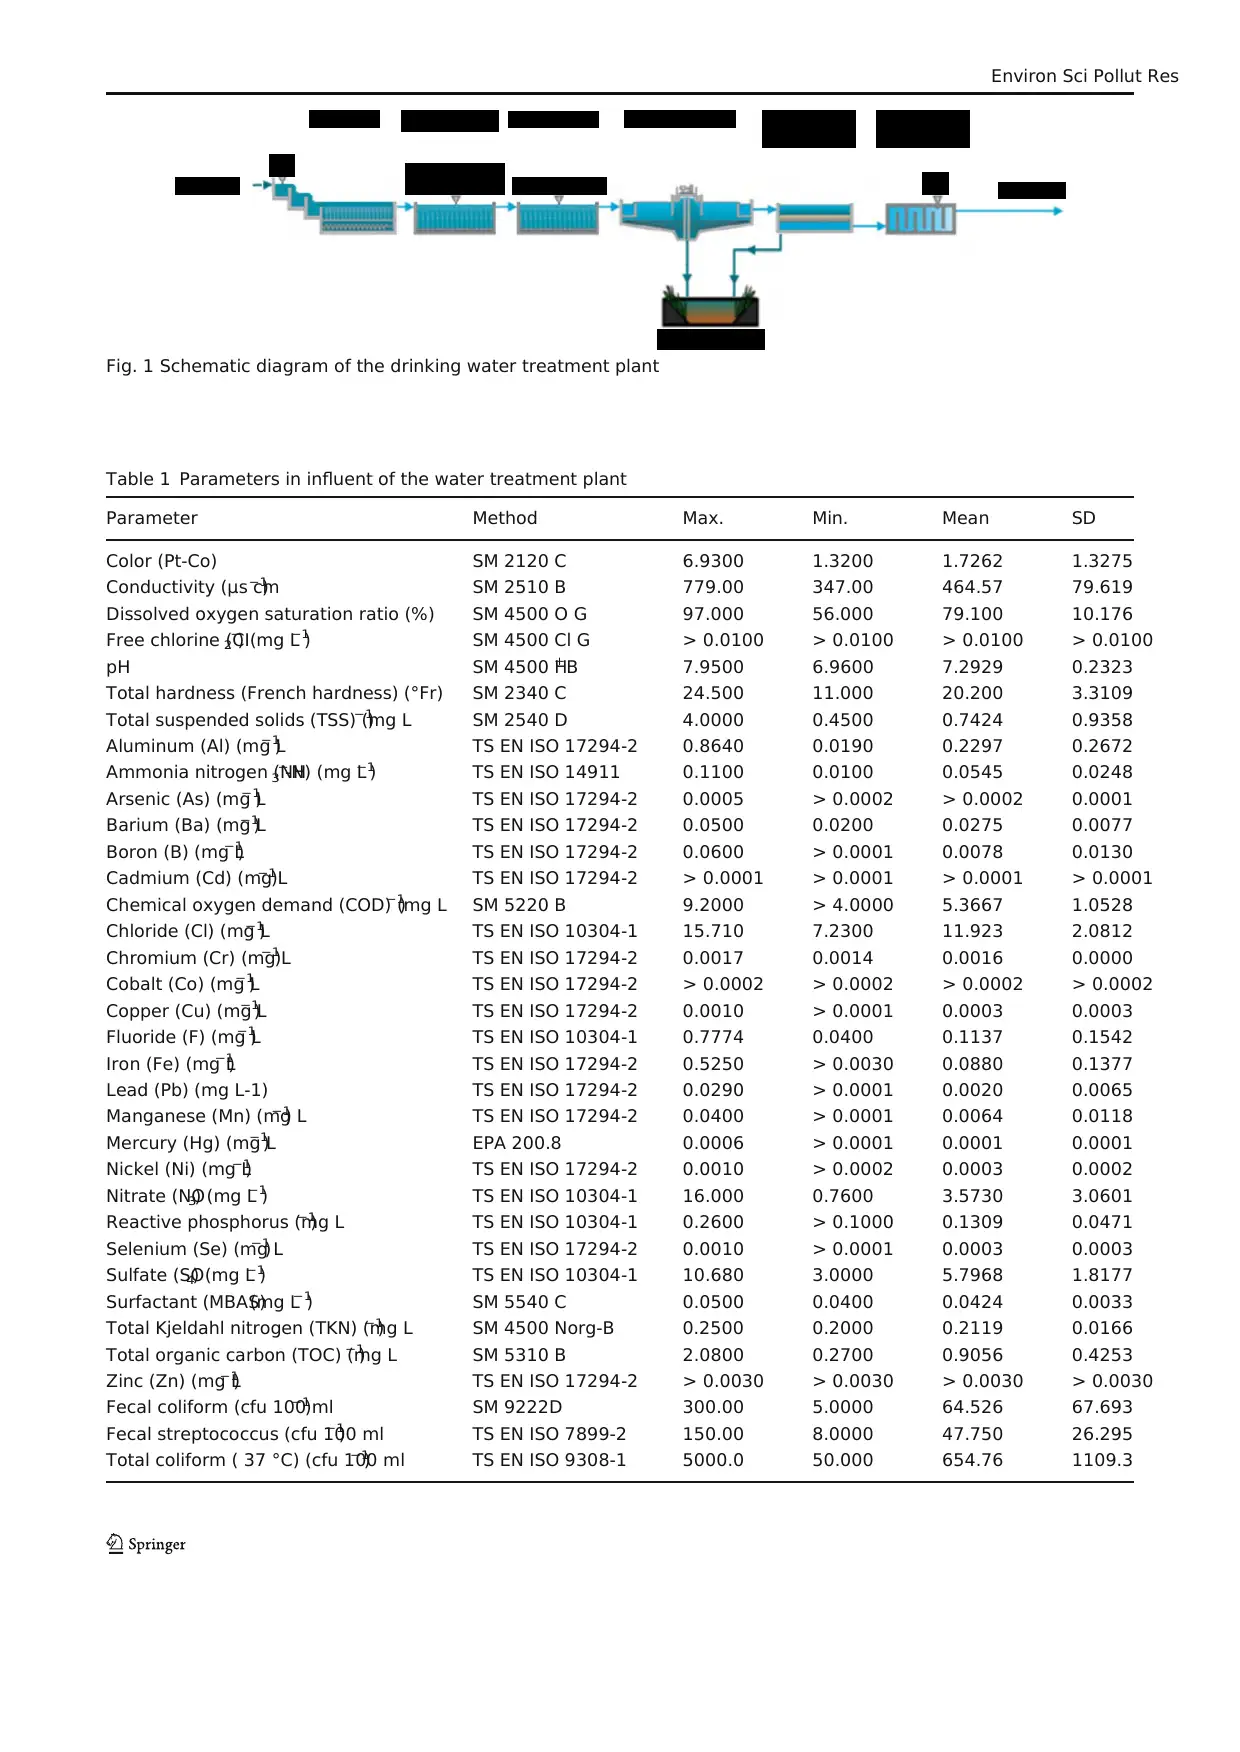
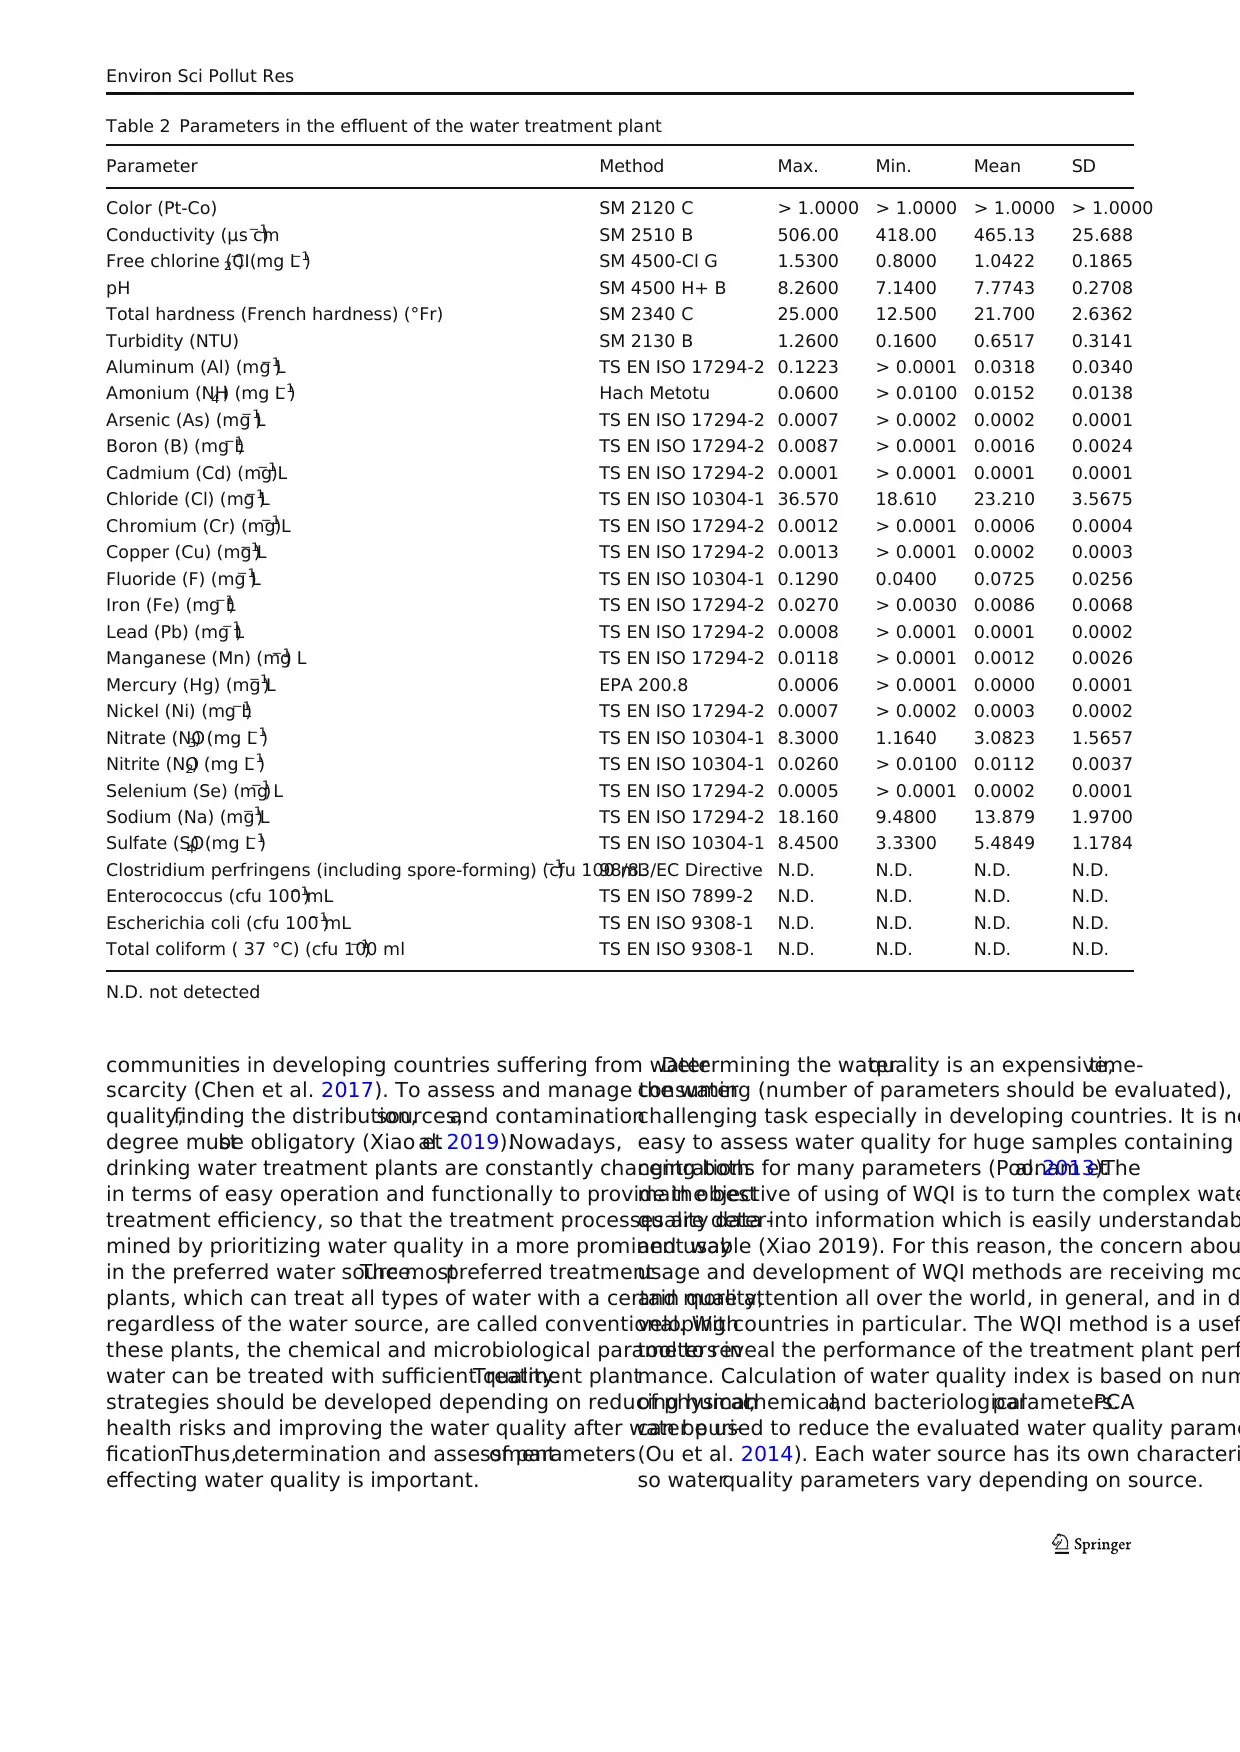
Table 1 Parameters in influent of the water treatment plant
Parameter Method Max. Min. Mean SD
Color (Pt-Co) SM 2120 C 6.9300 1.3200 1.7262 1.3275
Conductivity (μs cm−1
) SM 2510 B 779.00 347.00 464.57 79.619
Dissolved oxygen saturation ratio (%) SM 4500 O G 97.000 56.000 79.100 10.176
Free chlorine (CI2−
) (mg L−1
) SM 4500 Cl G > 0.0100 > 0.0100 > 0.0100 > 0.0100
pH SM 4500 H+B 7.9500 6.9600 7.2929 0.2323
Total hardness (French hardness) (°Fr) SM 2340 C 24.500 11.000 20.200 3.3109
Total suspended solids (TSS) (mg L−1
) SM 2540 D 4.0000 0.4500 0.7424 0.9358
Aluminum (Al) (mg L−1
) TS EN ISO 17294-2 0.8640 0.0190 0.2297 0.2672
Ammonia nitrogen (NH3−
-N) (mg L−1
) TS EN ISO 14911 0.1100 0.0100 0.0545 0.0248
Arsenic (As) (mg L−1
) TS EN ISO 17294-2 0.0005 > 0.0002 > 0.0002 0.0001
Barium (Ba) (mg L−1
) TS EN ISO 17294-2 0.0500 0.0200 0.0275 0.0077
Boron (B) (mg L−1
) TS EN ISO 17294-2 0.0600 > 0.0001 0.0078 0.0130
Cadmium (Cd) (mg L−1
) TS EN ISO 17294-2 > 0.0001 > 0.0001 > 0.0001 > 0.0001
Chemical oxygen demand (COD) (mg L−1
) SM 5220 B 9.2000 > 4.0000 5.3667 1.0528
Chloride (Cl) (mg L−1
) TS EN ISO 10304-1 15.710 7.2300 11.923 2.0812
Chromium (Cr) (mg L−1
) TS EN ISO 17294-2 0.0017 0.0014 0.0016 0.0000
Cobalt (Co) (mg L−1
) TS EN ISO 17294-2 > 0.0002 > 0.0002 > 0.0002 > 0.0002
Copper (Cu) (mg L−1
) TS EN ISO 17294-2 0.0010 > 0.0001 0.0003 0.0003
Fluoride (F) (mg L−1
) TS EN ISO 10304-1 0.7774 0.0400 0.1137 0.1542
Iron (Fe) (mg L−1
) TS EN ISO 17294-2 0.5250 > 0.0030 0.0880 0.1377
Lead (Pb) (mg L-1) TS EN ISO 17294-2 0.0290 > 0.0001 0.0020 0.0065
Manganese (Mn) (mg L−1
) TS EN ISO 17294-2 0.0400 > 0.0001 0.0064 0.0118
Mercury (Hg) (mg L−1
) EPA 200.8 0.0006 > 0.0001 0.0001 0.0001
Nickel (Ni) (mg L−1
) TS EN ISO 17294-2 0.0010 > 0.0002 0.0003 0.0002
Nitrate (NO3) (mg L−1
) TS EN ISO 10304-1 16.000 0.7600 3.5730 3.0601
Reactive phosphorus (mg L−1
) TS EN ISO 10304-1 0.2600 > 0.1000 0.1309 0.0471
Selenium (Se) (mg L−1
) TS EN ISO 17294-2 0.0010 > 0.0001 0.0003 0.0003
Sulfate (SO4) (mg L−1
) TS EN ISO 10304-1 10.680 3.0000 5.7968 1.8177
Surfactant (MBAS)(mg L−1
) SM 5540 C 0.0500 0.0400 0.0424 0.0033
Total Kjeldahl nitrogen (TKN) (mg L−1
) SM 4500 Norg-B 0.2500 0.2000 0.2119 0.0166
Total organic carbon (TOC) (mg L−1
) SM 5310 B 2.0800 0.2700 0.9056 0.4253
Zinc (Zn) (mg L−1
) TS EN ISO 17294-2 > 0.0030 > 0.0030 > 0.0030 > 0.0030
Fecal coliform (cfu 100 ml−1
) SM 9222D 300.00 5.0000 64.526 67.693
Fecal streptococcus (cfu 100 ml−1
) TS EN ISO 7899-2 150.00 8.0000 47.750 26.295
Total coliform ( 37 °C) (cfu 100 ml−1
) TS EN ISO 9308-1 5000.0 50.000 654.76 1109.3
Fig. 1 Schematic diagram of the drinking water treatment plant
Environ Sci Pollut Res
⊘ This is a preview!⊘
Do you want full access?
Subscribe today to unlock all pages.
Trusted by 1+ million students worldwide
communities in developing countries suffering from water
scarcity (Chen et al. 2017). To assess and manage the water
quality,finding the distribution,sources,and contamination
degree mustbe obligatory (Xiao etal. 2019).Nowadays,
drinking water treatment plants are constantly changing both
in terms of easy operation and functionally to provide the best
treatment efficiency, so that the treatment processes are deter-
mined by prioritizing water quality in a more prominent way
in the preferred water source.The mostpreferred treatment
plants, which can treat all types of water with a certain quality,
regardless of the water source, are called conventional. With
these plants, the chemical and microbiological parameters in
water can be treated with sufficient quality.Treatment plant
strategies should be developed depending on reducing human
health risks and improving the water quality after water puri-
fication.Thus,determination and assessmentof parameters
effecting water quality is important.
Determining the waterquality is an expensive,time-
consuming (number of parameters should be evaluated), a
challenging task especially in developing countries. It is no
easy to assess water quality for huge samples containing
centrations for many parameters (Poonam etal.2013).The
main objective of using of WQI is to turn the complex wate
quality data into information which is easily understandab
and usable (Xiao 2019). For this reason, the concern abou
usage and development of WQI methods are receiving mo
and more attention all over the world, in general, and in d
veloping countries in particular. The WQI method is a usef
tool to reveal the performance of the treatment plant perf
mance. Calculation of water quality index is based on num
of physical,chemical,and bacteriologicalparameters.PCA
can be used to reduce the evaluated water quality parame
(Ou et al. 2014). Each water source has its own characteri
so waterquality parameters vary depending on source.
Table 2 Parameters in the effluent of the water treatment plant
Parameter Method Max. Min. Mean SD
Color (Pt-Co) SM 2120 C > 1.0000 > 1.0000 > 1.0000 > 1.0000
Conductivity (μs cm−1
) SM 2510 B 506.00 418.00 465.13 25.688
Free chlorine (CI2−
) (mg L−1
) SM 4500-Cl G 1.5300 0.8000 1.0422 0.1865
pH SM 4500 H+ B 8.2600 7.1400 7.7743 0.2708
Total hardness (French hardness) (°Fr) SM 2340 C 25.000 12.500 21.700 2.6362
Turbidity (NTU) SM 2130 B 1.2600 0.1600 0.6517 0.3141
Aluminum (Al) (mg L−1
) TS EN ISO 17294-2 0.1223 > 0.0001 0.0318 0.0340
Amonium (NH4 ) (mg L−1
) Hach Metotu 0.0600 > 0.0100 0.0152 0.0138
Arsenic (As) (mg L−1
) TS EN ISO 17294-2 0.0007 > 0.0002 0.0002 0.0001
Boron (B) (mg L−1
) TS EN ISO 17294-2 0.0087 > 0.0001 0.0016 0.0024
Cadmium (Cd) (mg L−1
) TS EN ISO 17294-2 0.0001 > 0.0001 0.0001 0.0001
Chloride (Cl) (mg L−1
) TS EN ISO 10304-1 36.570 18.610 23.210 3.5675
Chromium (Cr) (mg L−1
) TS EN ISO 17294-2 0.0012 > 0.0001 0.0006 0.0004
Copper (Cu) (mg L−1
) TS EN ISO 17294-2 0.0013 > 0.0001 0.0002 0.0003
Fluoride (F) (mg L−1
) TS EN ISO 10304-1 0.1290 0.0400 0.0725 0.0256
Iron (Fe) (mg L−1
) TS EN ISO 17294-2 0.0270 > 0.0030 0.0086 0.0068
Lead (Pb) (mg L−1
) TS EN ISO 17294-2 0.0008 > 0.0001 0.0001 0.0002
Manganese (Mn) (mg L−1
) TS EN ISO 17294-2 0.0118 > 0.0001 0.0012 0.0026
Mercury (Hg) (mg L−1
) EPA 200.8 0.0006 > 0.0001 0.0000 0.0001
Nickel (Ni) (mg L−1
) TS EN ISO 17294-2 0.0007 > 0.0002 0.0003 0.0002
Nitrate (NO3) (mg L−1
) TS EN ISO 10304-1 8.3000 1.1640 3.0823 1.5657
Nitrite (NO2) (mg L−1
) TS EN ISO 10304-1 0.0260 > 0.0100 0.0112 0.0037
Selenium (Se) (mg L−1
) TS EN ISO 17294-2 0.0005 > 0.0001 0.0002 0.0001
Sodium (Na) (mg L−1
) TS EN ISO 17294-2 18.160 9.4800 13.879 1.9700
Sulfate (SO4) (mg L−1
) TS EN ISO 10304-1 8.4500 3.3300 5.4849 1.1784
Clostridium perfringens (including spore-forming) (cfu 100 mL−1
) 98/83/EC Directive N.D. N.D. N.D. N.D.
Enterococcus (cfu 100 mL−1
) TS EN ISO 7899-2 N.D. N.D. N.D. N.D.
Escherichia coli (cfu 100 mL−1
) TS EN ISO 9308-1 N.D. N.D. N.D. N.D.
Total coliform ( 37 °C) (cfu 100 ml−1
) TS EN ISO 9308-1 N.D. N.D. N.D. N.D.
N.D. not detected
Environ Sci Pollut Res
Paraphrase This Document
Need a fresh take? Get an instant paraphrase of this document with our AI Paraphraser
Therefore,the relative weight values of parameters must be
determined for each source in WQI calculations. Otherwise,
consistent results may not be obtained.
HRA is a very good technique for revealing the harmful
parameter effects on human health. Studies on HRA mainly
focus on trace elements and heavy metals because the effects
of some water quality parameters on living organisms (lethal
dose) have not been determined (Avigliano et al. 2019; Xiao
et al. 2019). HRA is used to determine the acute, sub-chronic,
and chronic effects thatmay occur when exposed to trace
elements by oral or dermal routes, and this is an important tool
in evaluating treatment performance. Different effects can be
observed in different age groups.
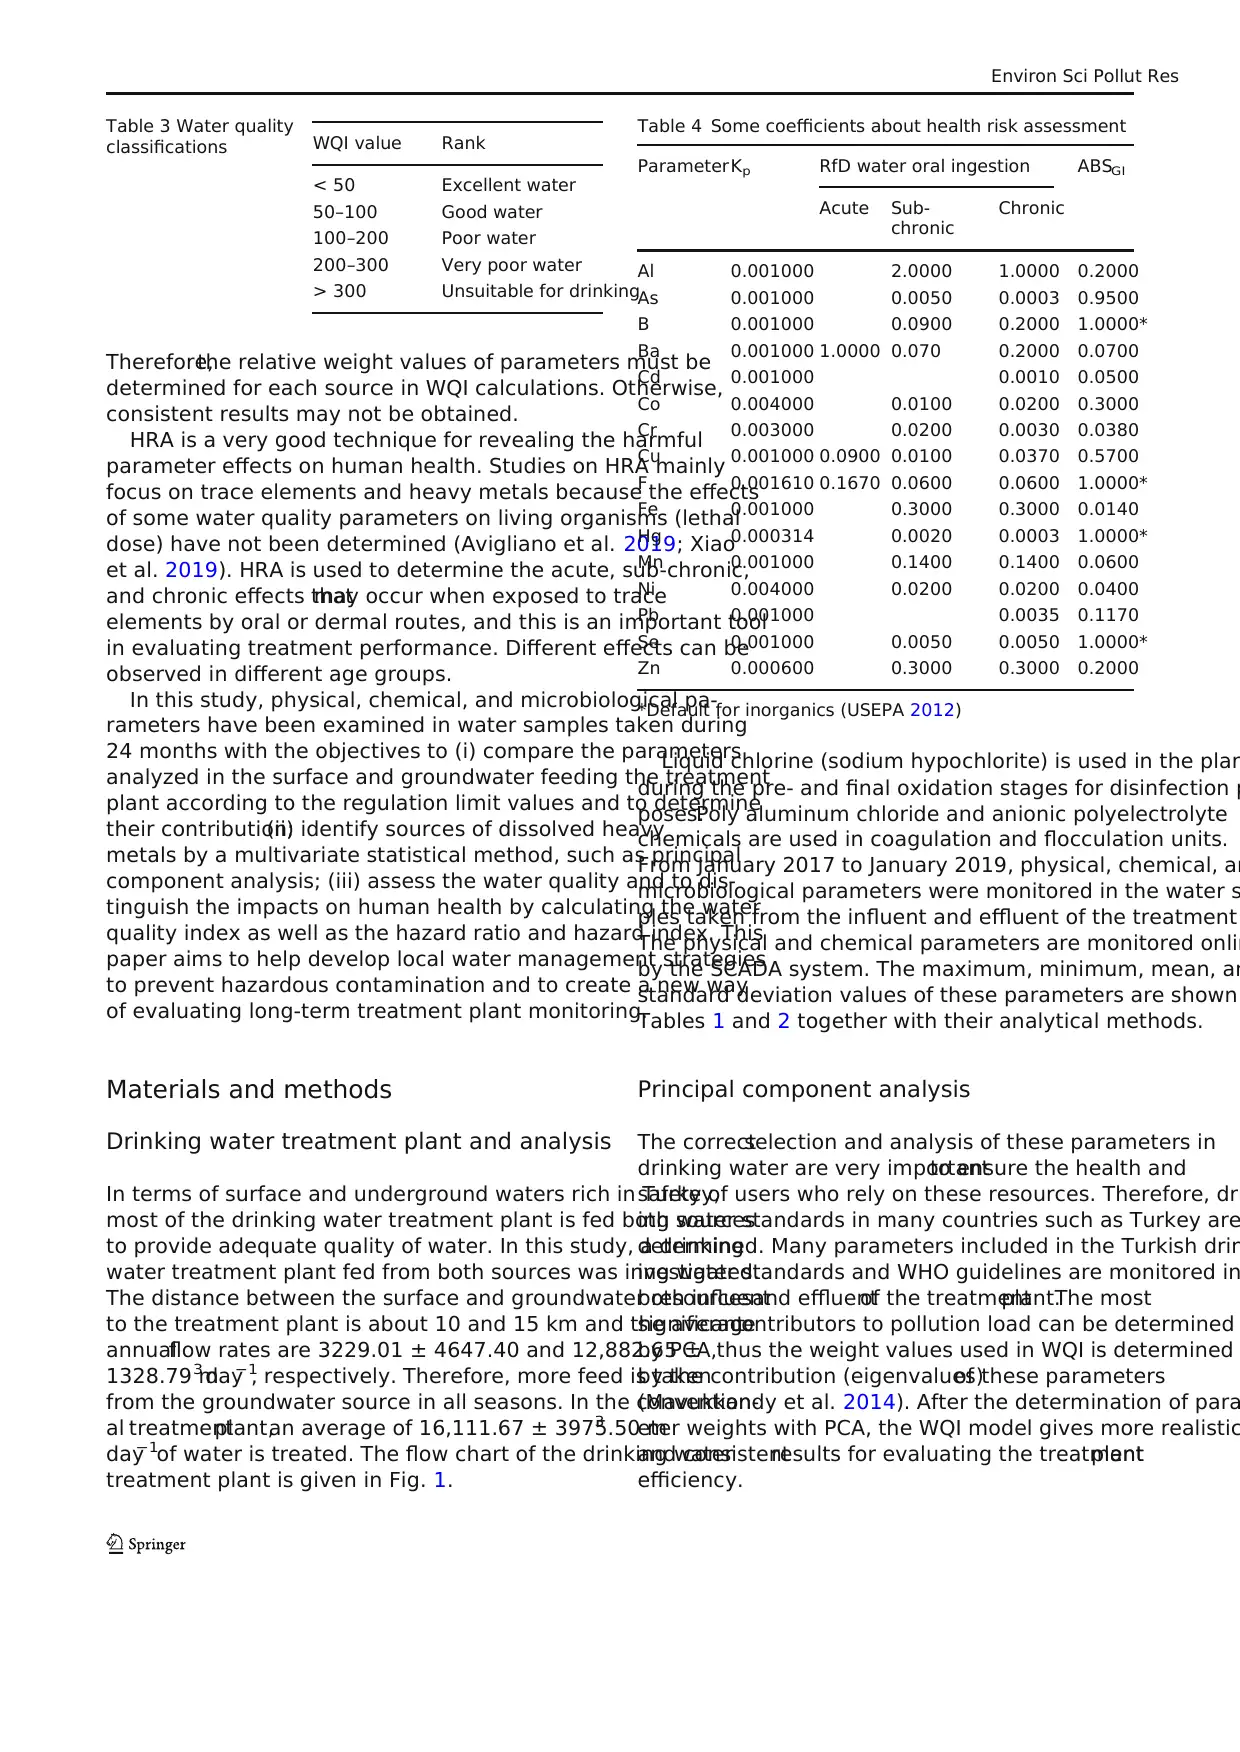
In this study, physical, chemical, and microbiological pa-
rameters have been examined in water samples taken during
24 months with the objectives to (i) compare the parameters
analyzed in the surface and groundwater feeding the treatment
plant according to the regulation limit values and to determine
their contribution;(ii) identify sources of dissolved heavy
metals by a multivariate statistical method, such as principal
component analysis; (iii) assess the water quality and to dis-
tinguish the impacts on human health by calculating the water
quality index as well as the hazard ratio and hazard index. This
paper aims to help develop local water management strategies
to prevent hazardous contamination and to create a new way
of evaluating long-term treatment plant monitoring.
Materials and methods
Drinking water treatment plant and analysis
In terms of surface and underground waters rich in Turkey,
most of the drinking water treatment plant is fed both sources
to provide adequate quality of water. In this study, a drinking
water treatment plant fed from both sources was investigated.
The distance between the surface and groundwater resources
to the treatment plant is about 10 and 15 km and the average
annualflow rates are 3229.01 ± 4647.40 and 12,882.65 ±
1328.79 m3 day−1
, respectively. Therefore, more feed is taken
from the groundwater source in all seasons. In the convention-
al treatmentplant,an average of 16,111.67 ± 3975.50 m3
day−1of water is treated. The flow chart of the drinking water
treatment plant is given in Fig. 1.
Liquid chlorine (sodium hypochlorite) is used in the plan
during the pre- and final oxidation stages for disinfection p
poses.Poly aluminum chloride and anionic polyelectrolyte
chemicals are used in coagulation and flocculation units.
From January 2017 to January 2019, physical, chemical, an
microbiological parameters were monitored in the water s
ples taken from the influent and effluent of the treatment
The physical and chemical parameters are monitored onlin
by the SCADA system. The maximum, minimum, mean, an
standard deviation values of these parameters are shown
Tables 1 and 2 together with their analytical methods.
Principal component analysis
The correctselection and analysis of these parameters in
drinking water are very importantto ensure the health and
safety of users who rely on these resources. Therefore, dri
ing water standards in many countries such as Turkey are
determined. Many parameters included in the Turkish drin
ing water standards and WHO guidelines are monitored in
both influentand effluentof the treatmentplant.The most
significantcontributors to pollution load can be determined
by PCA,thus the weight values used in WQI is determined
by the contribution (eigenvalues)of these parameters
(Mavukkandy et al. 2014). After the determination of para
eter weights with PCA, the WQI model gives more realistic
and consistentresults for evaluating the treatmentplant
efficiency.
Table 4 Some coefficients about health risk assessment
ParameterK p RfD water oral ingestion ABSGI
Acute Sub-
chronic
Chronic
Al 0.001000 2.0000 1.0000 0.2000
As 0.001000 0.0050 0.0003 0.9500
B 0.001000 0.0900 0.2000 1.0000*
Ba 0.001000 1.0000 0.070 0.2000 0.0700
Cd 0.001000 0.0010 0.0500
Co 0.004000 0.0100 0.0200 0.3000
Cr 0.003000 0.0200 0.0030 0.0380
Cu 0.001000 0.0900 0.0100 0.0370 0.5700
F 0.001610 0.1670 0.0600 0.0600 1.0000*
Fe 0.001000 0.3000 0.3000 0.0140
Hg 0.000314 0.0020 0.0003 1.0000*
Mn 0.001000 0.1400 0.1400 0.0600
Ni 0.004000 0.0200 0.0200 0.0400
Pb 0.001000 0.0035 0.1170
Se 0.001000 0.0050 0.0050 1.0000*
Zn 0.000600 0.3000 0.3000 0.2000
*Default for inorganics (USEPA 2012)
Table 3 Water quality
classifications WQI value Rank
< 50 Excellent water
50–100 Good water
100–200 Poor water
200–300 Very poor water
> 300 Unsuitable for drinking
Environ Sci Pollut Res
determined for each source in WQI calculations. Otherwise,
consistent results may not be obtained.
HRA is a very good technique for revealing the harmful
parameter effects on human health. Studies on HRA mainly
focus on trace elements and heavy metals because the effects
of some water quality parameters on living organisms (lethal
dose) have not been determined (Avigliano et al. 2019; Xiao
et al. 2019). HRA is used to determine the acute, sub-chronic,
and chronic effects thatmay occur when exposed to trace
elements by oral or dermal routes, and this is an important tool
in evaluating treatment performance. Different effects can be
observed in different age groups.
In this study, physical, chemical, and microbiological pa-
rameters have been examined in water samples taken during
24 months with the objectives to (i) compare the parameters
analyzed in the surface and groundwater feeding the treatment
plant according to the regulation limit values and to determine
their contribution;(ii) identify sources of dissolved heavy
metals by a multivariate statistical method, such as principal
component analysis; (iii) assess the water quality and to dis-
tinguish the impacts on human health by calculating the water
quality index as well as the hazard ratio and hazard index. This
paper aims to help develop local water management strategies
to prevent hazardous contamination and to create a new way
of evaluating long-term treatment plant monitoring.
Materials and methods
Drinking water treatment plant and analysis
In terms of surface and underground waters rich in Turkey,
most of the drinking water treatment plant is fed both sources
to provide adequate quality of water. In this study, a drinking
water treatment plant fed from both sources was investigated.
The distance between the surface and groundwater resources
to the treatment plant is about 10 and 15 km and the average
annualflow rates are 3229.01 ± 4647.40 and 12,882.65 ±
1328.79 m3 day−1
, respectively. Therefore, more feed is taken
from the groundwater source in all seasons. In the convention-
al treatmentplant,an average of 16,111.67 ± 3975.50 m3
day−1of water is treated. The flow chart of the drinking water
treatment plant is given in Fig. 1.
Liquid chlorine (sodium hypochlorite) is used in the plan
during the pre- and final oxidation stages for disinfection p
poses.Poly aluminum chloride and anionic polyelectrolyte
chemicals are used in coagulation and flocculation units.
From January 2017 to January 2019, physical, chemical, an
microbiological parameters were monitored in the water s
ples taken from the influent and effluent of the treatment
The physical and chemical parameters are monitored onlin
by the SCADA system. The maximum, minimum, mean, an
standard deviation values of these parameters are shown
Tables 1 and 2 together with their analytical methods.
Principal component analysis
The correctselection and analysis of these parameters in
drinking water are very importantto ensure the health and
safety of users who rely on these resources. Therefore, dri
ing water standards in many countries such as Turkey are
determined. Many parameters included in the Turkish drin
ing water standards and WHO guidelines are monitored in
both influentand effluentof the treatmentplant.The most
significantcontributors to pollution load can be determined
by PCA,thus the weight values used in WQI is determined
by the contribution (eigenvalues)of these parameters
(Mavukkandy et al. 2014). After the determination of para
eter weights with PCA, the WQI model gives more realistic
and consistentresults for evaluating the treatmentplant
efficiency.
Table 4 Some coefficients about health risk assessment
ParameterK p RfD water oral ingestion ABSGI
Acute Sub-
chronic
Chronic
Al 0.001000 2.0000 1.0000 0.2000
As 0.001000 0.0050 0.0003 0.9500
B 0.001000 0.0900 0.2000 1.0000*
Ba 0.001000 1.0000 0.070 0.2000 0.0700
Cd 0.001000 0.0010 0.0500
Co 0.004000 0.0100 0.0200 0.3000
Cr 0.003000 0.0200 0.0030 0.0380
Cu 0.001000 0.0900 0.0100 0.0370 0.5700
F 0.001610 0.1670 0.0600 0.0600 1.0000*
Fe 0.001000 0.3000 0.3000 0.0140
Hg 0.000314 0.0020 0.0003 1.0000*
Mn 0.001000 0.1400 0.1400 0.0600
Ni 0.004000 0.0200 0.0200 0.0400
Pb 0.001000 0.0035 0.1170
Se 0.001000 0.0050 0.0050 1.0000*
Zn 0.000600 0.3000 0.3000 0.2000
*Default for inorganics (USEPA 2012)
Table 3 Water quality
classifications WQI value Rank
< 50 Excellent water
50–100 Good water
100–200 Poor water
200–300 Very poor water
> 300 Unsuitable for drinking
Environ Sci Pollut Res
Water quality index
WQI model was used to determine the overall effect of differ-
ent water parameters. The WQI model can bring some advan-
tages such as various water sources can be compared easily,
giving information aboutwater quality and determining the
water quality changes with time and providing an important
tool for environmental management purposes (Effendi 2016;
Jha et al. 2015).
The weight numbers of each parameter for calculating the
WQI were assigned due to their relative effects on human
health and significance on drinking purpose (Meng etal.
2016) and according to the PCA results.The WQI can be
computed with lots of parameters such as the relative weight
(Wi), the quality rating (qi), and parameter sub-index (Si). The
WQI value can be obtained from the following equations
(Eqs. 1–4).
Wi ¼wi
∑
n
i¼1
wi ð1Þ
qi ¼Ci
Si 100 ð2Þ
SIi ¼ Wi qi ð3Þ
WQI ¼ ∑
n
i¼1
SIi ð4Þ
where n is the number of parameters,wi is the parameter
weightand Wi is the relative weight,qi is the rating factor,
Ci is the concentrations of the parameters which monitored,
and Si is the standard of each parameter according to the na-
tional and international guidelines (WHO 2004). SIi is the sub-
indexes of parameters (Ramakrishnaiah et al. 2009). The wa-
ter quality rating includes five categories as defined the
Table 3 (Yidana and Yidana 2010).
Health risk assessment
Human health risk evaluation was employed using hazard
quotient,directingestion,and dermalabsorption according
to the other studies calculations (de Jesus Gaffney etal.
2015; Zeng et al. 2015). Based on risk guidelines of USEPA
(2012),the adsorbed daily dose for directoralingestion
(ADDwateroralingestion) and dermal absorption (ADDwaterskin
dermal) was computed from the following equations:
ADDwater oral ingestion¼ Cw IRW ET EF dy ED
BW AT n
ð5Þ
ET ¼ EFhd
CFhd
ð6Þ
where Cw was the contaminant mean concentration in wate
(μg L−1
); IRW was the drinking water ingestion rate (L day−1
)
or incidental water ingestion rate (L day−1
), 2.5 for adults and
0.78 for children; ET was the exposure time (h day−1
); EFhd
was the exposure frequency (h day−1
), 17.04 for adults and
13.68 for children;CFhd was the conversion factor (24 h
day−1
); EFdy was the exposure frequency (day year−1
), 350
in this study;ED was the exposure duration (year),26 for
adults and 6 for children; BW was the body weight (kg), 80
for adults and 15 for children; and ATn was the averaging time
for non-carcinogens (day),25,550 for adults and 2190 for
children (EPA 2018)
ADDwater skin dermal
¼ DAwater SA EF evd EF dy ED
BW AT n
ð7Þ
DAwater¼ Kp C w CF clð Þ t event ð8Þ
where ADDwsdwas the absorbed daily dose from contact with
water (mg kg−1
·day−1
); SA was the exposed skin area (cm2),
19,652 for adults and 6365 for children; EFevdwas the event
frequency (events day−1
), 1 in this study; DAwaterwas the dose
absorbed perunit area perwatercontactevent(mg
cm−2
·event−1
); CF cl was the conversion factor(10−3 L
cm−3
); teventwas the duration of exposure event (h event−1
),
K p was the dermal permeability coefficient (cm h−1
), defined
in Table 4 (EPA 2018).
1.E-06
1.E-05
1.E-04
1.E-03
1.E-02
1.E-01
1.E+00
1.E+01
1.E+02
1.E+03
1.E+04
D.O.
Cond.
pH
Color
Free CI2
TSS
T.Hard.
Al
NH3 -N
As
Cu
Ba
B
Hg
Zn
Fe
F
Cd
COD
Cl
Co
Pb
Mn
Ni
NO3
P
Se
SO4
TKN
Cr
TOC
MBAS
F. Coliform
F. Streptococcus
T. Coliform
Fig. 2 The concentration
distribution of the parameters in
the influent of the treatment plant.
The units of all parameters are as
given in Table 1
Environ Sci Pollut Res
⊘ This is a preview!⊘
Do you want full access?
Subscribe today to unlock all pages.
Trusted by 1+ million students worldwide
Hazard quotient for oralingestion and skin dermalwere
given in the following equations:
HQwater oral ingestion¼ADDwater oral ingestion
=RfDwater oral ingestion ð9Þ
HQwater skin dermal¼ADDwater skin dermal
=RfDwater skin dermal ð10Þ
RfDwater skin dermal¼ RfDwater oral ingestionABS GI ð11Þ
Hazard Index HIð Þ
¼ ∑ HQwater oral ingestionþ HQwater skin dermal ð12Þ
where ABSGI was the gastrointestinal absorption factor, which
is dimensionless.
Hazard index is the sum ofthe HQs for individual
elements from both the applicable pathways mentioned
previously,which is used to analyze the totalpotential
non-carcinogenic risk.Risk level can be divided into four
different classifications according to the HQ or HI values.
When HQ or HI < 0.1,the chronic risk is negligible and
the cancer risk is very low; when 0.1 ≤ HQ or HI < 1, the
chronic and cancer risks are low; when 1 ≤ HQ or HI < 4,
the chronic and cancer risks are medium; if HQ or HI ≥ 4,
the chronic and cancer risks are very high.
Results and discussion
General characterization of influent and effluent
waters
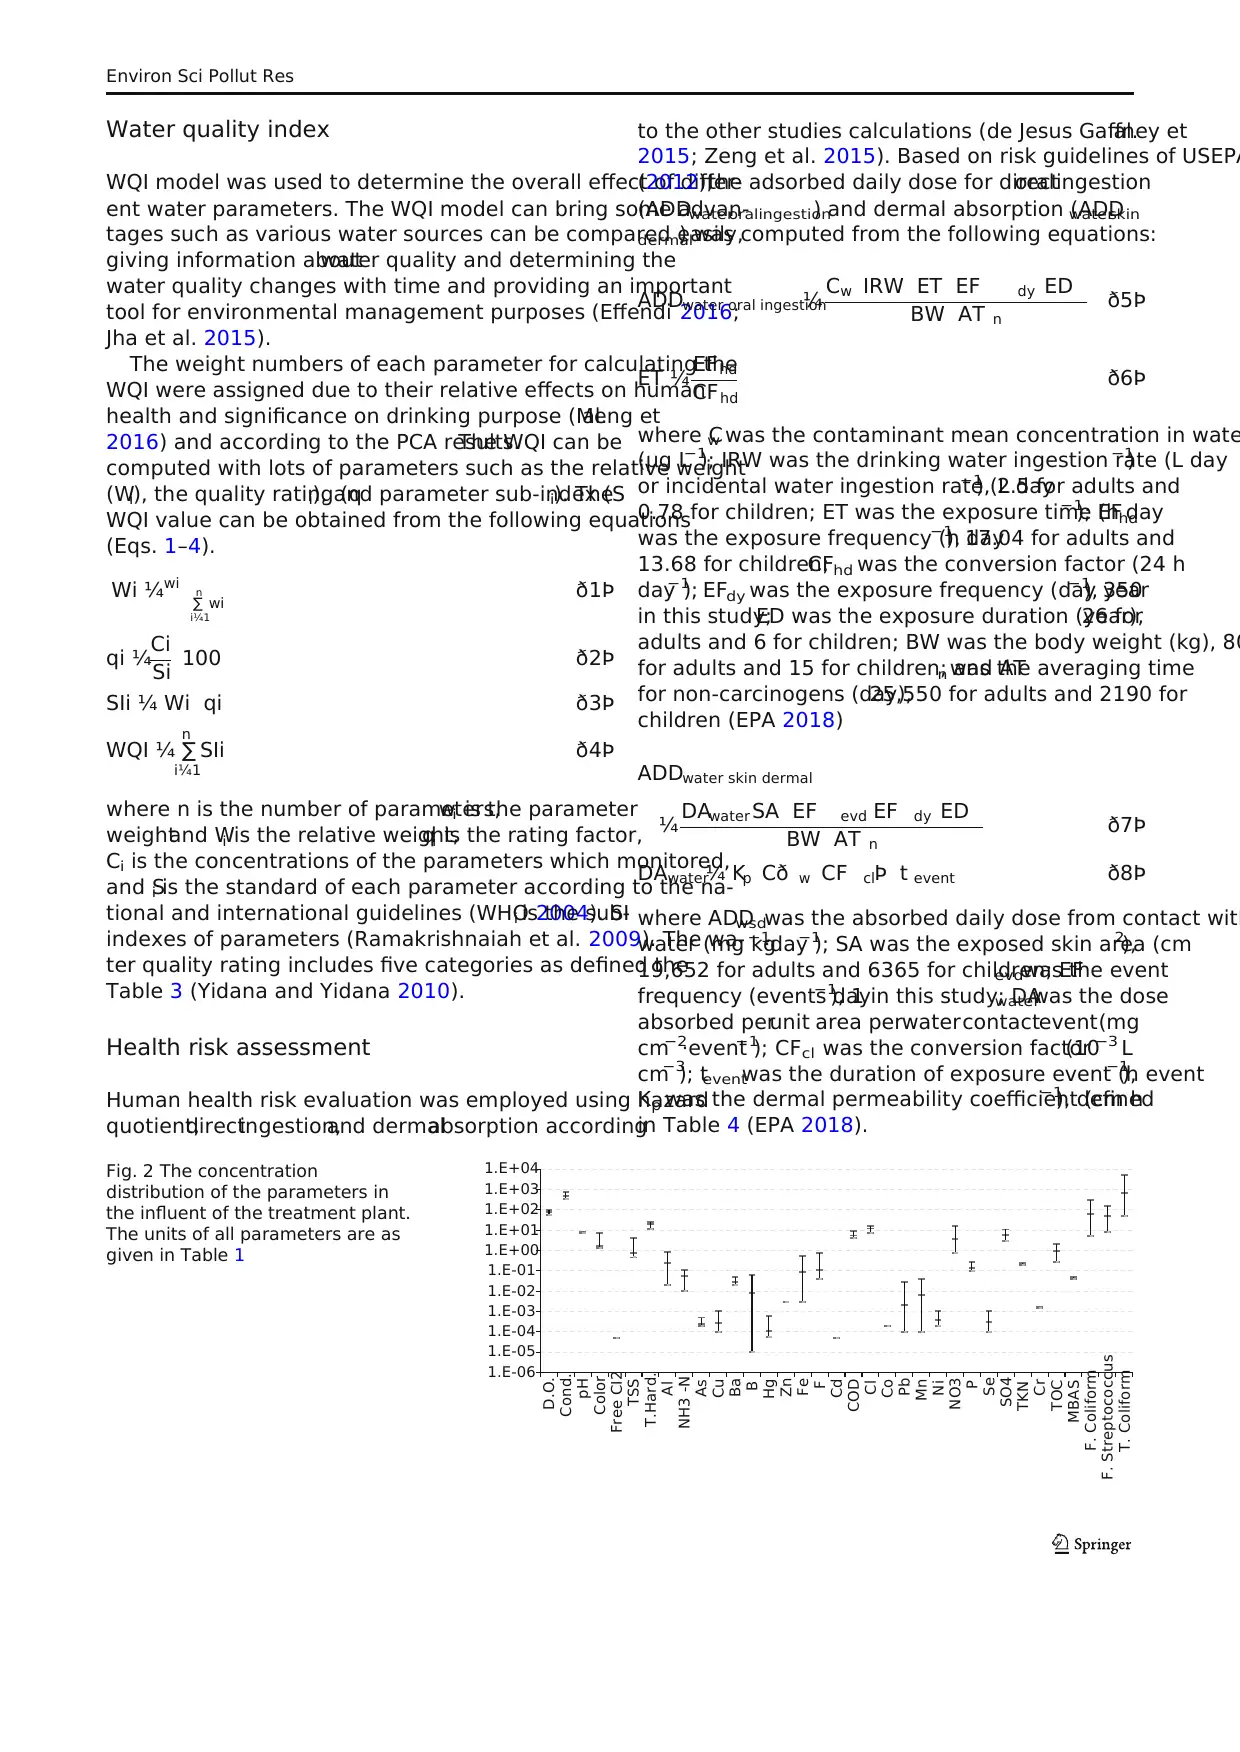
Although the parameters measured in the influent and effl
of the treatment plant are summarized in Tables 1 and 2,
this heading, the changes in the treated water are examin
The concentration changes of the parameters monitored i
inlet water are shown in Fig. 2.
Although the treatmentplantis fed by the surface and
groundwater,the water characterization is mainly based on
groundwater,so organic pollution is minimal.pH values
ranged between neutraland weak alkaline (6.96 to 7.95),
m a i n l y i n t h eg u i d ed i s c l o s e d i n t h eWHO and
Implementing Regulation on the Quality of Surface Water
Obtained or Planned, Turkey. The values of the dissolved i
decreased in the following order: Cl > SO4 > NO3 > Al > P > F
> Fe > Ba > B > Mn > Zn > Pb > Cr > Se > Ni > Cu > As
> Hg > Cd. Ions are classified into five categories accordin
their average concentration: (1) B, Mn, Zn, Pb, and Cr (< 1
L −1
); (2) Se, Ni, Cu, As, Co, Hg, and Cd (1–10 μg L−1
); (3) Fe
and Ba (10–100 μg L−1
); (4) Al, P, and F (100–1000 μg L−1
);
(5) Cl, NO3, and SO4 (> 1000 μg L−1
) (Table 1). All heavy
metals except Al complied with guidelines for drinking wat
1.E-06
1.E-05
1.E-04
1.E-03
1.E-02
1.E-01
1.E+00
1.E+01
1.E+02
1.E+03
Turb.
Cond.
pH
Color
Free CI2
T.Hard.
Al
NH4
As
Cu
B
Hg
Fe
F
Cd
Cl
Cr
Pb
Mn
Ni
NO3
NO2
Se
Na
SO4
*Clos. Per.
*Ente.
*E. coli
*T. Coliform
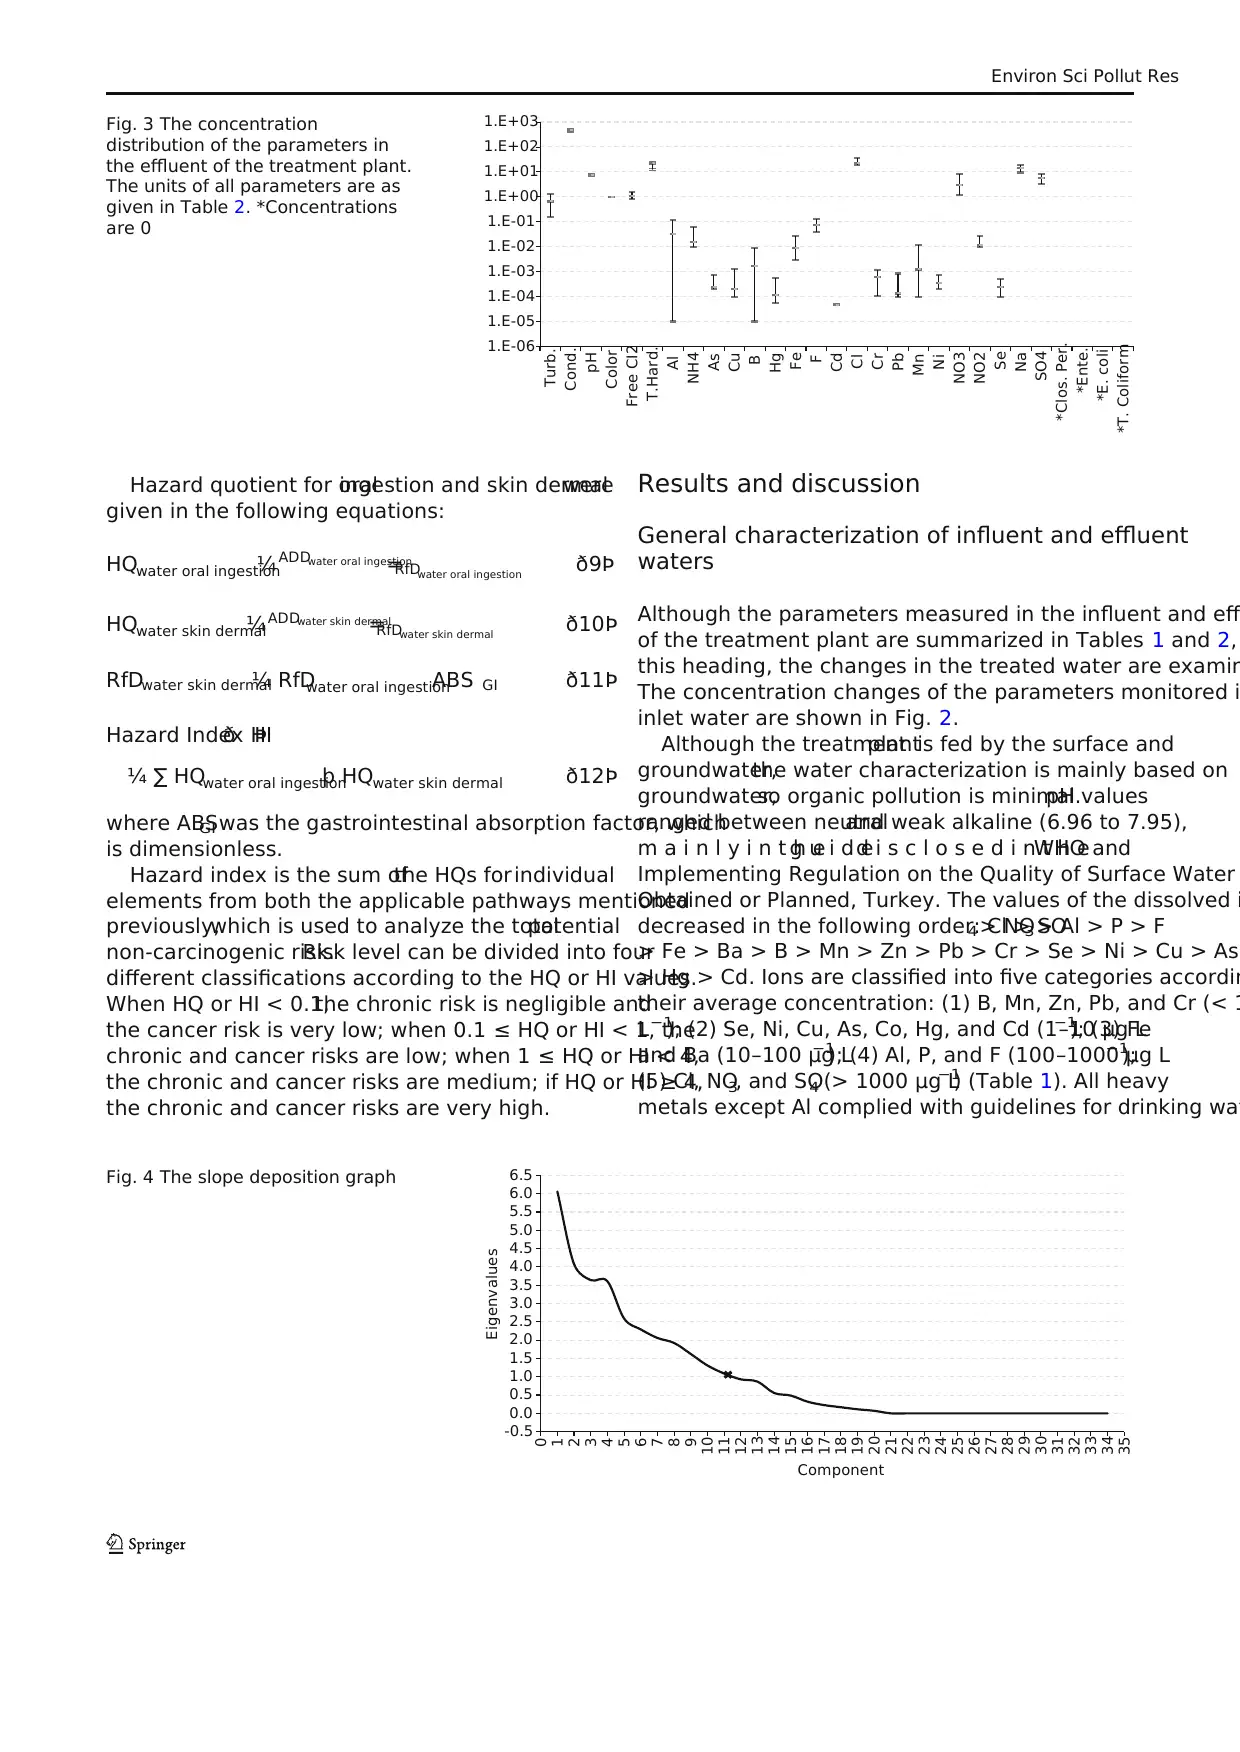
Fig. 3 The concentration
distribution of the parameters in
the effluent of the treatment plant.
The units of all parameters are as
given in Table 2. *Concentrations
are 0
-0.5
0.0
0.5
1.0
1.5
2.0
2.5
3.0
3.5
4.0
4.5
5.0
5.5
6.0
6.5
0
1
2
3
4
5
6
7
8
9
10
11
12
13
14
15
16
17
18
19
20
21
22
23
24
25
26
27
28
29
30
31
32
33
34
35
Eigenvalues
Component
Fig. 4 The slope deposition graph
Environ Sci Pollut Res
given in the following equations:
HQwater oral ingestion¼ADDwater oral ingestion
=RfDwater oral ingestion ð9Þ
HQwater skin dermal¼ADDwater skin dermal
=RfDwater skin dermal ð10Þ
RfDwater skin dermal¼ RfDwater oral ingestionABS GI ð11Þ
Hazard Index HIð Þ
¼ ∑ HQwater oral ingestionþ HQwater skin dermal ð12Þ
where ABSGI was the gastrointestinal absorption factor, which
is dimensionless.
Hazard index is the sum ofthe HQs for individual
elements from both the applicable pathways mentioned
previously,which is used to analyze the totalpotential
non-carcinogenic risk.Risk level can be divided into four
different classifications according to the HQ or HI values.
When HQ or HI < 0.1,the chronic risk is negligible and
the cancer risk is very low; when 0.1 ≤ HQ or HI < 1, the
chronic and cancer risks are low; when 1 ≤ HQ or HI < 4,
the chronic and cancer risks are medium; if HQ or HI ≥ 4,
the chronic and cancer risks are very high.
Results and discussion
General characterization of influent and effluent
waters
Although the parameters measured in the influent and effl
of the treatment plant are summarized in Tables 1 and 2,
this heading, the changes in the treated water are examin
The concentration changes of the parameters monitored i
inlet water are shown in Fig. 2.
Although the treatmentplantis fed by the surface and
groundwater,the water characterization is mainly based on
groundwater,so organic pollution is minimal.pH values
ranged between neutraland weak alkaline (6.96 to 7.95),
m a i n l y i n t h eg u i d ed i s c l o s e d i n t h eWHO and
Implementing Regulation on the Quality of Surface Water
Obtained or Planned, Turkey. The values of the dissolved i
decreased in the following order: Cl > SO4 > NO3 > Al > P > F
> Fe > Ba > B > Mn > Zn > Pb > Cr > Se > Ni > Cu > As
> Hg > Cd. Ions are classified into five categories accordin
their average concentration: (1) B, Mn, Zn, Pb, and Cr (< 1
L −1
); (2) Se, Ni, Cu, As, Co, Hg, and Cd (1–10 μg L−1
); (3) Fe
and Ba (10–100 μg L−1
); (4) Al, P, and F (100–1000 μg L−1
);
(5) Cl, NO3, and SO4 (> 1000 μg L−1
) (Table 1). All heavy
metals except Al complied with guidelines for drinking wat
1.E-06
1.E-05
1.E-04
1.E-03
1.E-02
1.E-01
1.E+00
1.E+01
1.E+02
1.E+03
Turb.
Cond.
pH
Color
Free CI2
T.Hard.
Al
NH4
As
Cu
B
Hg
Fe
F
Cd
Cl
Cr
Pb
Mn
Ni
NO3
NO2
Se
Na
SO4
*Clos. Per.
*Ente.
*E. coli
*T. Coliform
Fig. 3 The concentration
distribution of the parameters in
the effluent of the treatment plant.
The units of all parameters are as
given in Table 2. *Concentrations
are 0
-0.5
0.0
0.5
1.0
1.5
2.0
2.5
3.0
3.5
4.0
4.5
5.0
5.5
6.0
6.5
0
1
2
3
4
5
6
7
8
9
10
11
12
13
14
15
16
17
18
19
20
21
22
23
24
25
26
27
28
29
30
31
32
33
34
35
Eigenvalues
Component
Fig. 4 The slope deposition graph
Environ Sci Pollut Res
Paraphrase This Document
Need a fresh take? Get an instant paraphrase of this document with our AI Paraphraser
recommended by Turkey, the WHO, and the US EPA; Al was
not within the limits approved at different times and can be
affected by intense anthropogenic activities throughout
sources feeding the treatment plant. As, Cd, Hg, Ni, and Pb
identified as priority hazardous substance according to
REACH Annex XVII: REACH Restricted Substance List
2019 (ECHA 2019).Compared with recently published
works,the average concentration of Pb were slightly higher
than those from Aksu River (Şener et al. 2017); the average
concentrations of As and Ni were lower and Cd and Pb were
higher than wellwater in the Chinese Loess Plateau (Xiao
2019);the value of Niconcentration in Jiulongjiang River
was higher than us (Liang et al. 2018); the values of As, C
and Ni concentrations lower than those from the Dan Rive
(Meng et al. 2016). A general representation of the param
measured in the effluent of the treatment plant is given in
3.
According to the Fig.3, it is seen thatmicrobiological
parameters have completely disappeared after chlorine di
f e c t i o n a n d m e e tt h ed r i n k i n g w a t e rs t a n d a r d s .
Table 5 The factor pattern and factor load values of substances
Component 1 2 3 4 5 6 7 8 9 10 11
Cumulative % 17.82 29.81 40.51 51.13 58.75 65.50 71.56 77.21 81.98 85.83 89.03
Hg .921 .113 − .008 − .053 − .261 − .006 − .022 .109 − .014 − .074 − .031
Se .913 − .110 .033 .051 .164 − .098 − .093 − .180 − .077 .068 .062
Cu .900 − .065 − .058 .069 .263 − .047 − .065 − .167 − .051 .117 − .005
pH -.486 .056 − .074 .131 − .409 − .308 − .378 − .112 − .155 .166 .360
NH3-N − .111 .844 .373 − .080 .002 .082 .195 .120 − .006 − .056 − .088
Hard .018 − .804 − .088 -.088 − .072 .237 .097 .202 − .146 − .193 − .251
Al − .023 .751 .408 .090 .146 − .022 .299 − .111 − .083 − .201 − .168
TSS .051 − .553 .048 .159 − .347 .068 .143 .151 − .293 .277 .479
F − .173 − .327 .105 .148 − .269 − .136 − .219 − .168 − .007 − .125 − .312
NO3 .054 .056 .943 − .110 .116 − .025 .092 − .007 − .128 − .001 .002
Cr .031 .242 .911 .075 .157 − .057 .064 .072 − .052 .085 − .119
Fe .018 .509 .751 − .097 .210 − .129 − .070 − .147 .148 − .163 .045
Mn − .101 .153 − .095 .929 − .201 − .020 − .018 .006 − .042 − .142 .014
Ba .077 − .021 − .051 .863 .031 .103 − .271 − .012 .125 − .062 .053
TOC .040 − .147 − .042 .760 .427 .012 .143 − .171 − .135 .219 .005
P .008 .388 − .122 − .635 .159 .287 .315 .027 − .082 − .053 − .173
MBAS .050 .135 .208 .007 .944 − .112 .033 .068 .010 − .049 − .047
TKN .050 .135 .208 .007 .944 − .112 .033 .068 .010 − .049 − .047
Total Coliform − .100 .004 − .098 .152 − .071 .903 .007 .031 .161 .141 − .035
Fecal Streptococcus− .125 − .041 .021 − .017 − .059 .902 − .319 − .047 .049 − .162 .061
Cd .137 − .101 − .086 − .149 − .082 .808 .400 − .075 .086 − .020 − .037
Zn − .172 .019 .125 − .120 .093 − .044 .864 − .066 .174 − .037 .081
Ni .029 .478 − .148 − .235 − .044 − .090 .630 − .047 .331 .035 − .275
Color − .074 .323 .421 − .025 .056 .138 .624 − .011 − .362 .053 − .148
B − .192 .019 − .123 − .049 .285 .015 − .152 .854 .091 .094 .007
Co .583 .016 .218 − .109 − .138 − .054 − .211 .665 − .046 − .125 .028
DO − .141 − .248 − .014 .089 − .246 − .033 .238 .661 − .443 .215 .011
Pb − .147 − .325 .494 − .141 .192 − .191 .134 .531 .045 − .218 .008
COD − .132 .088 − .114 − .045 .046 .259 .156 − .116 .865 .215 − .072
Fecal Coliform − .113 .061 .000 .548 − .111 .178 .138 .179 .695 .220 − .028
As .167 − .024 − .108 .020 .018 − .027 .066 − .007 .315 .768 − .072
Cl − .234 − .172 .362 − .420 − .220 .062 − .128 .185 − .120 .622 .006
SO4 − .429 .214 − .093 .207 − .455 − .117 − .239 .055 .099 .489 .097
Conductivity − .024 − .028 − .076 .080 − .070 − .027 − .078 − .011 − .029 − .091 .878
Extraction method: principal component analysis
Rotation method: varimax with Kaiser normalization
Environ Sci Pollut Res
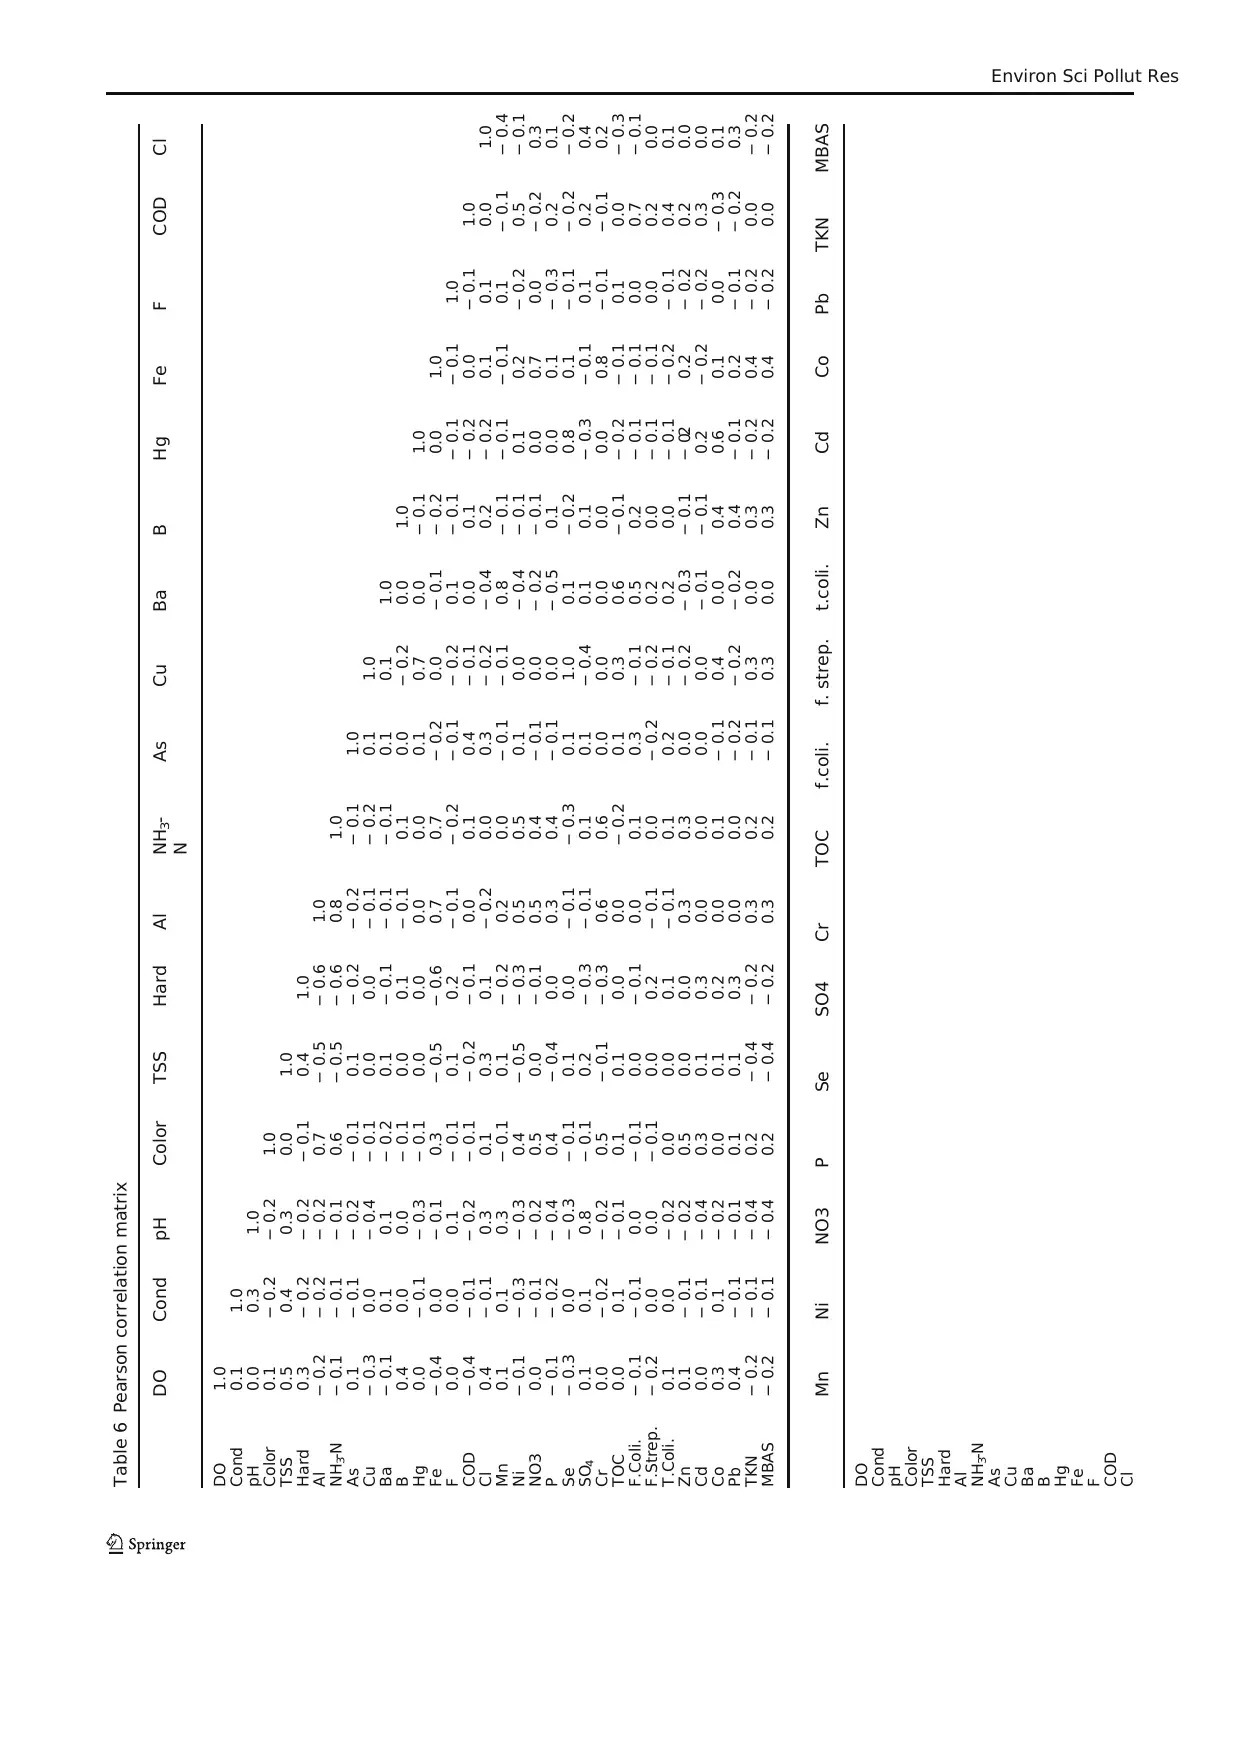
Table 6 Pearson correlation matrix
DO Cond pH Color TSS Hard Al NH3-
N
As Cu Ba B Hg Fe F COD Cl
DO 1.0
Cond 0.1 1.0
pH 0.0 0.3 1.0
Color 0.1 − 0.2 − 0.2 1.0
TSS 0.5 0.4 0.3 0.0 1.0
Hard 0.3 − 0.2 − 0.2 − 0.1 0.4 1.0
Al − 0.2 − 0.2 − 0.2 0.7 − 0.5 − 0.6 1.0
NH3-N − 0.1 − 0.1 − 0.1 0.6 − 0.5 − 0.6 0.8 1.0
As 0.1 − 0.1 − 0.2 − 0.1 0.1 − 0.2 − 0.2 − 0.1 1.0
Cu − 0.3 0.0 − 0.4 − 0.1 0.0 0.0 − 0.1 − 0.2 0.1 1.0
Ba − 0.1 0.1 0.1 − 0.2 0.1 − 0.1 − 0.1 − 0.1 0.1 0.1 1.0
B 0.4 0.0 0.0 − 0.1 0.0 0.1 − 0.1 0.1 0.0 − 0.2 0.0 1.0
Hg 0.0 − 0.1 − 0.3 − 0.1 0.0 0.0 0.0 0.0 0.1 0.7 0.0 − 0.1 1.0
Fe − 0.4 0.0 − 0.1 0.3 − 0.5 − 0.6 0.7 0.7 − 0.2 0.0 − 0.1 − 0.2 0.0 1.0
F 0.0 0.0 0.1 − 0.1 0.1 0.2 − 0.1 − 0.2 − 0.1 − 0.2 0.1 − 0.1 − 0.1 − 0.1 1.0
COD − 0.4 − 0.1 − 0.2 − 0.1 − 0.2 − 0.1 0.0 0.1 0.4 − 0.1 0.0 0.1 − 0.2 0.0 − 0.1 1.0
Cl 0.4 − 0.1 0.3 0.1 0.3 0.1 − 0.2 0.0 0.3 − 0.2 − 0.4 0.2 − 0.2 0.1 0.1 0.0 1.0
Mn 0.1 0.1 0.3 − 0.1 0.1 − 0.2 0.2 0.0 − 0.1 − 0.1 0.8 − 0.1 − 0.1 − 0.1 0.1 − 0.1 − 0.4
Ni − 0.1 − 0.3 − 0.3 0.4 − 0.5 − 0.3 0.5 0.5 0.1 0.0 − 0.4 − 0.1 0.1 0.2 − 0.2 0.5 − 0.1
NO3 0.0 − 0.1 − 0.2 0.5 0.0 − 0.1 0.5 0.4 − 0.1 0.0 − 0.2 − 0.1 0.0 0.7 0.0 − 0.2 0.3
P − 0.1 − 0.2 − 0.4 0.4 − 0.4 0.0 0.3 0.4 − 0.1 0.0 − 0.5 0.1 0.0 0.1 − 0.3 0.2 0.1
Se − 0.3 0.0 − 0.3 − 0.1 0.1 0.0 − 0.1 − 0.3 0.1 1.0 0.1 − 0.2 0.8 0.1 − 0.1 − 0.2 − 0.2
SO4 0.1 0.1 0.8 − 0.1 0.2 − 0.3 − 0.1 0.1 0.1 − 0.4 0.1 0.1 − 0.3 − 0.1 0.1 0.2 0.4
Cr 0.0 − 0.2 − 0.2 0.5 − 0.1 − 0.3 0.6 0.6 0.0 0.0 0.0 0.0 0.0 0.8 − 0.1 − 0.1 0.2
TOC 0.0 0.1 − 0.1 0.1 0.1 0.0 0.0 − 0.2 0.1 0.3 0.6 − 0.1 − 0.2 − 0.1 0.1 0.0 − 0.3
F.Coli. − 0.1 − 0.1 0.0 − 0.1 0.0 − 0.1 0.0 0.1 0.3 − 0.1 0.5 0.2 − 0.1 − 0.1 0.0 0.7 − 0.1
F.Strep. − 0.2 0.0 0.0 − 0.1 0.0 0.2 − 0.1 0.0 − 0.2 − 0.2 0.2 0.0 − 0.1 − 0.1 0.0 0.2 0.0
T.Coli. 0.1 0.0 − 0.2 0.0 0.0 0.1 − 0.1 0.1 0.2 − 0.1 0.2 0.0 − 0.1 − 0.2 − 0.1 0.4 0.1
Zn 0.1 − 0.1 − 0.2 0.5 0.0 0.0 0.3 0.3 0.0 − 0.2 − 0.3 − 0.1 − 0.2 0.2 − 0.2 0.2 0.0
Cd 0.0 − 0.1 − 0.4 0.3 0.1 0.3 0.0 0.0 0.0 0.0 − 0.1 − 0.1 0.2 − 0.2 − 0.2 0.3 0.0
Co 0.3 0.1 − 0.2 0.0 0.1 0.2 0.0 0.1 − 0.1 0.4 0.0 0.4 0.6 0.1 0.0 − 0.3 0.1
Pb 0.4 − 0.1 − 0.1 0.1 0.1 0.3 0.0 0.0 − 0.2 − 0.2 − 0.2 0.4 − 0.1 0.2 − 0.1 − 0.2 0.3
TKN − 0.2 − 0.1 − 0.4 0.2 − 0.4 − 0.2 0.3 0.2 − 0.1 0.3 0.0 0.3 − 0.2 0.4 − 0.2 0.0 − 0.2
MBAS − 0.2 − 0.1 − 0.4 0.2 − 0.4 − 0.2 0.3 0.2 − 0.1 0.3 0.0 0.3 − 0.2 0.4 − 0.2 0.0 − 0.2
Mn Ni NO3 P Se SO4 Cr TOC f.coli. f. strep. t.coli. Zn Cd Co Pb TKN MBAS
DO
Cond
pH
Color
TSS
Hard
Al
NH3-N
As
Cu
Ba
B
Hg
Fe
F
COD
Cl
Environ Sci Pollut Res
⊘ This is a preview!⊘
Do you want full access?
Subscribe today to unlock all pages.
Trusted by 1+ million students worldwide
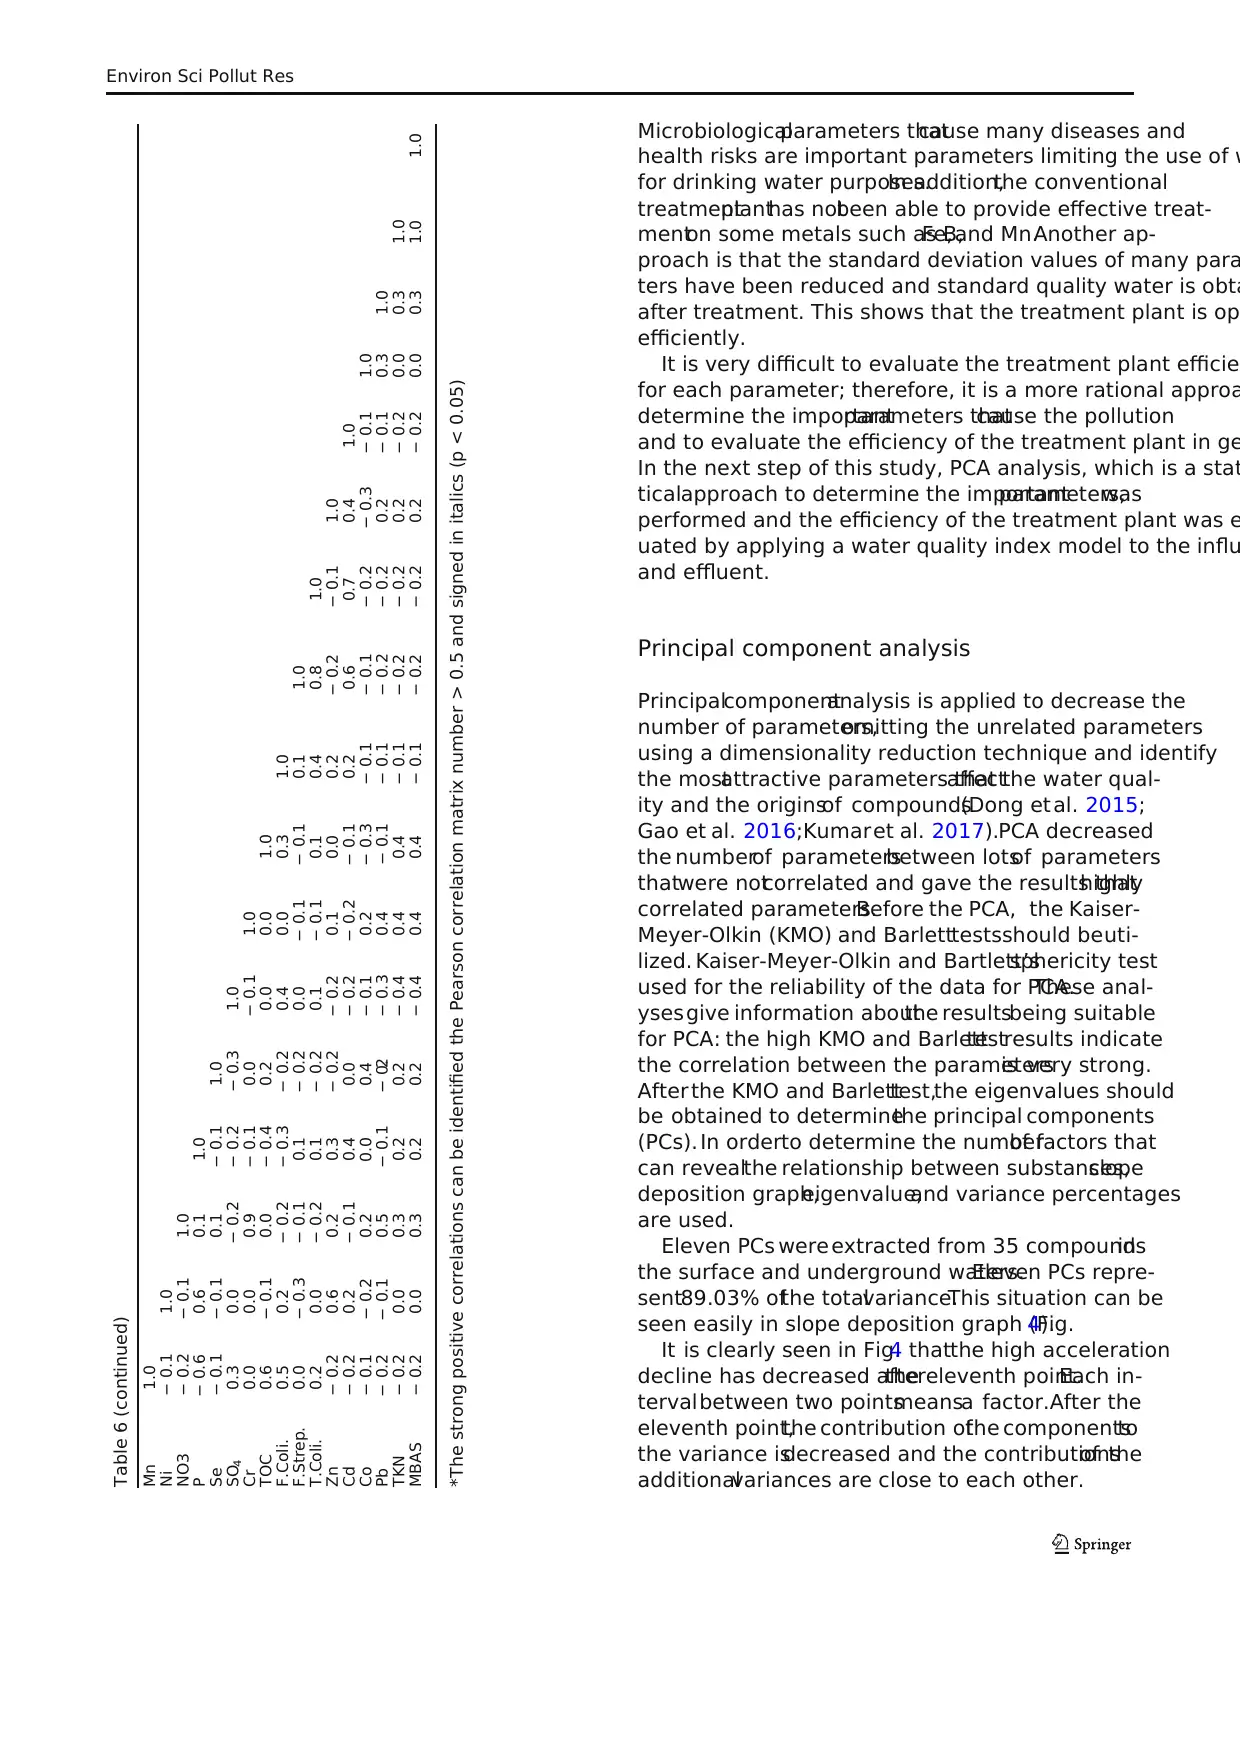
Microbiologicalparameters thatcause many diseases and
health risks are important parameters limiting the use of w
for drinking water purposes.In addition,the conventional
treatmentplanthas notbeen able to provide effective treat-
menton some metals such as B,Fe,and Mn.Another ap-
proach is that the standard deviation values of many para
ters have been reduced and standard quality water is obta
after treatment. This shows that the treatment plant is op
efficiently.
It is very difficult to evaluate the treatment plant efficie
for each parameter; therefore, it is a more rational approa
determine the importantparameters thatcause the pollution
and to evaluate the efficiency of the treatment plant in ge
In the next step of this study, PCA analysis, which is a stat
ticalapproach to determine the importantparameters,was
performed and the efficiency of the treatment plant was e
uated by applying a water quality index model to the influ
and effluent.
Principal component analysis
Principalcomponentanalysis is applied to decrease the
number of parameters,omitting the unrelated parameters
using a dimensionality reduction technique and identify
the mostattractive parameters thataffectthe water qual-
ity and the originsof compounds(Dong et al. 2015;
Gao et al. 2016;Kumaret al. 2017).PCA decreased
the numberof parametersbetween lotsof parameters
thatwere notcorrelated and gave the results thathighly
correlated parameters.Before the PCA, the Kaiser-
Meyer-Olkin (KMO) and Barletttestsshould beuti-
lized. Kaiser-Meyer-Olkin and Bartlett’ssphericity test
used for the reliability of the data for PCA.These anal-
ysesgive information aboutthe resultsbeing suitable
for PCA: the high KMO and Barletttestresults indicate
the correlation between the parametersis very strong.
After the KMO and Barletttest,the eigenvalues should
be obtained to determinethe principal components
(PCs). In orderto determine the numberof factors that
can revealthe relationship between substances,slope
deposition graph,eigenvalue,and variance percentages
are used.
Eleven PCs were extracted from 35 compoundsin
the surface and underground waters.Eleven PCs repre-
sent89.03% ofthe totalvariance.This situation can be
seen easily in slope deposition graph (Fig.4).
It is clearly seen in Fig.4 thatthe high acceleration
decline has decreased afterthe eleventh point.Each in-
tervalbetween two pointsmeansa factor.After the
eleventh point,the contribution ofthe componentsto
the variance isdecreased and the contributionsof the
additionalvariances are close to each other.
Table 6 (continued)
Mn 1.0
Ni − 0.1 1.0
NO3 − 0.2 − 0.1 1.0
P − 0.6 0.6 0.1 1.0
Se − 0.1 − 0.1 0.1 − 0.1 1.0
SO4 0.3 0.0 − 0.2 − 0.2 − 0.3 1.0
Cr 0.0 0.0 0.9 − 0.1 0.0 − 0.1 1.0
TOC 0.6 − 0.1 0.0 − 0.4 0.2 0.0 0.0 1.0
F.Coli. 0.5 0.2 − 0.2 − 0.3 − 0.2 0.4 0.0 0.3 1.0
F.Strep. 0.0 − 0.3 − 0.1 0.1 − 0.2 0.0 − 0.1 − 0.1 0.1 1.0
T.Coli. 0.2 0.0 − 0.2 0.1 − 0.2 0.1 − 0.1 0.1 0.4 0.8 1.0
Zn − 0.2 0.6 0.2 0.3 − 0.2 − 0.2 0.1 0.0 0.2 − 0.2 − 0.1 1.0
Cd − 0.2 0.2 − 0.1 0.4 0.0 − 0.2 − 0.2 − 0.1 0.2 0.6 0.7 0.4 1.0
Co − 0.1 − 0.2 0.2 0.0 0.4 − 0.1 0.2 − 0.3 − 0.1 − 0.1 − 0.2 − 0.3 − 0.1 1.0
Pb − 0.2 − 0.1 0.5 − 0.1 − 0.2 − 0.3 0.4 − 0.1 − 0.1 − 0.2 − 0.2 0.2 − 0.1 0.3 1.0
TKN − 0.2 0.0 0.3 0.2 0.2 − 0.4 0.4 0.4 − 0.1 − 0.2 − 0.2 0.2 − 0.2 0.0 0.3 1.0
MBAS − 0.2 0.0 0.3 0.2 0.2 − 0.4 0.4 0.4 − 0.1 − 0.2 − 0.2 0.2 − 0.2 0.0 0.3 1.0 1.0
*The strong positive correlations can be identified the Pearson correlation matrix number > 0.5 and signed in italics (p < 0.05)
Environ Sci Pollut Res
Paraphrase This Document
Need a fresh take? Get an instant paraphrase of this document with our AI Paraphraser
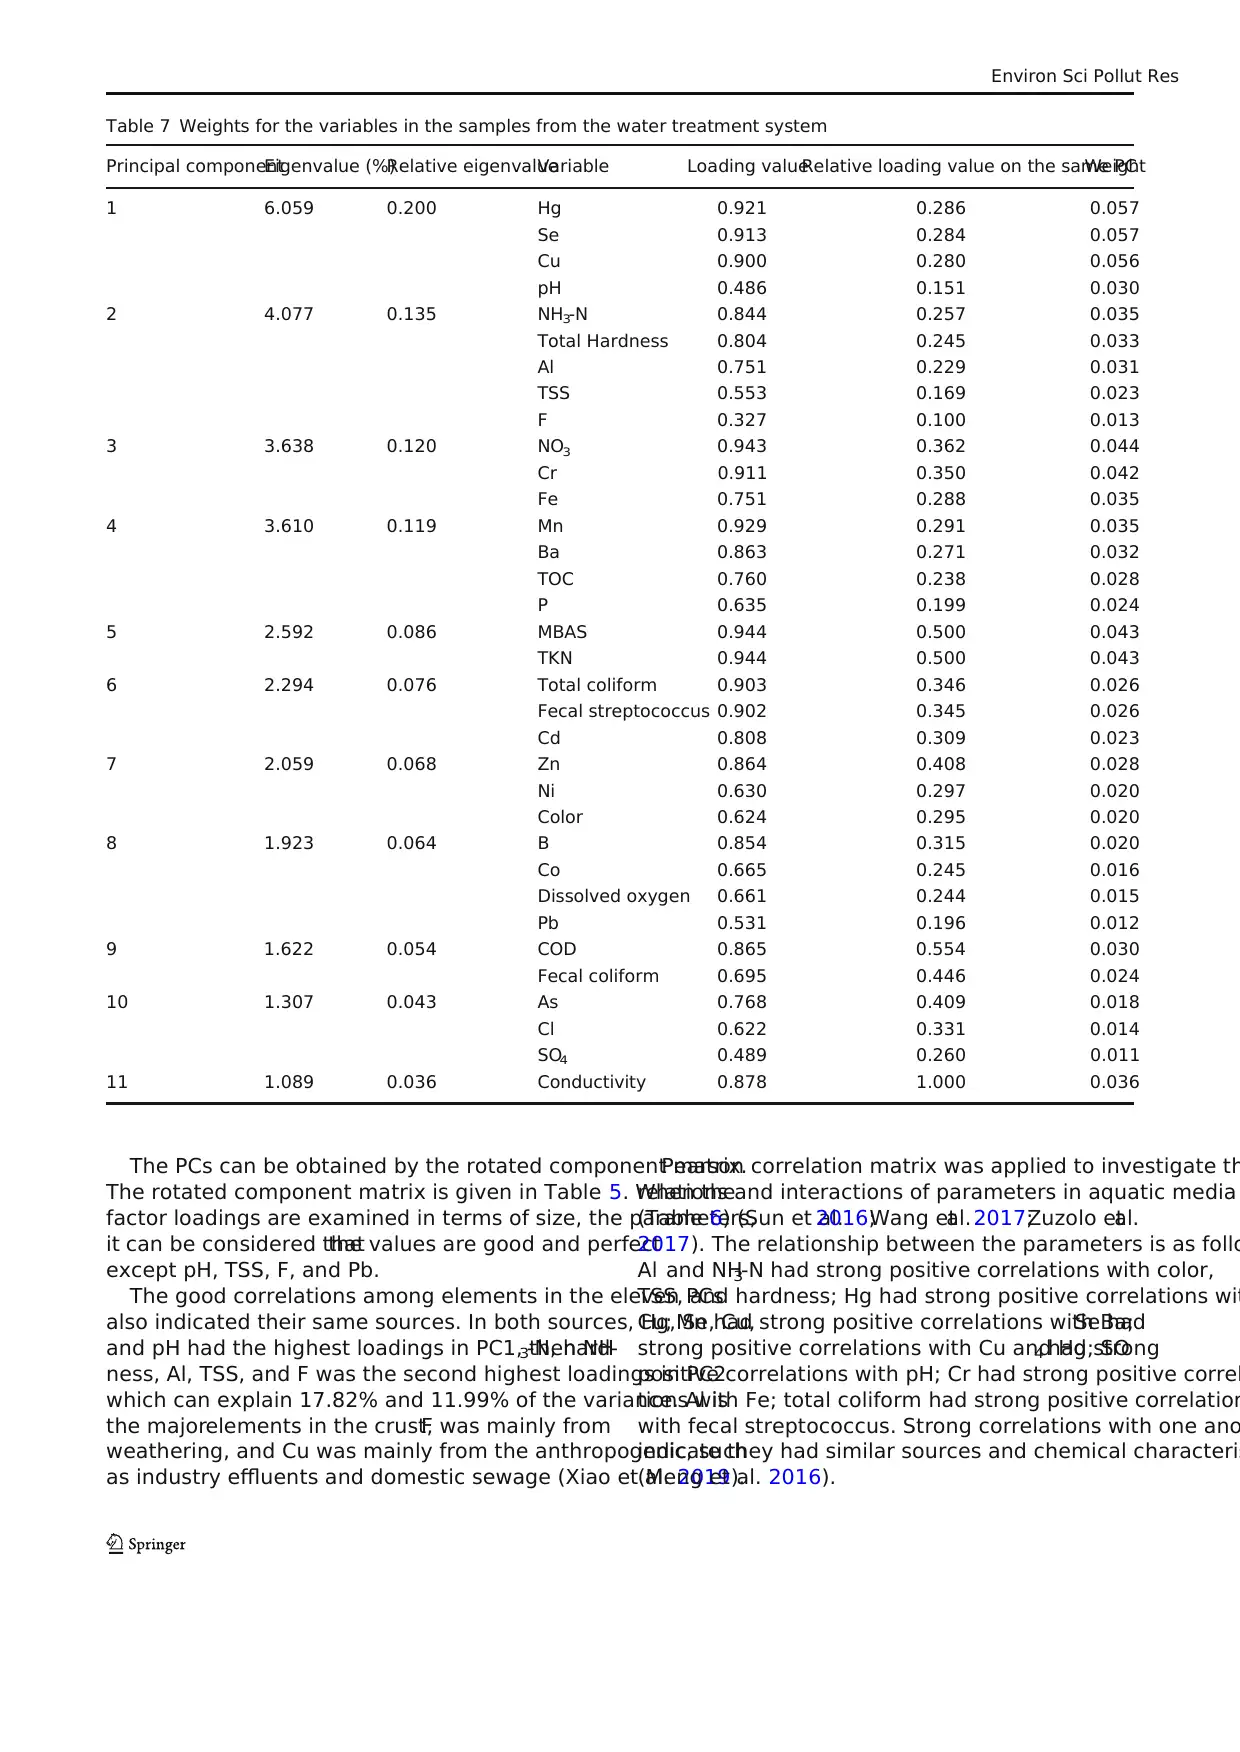
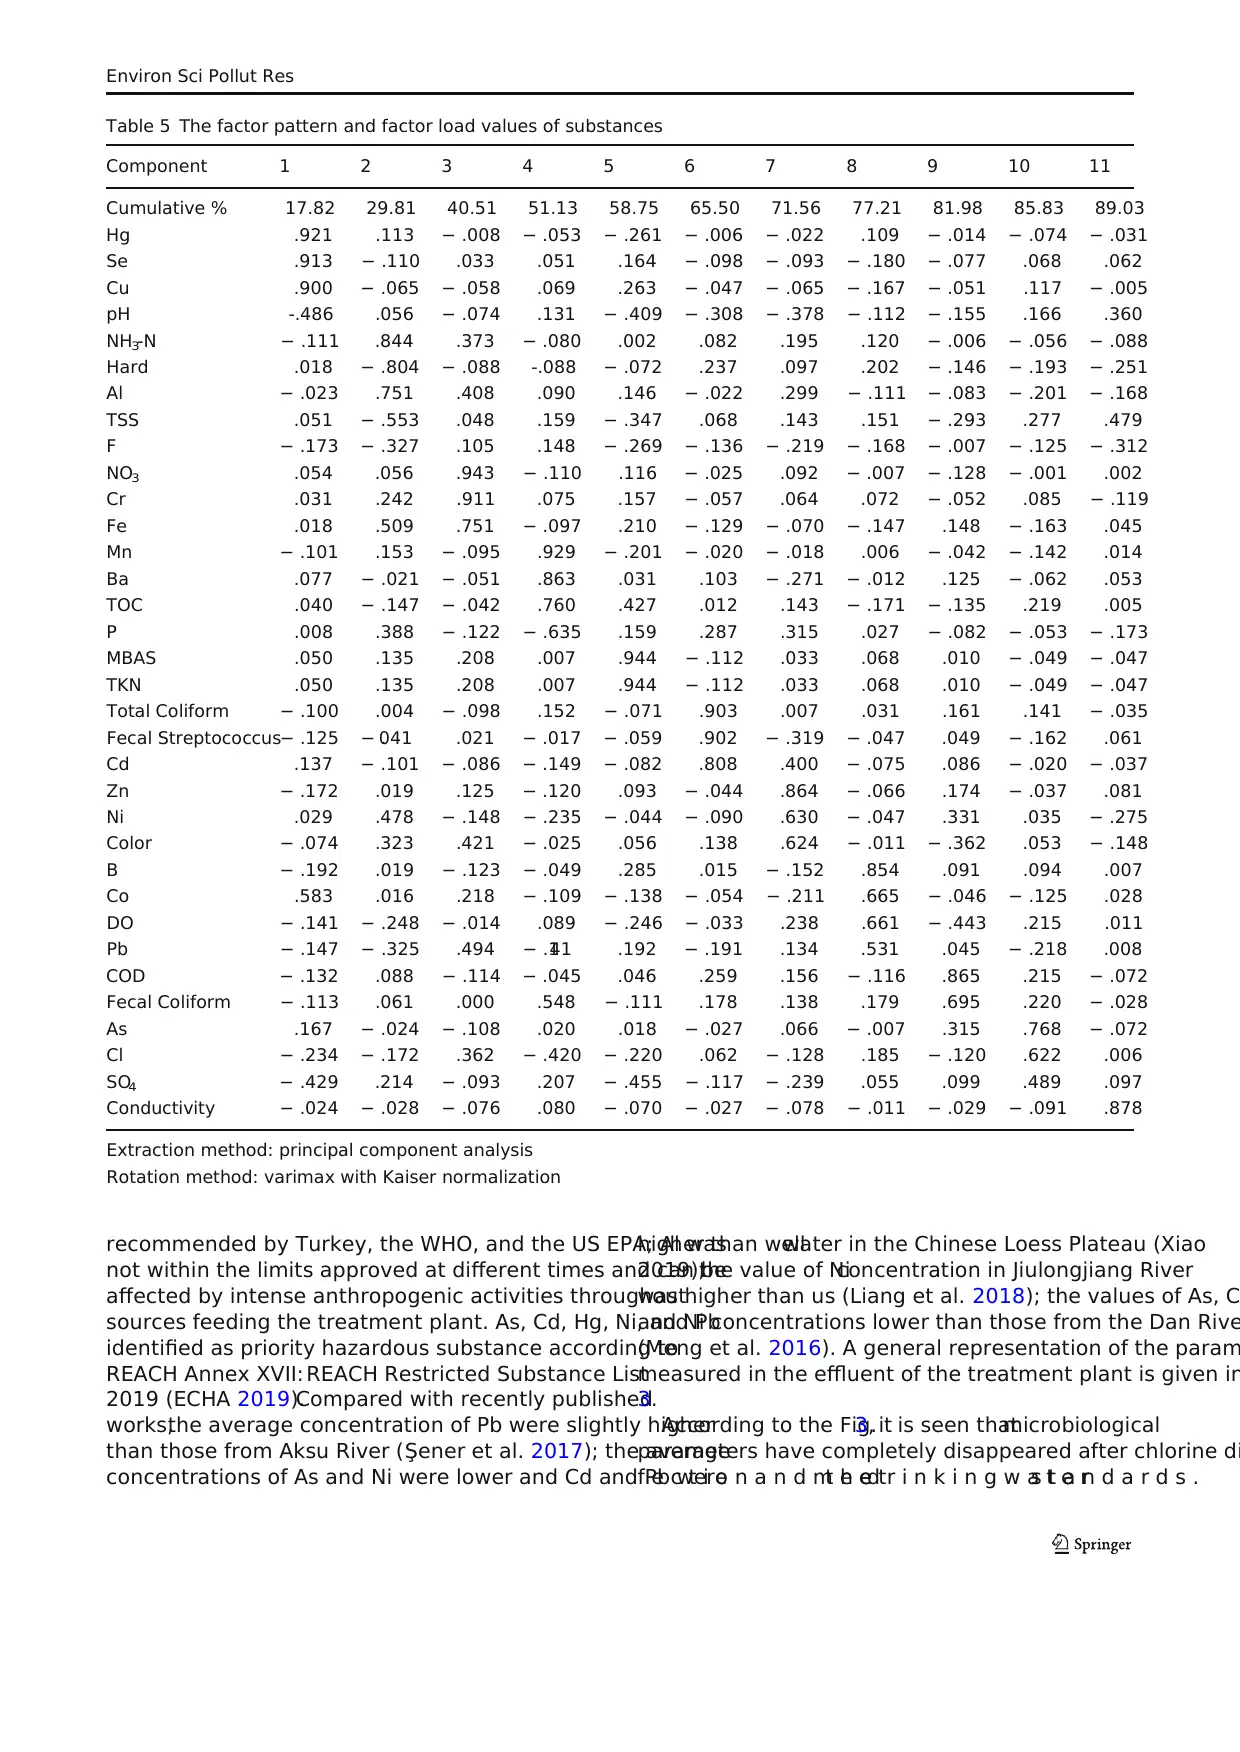
The PCs can be obtained by the rotated component matrix.
The rotated component matrix is given in Table 5. When the
factor loadings are examined in terms of size, the parameters,
it can be considered thatthe values are good and perfect
except pH, TSS, F, and Pb.
The good correlations among elements in the eleven PCs
also indicated their same sources. In both sources, Hg, Se, Cu,
and pH had the highest loadings in PC1, then NH3-N, hard-
ness, Al, TSS, and F was the second highest loadings in PC2
which can explain 17.82% and 11.99% of the variance. Al is
the majorelements in the crust,F was mainly from
weathering, and Cu was mainly from the anthropogenic, such
as industry effluents and domestic sewage (Xiao et al. 2019).
Pearson correlation matrix was applied to investigate th
relations and interactions of parameters in aquatic media
(Table 6) (Sun et al.2016;Wang etal. 2017;Zuzolo etal.
2017). The relationship between the parameters is as follo
Al and NH3-N had strong positive correlations with color,
TSS, and hardness; Hg had strong positive correlations wit
Cu; Mn had strong positive correlations with Ba;Se had
strong positive correlations with Cu and Hg; SO4 had strong
positive correlations with pH; Cr had strong positive correl
tions with Fe; total coliform had strong positive correlation
with fecal streptococcus. Strong correlations with one ano
indicate they had similar sources and chemical characteris
(Meng et al. 2016).
Table 7 Weights for the variables in the samples from the water treatment system
Principal componentEigenvalue (%)Relative eigenvalueVariable Loading valueRelative loading value on the same PCWeight
1 6.059 0.200 Hg 0.921 0.286 0.057
Se 0.913 0.284 0.057
Cu 0.900 0.280 0.056
pH 0.486 0.151 0.030
2 4.077 0.135 NH3-N 0.844 0.257 0.035
Total Hardness 0.804 0.245 0.033
Al 0.751 0.229 0.031
TSS 0.553 0.169 0.023
F 0.327 0.100 0.013
3 3.638 0.120 NO3 0.943 0.362 0.044
Cr 0.911 0.350 0.042
Fe 0.751 0.288 0.035
4 3.610 0.119 Mn 0.929 0.291 0.035
Ba 0.863 0.271 0.032
TOC 0.760 0.238 0.028
P 0.635 0.199 0.024
5 2.592 0.086 MBAS 0.944 0.500 0.043
TKN 0.944 0.500 0.043
6 2.294 0.076 Total coliform 0.903 0.346 0.026
Fecal streptococcus 0.902 0.345 0.026
Cd 0.808 0.309 0.023
7 2.059 0.068 Zn 0.864 0.408 0.028
Ni 0.630 0.297 0.020
Color 0.624 0.295 0.020
8 1.923 0.064 B 0.854 0.315 0.020
Co 0.665 0.245 0.016
Dissolved oxygen 0.661 0.244 0.015
Pb 0.531 0.196 0.012
9 1.622 0.054 COD 0.865 0.554 0.030
Fecal coliform 0.695 0.446 0.024
10 1.307 0.043 As 0.768 0.409 0.018
Cl 0.622 0.331 0.014
SO4 0.489 0.260 0.011
11 1.089 0.036 Conductivity 0.878 1.000 0.036
Environ Sci Pollut Res
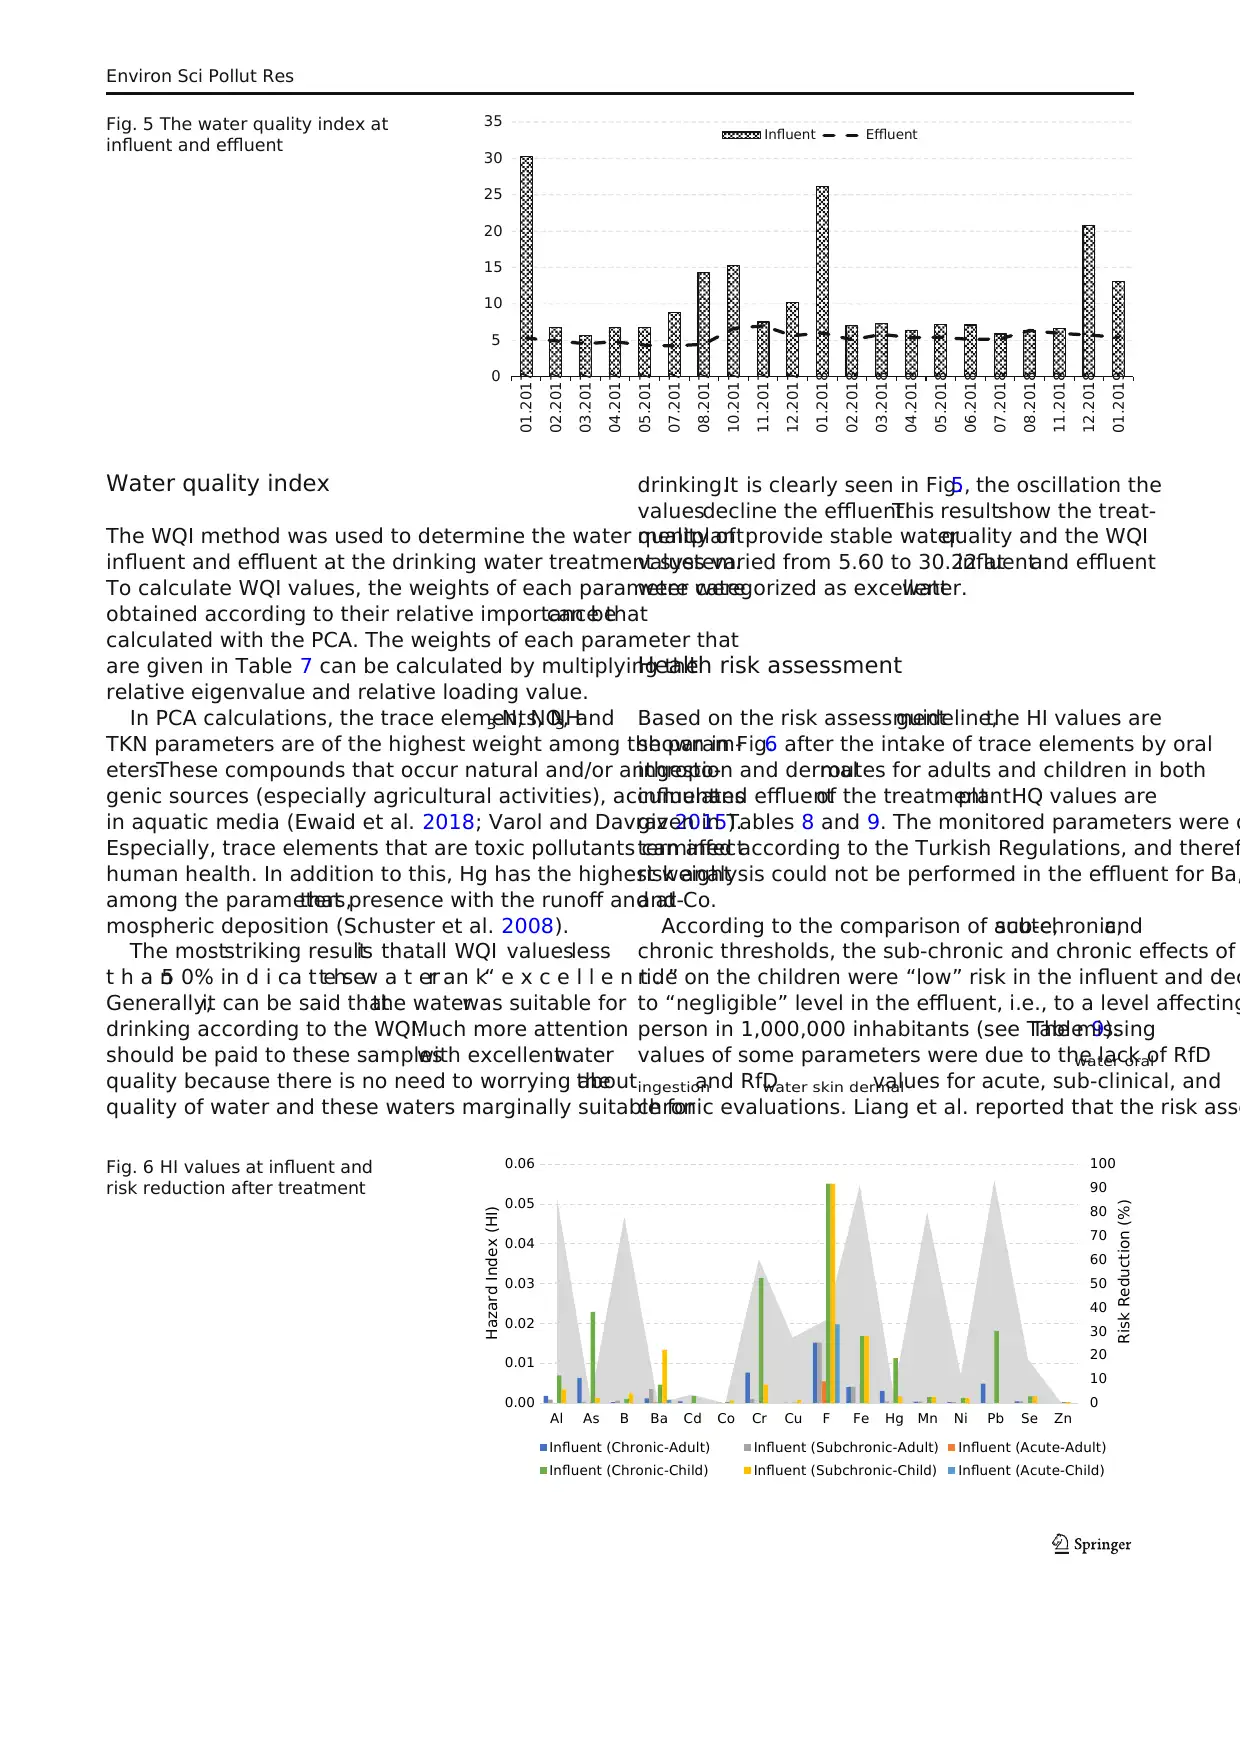
Water quality index
The WQI method was used to determine the water quality of
influent and effluent at the drinking water treatment system.
To calculate WQI values, the weights of each parameter were
obtained according to their relative importance thatcan be
calculated with the PCA. The weights of each parameter that
are given in Table 7 can be calculated by multiplying the
relative eigenvalue and relative loading value.
In PCA calculations, the trace elements, NH3-N, NO3, and
TKN parameters are of the highest weight among the param-
eters.These compounds that occur natural and/or anthropo-
genic sources (especially agricultural activities), accumulates
in aquatic media (Ewaid et al. 2018; Varol and Davraz 2015).
Especially, trace elements that are toxic pollutants can affect
human health. In addition to this, Hg has the highest weight
among the parameters,that presence with the runoff and at-
mospheric deposition (Schuster et al. 2008).
The moststriking resultis thatall WQI valuesless
t h a n5 0% in d i ca t e st h ew a t err an k“ e x c e l l e n t . ”
Generally,it can be said thatthe waterwas suitable for
drinking according to the WQI.Much more attention
should be paid to these sampleswith excellentwater
quality because there is no need to worrying aboutthe
quality of water and these waters marginally suitable for
drinking.It is clearly seen in Fig.5, the oscillation the
valuesdecline the effluent.This resultshow the treat-
mentplantprovide stable waterquality and the WQI
values varied from 5.60 to 30.22 atinfluentand effluent
were categorized as excellentwater.
Health risk assessment
Based on the risk assessmentguideline,the HI values are
shown in Fig.6 after the intake of trace elements by oral
ingestion and dermalroutes for adults and children in both
influentand effluentof the treatmentplant.HQ values are
given in Tables 8 and 9. The monitored parameters were d
termined according to the Turkish Regulations, and theref
risk analysis could not be performed in the effluent for Ba,
and Co.
According to the comparison of acute,sub-chronic,and
chronic thresholds, the sub-chronic and chronic effects of
ride on the children were “low” risk in the influent and dec
to “negligible” level in the effluent, i.e., to a level affecting
person in 1,000,000 inhabitants (see Table 9).The missing
values of some parameters were due to the lack of RfDwater oral
ingestionand RfDwater skin dermalvalues for acute, sub-clinical, and
chronic evaluations. Liang et al. reported that the risk asse
0
10
20
30
40
50
60
70
80
90
100
0.00
0.01
0.02
0.03
0.04
0.05
0.06
Al As B Ba Cd Co Cr Cu F Fe Hg Mn Ni Pb Se Zn
Risk Reduction (%)
Hazard Index (HI)
Influent (Chronic-Adult) Influent (Subchronic-Adult) Influent (Acute-Adult)
Influent (Chronic-Child) Influent (Subchronic-Child) Influent (Acute-Child)
Fig. 6 HI values at influent and
risk reduction after treatment
0
5
10
15
20
25
30
35
01.2017
02.2017
03.2017
04.2017
05.2017
07.2017
08.2017
10.2017
11.2017
12.2017
01.2018
02.2018
03.2018
04.2018
05.2018
06.2018
07.2018
08.2018
11.2018
12.2018
01.2019
Influent Effluent
Fig. 5 The water quality index at
influent and effluent
Environ Sci Pollut Res
⊘ This is a preview!⊘
Do you want full access?
Subscribe today to unlock all pages.
Trusted by 1+ million students worldwide
1 out of 15

Your All-in-One AI-Powered Toolkit for Academic Success.
+13062052269
info@desklib.com
Available 24*7 on WhatsApp / Email
![[object Object]](/_next/static/media/star-bottom.7253800d.svg)
Unlock your academic potential
Copyright © 2020–2026 A2Z Services. All Rights Reserved. Developed and managed by ZUCOL.