Genetics Assignment: Drosophila Cross Analysis and Gene Mapping
VerifiedAdded on 2023/04/10
|7
|838
|354
Homework Assignment
AI Summary
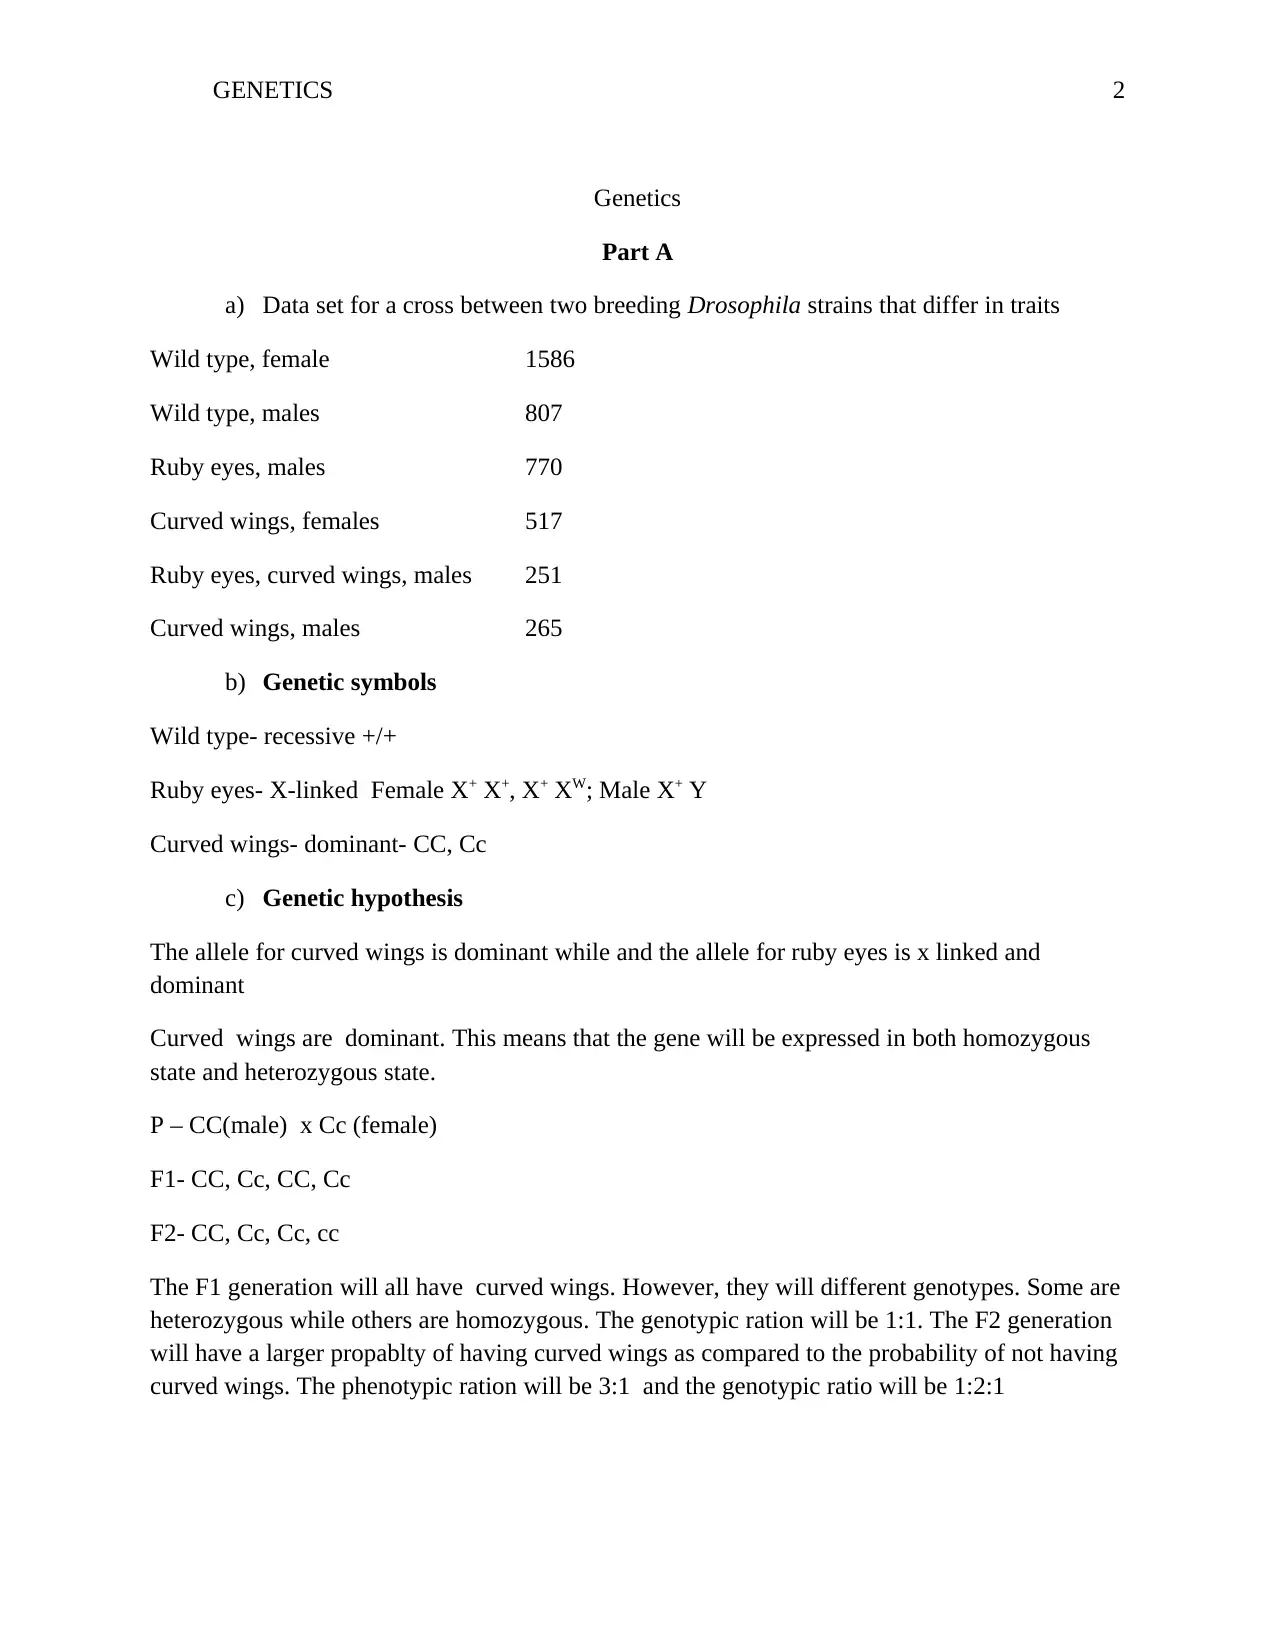
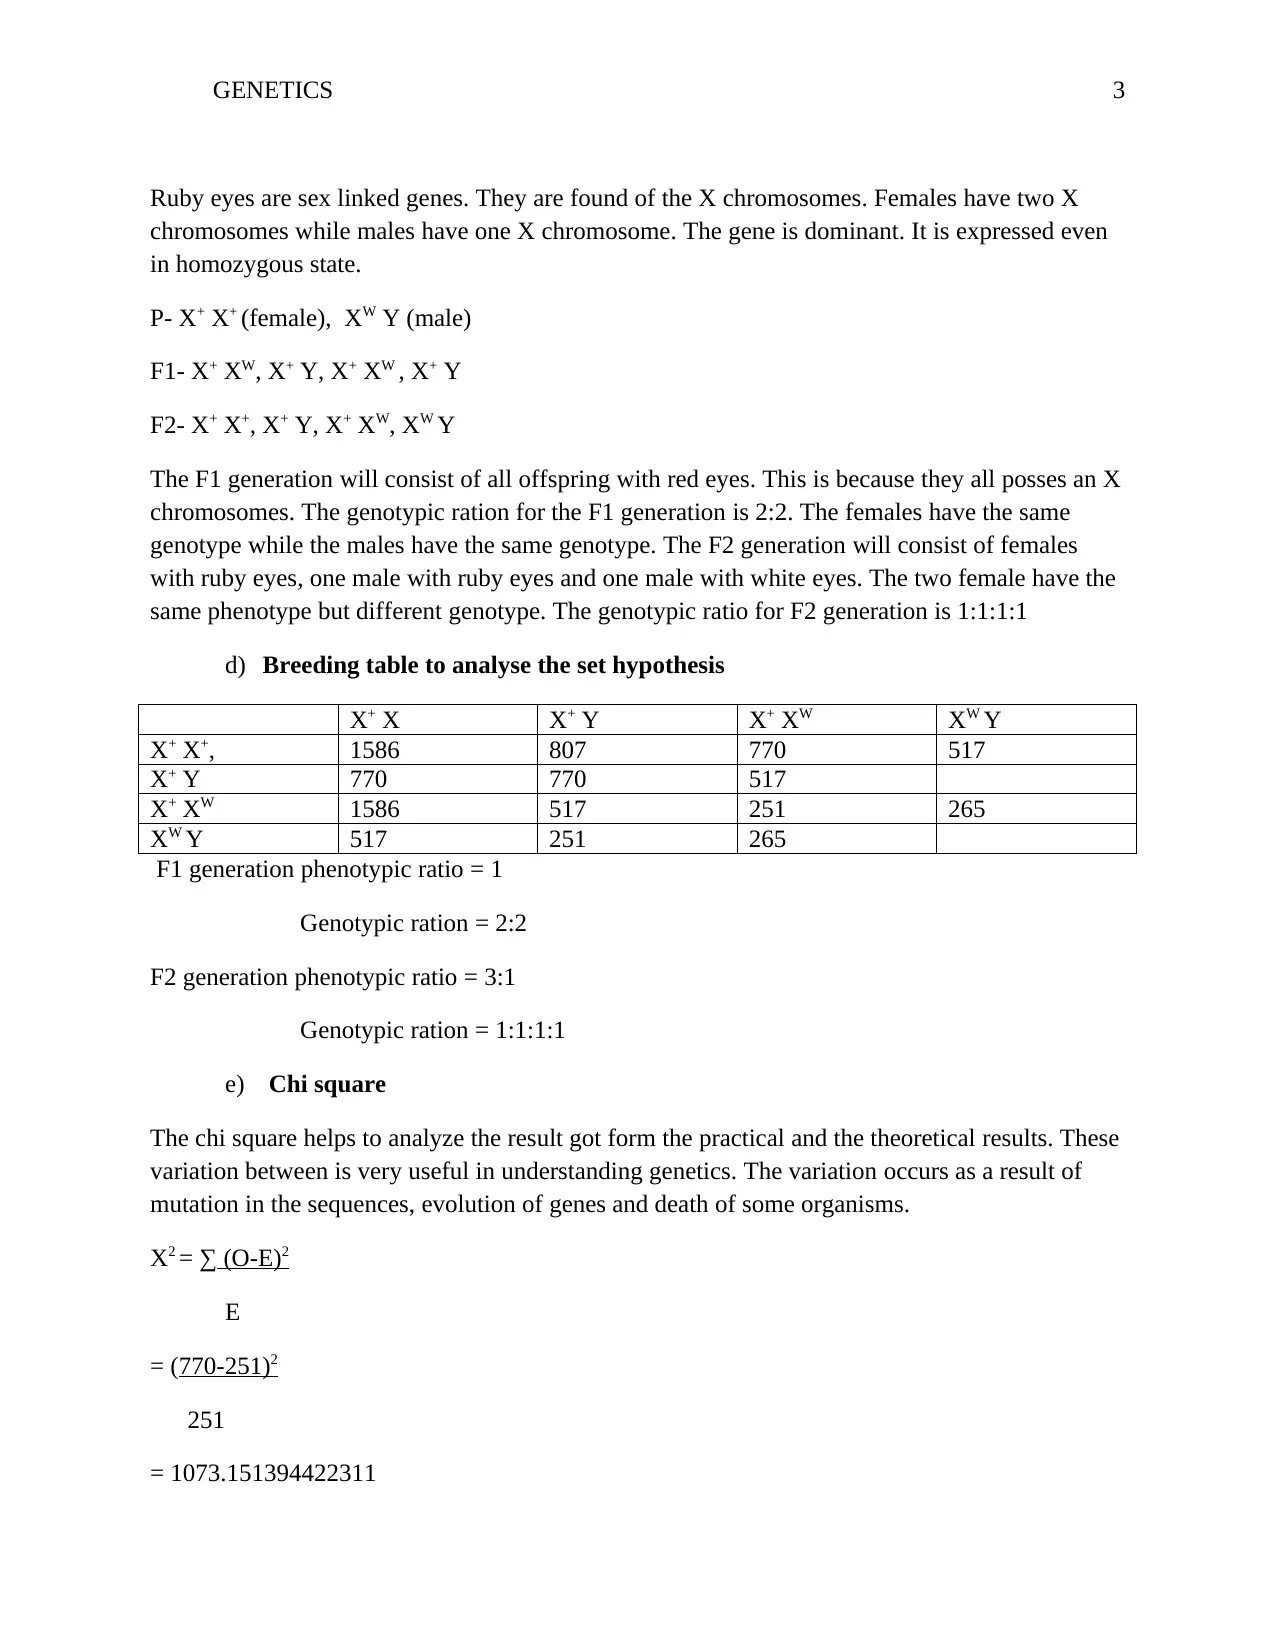
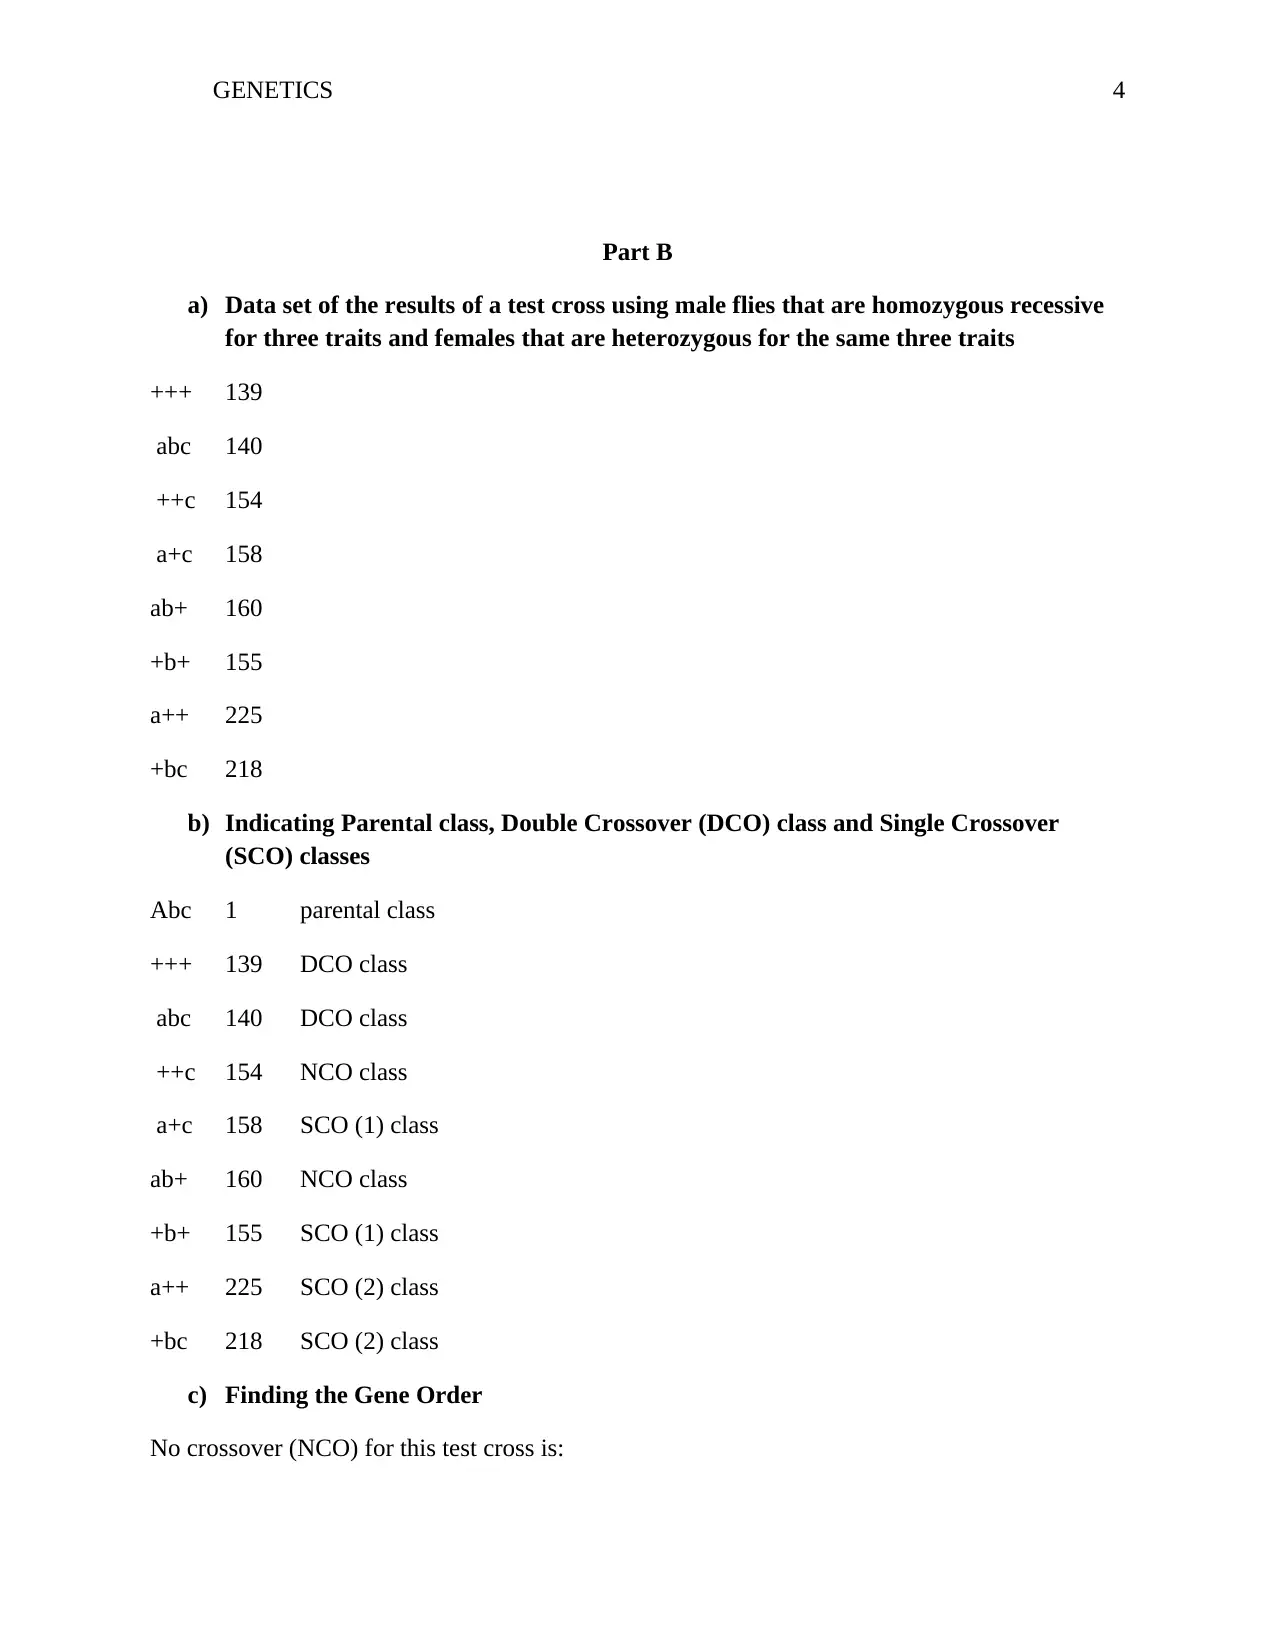
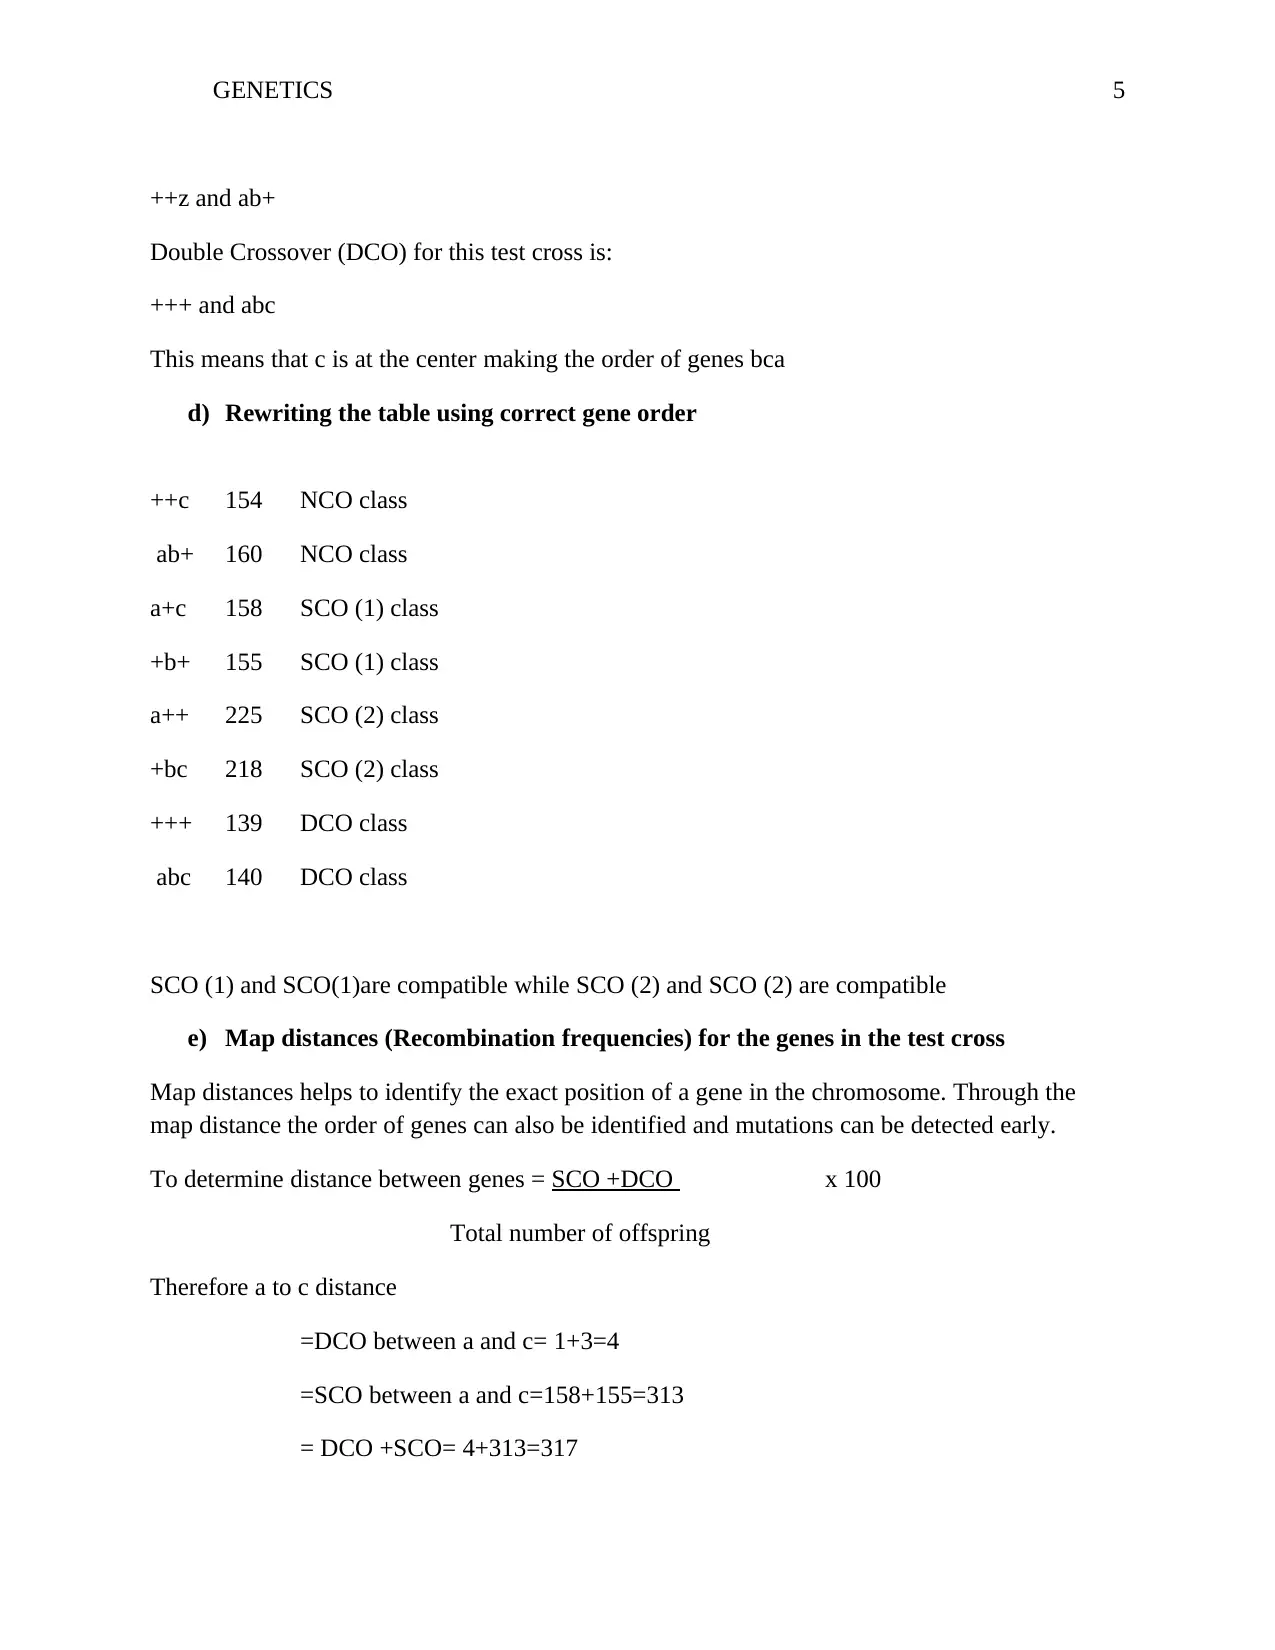
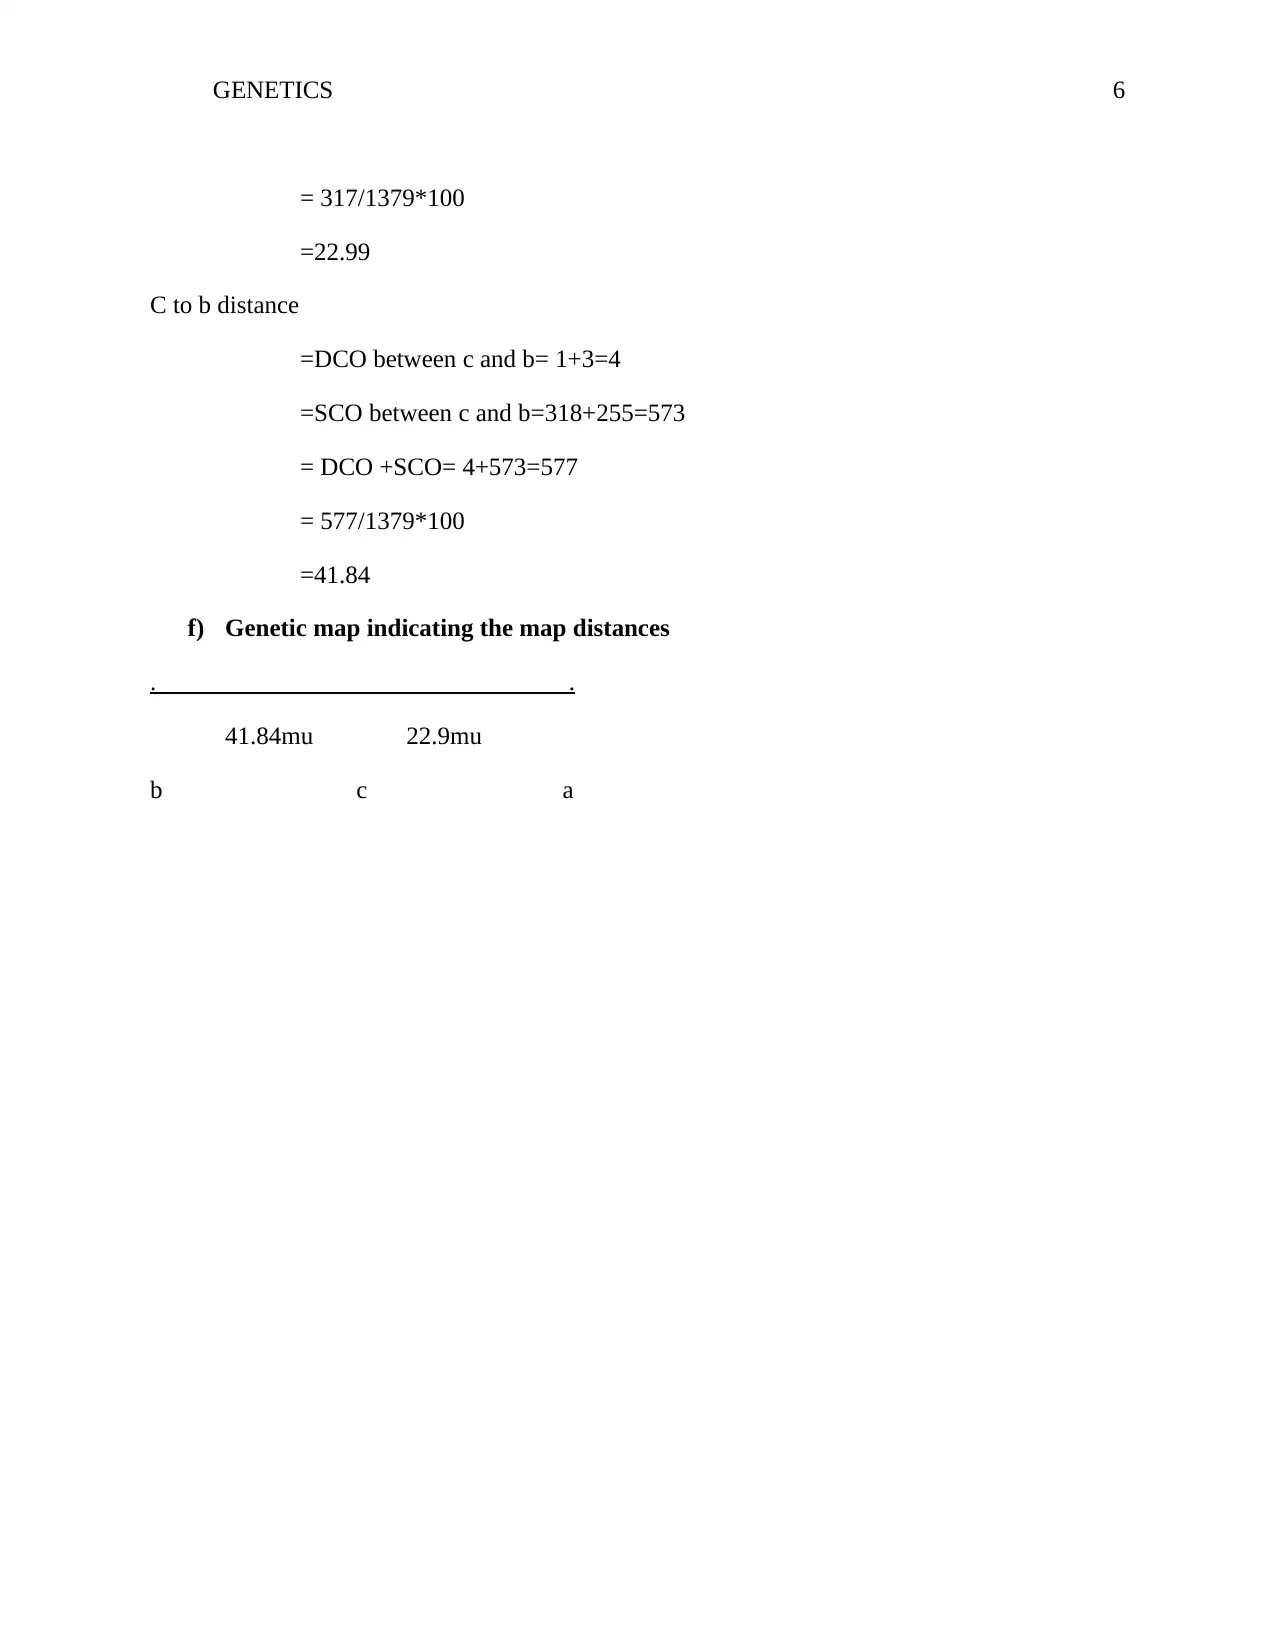
This assignment delves into Drosophila genetics, presenting solutions for analyzing crosses and mapping genes. Part A focuses on a cross between two Drosophila strains, employing genetic symbols and hypotheses to determine phenotypic and genotypic ratios, using a breeding table and chi-square analysis. Part B involves a test cross with homozygous recessive male flies and heterozygous female flies, identifying parental, double crossover (DCO), and single crossover (SCO) classes to establish gene order and map distances. Recombination frequencies are calculated to construct a genetic map, illustrating the relative positions of genes on the chromosome. This comprehensive analysis enhances understanding of genetic inheritance and mapping techniques in Drosophila.
1 out of 7
Related Documents


Your All-in-One AI-Powered Toolkit for Academic Success.
+13062052269
info@desklib.com
Available 24*7 on WhatsApp / Email
![[object Object]](/_next/static/media/star-bottom.7253800d.svg)
Copyright © 2020–2026 A2Z Services. All Rights Reserved. Developed and managed by ZUCOL.