Drought Prediction: A Comprehensive Review of Models and Technologies
VerifiedAdded on 2024/06/25
|19
|16631
|110
Literature Review
AI Summary
This review article provides a comprehensive overview of drought prediction, covering fundamental concepts, influencing factors, drought indicators, and advanced prediction models. It examines various drought prediction models, from statistical approaches to machine learning and deep learning, highlighting the superior performance of advanced techniques. The review explores the integration of remote sensing data, meteorological observations, hydrological modeling, and climate indices for enhanced accuracy. It serves as a valuable resource for researchers, practitioners, and policymakers engaged in drought prediction and management, fostering a deeper understanding of their capabilities and limitations, and contributing to improved resilience and sustainable development in drought-prone regions. The methodology involved an extensive search in databases, focusing on studies published in the last 20 years, and applying specific criteria to select relevant papers for review.
Citation: Nandgude, N.; Singh, T.P.;
Nandgude, S.; Tiwari, M. Drought
Prediction: A Comprehensive Review
of Different Drought Prediction
Models and Adopted Technologies.
Sustainability 2023, 15, 11684.
https://doi.org/10.3390/su151511684
Academic Editor: Steve W. Lyon
Received: 4 June 2023
Revised: 24 July 2023
Accepted: 26 July 2023
Published: 28 July 2023
Copyright:© 2023 by the authors.
LicenseeMDPI, Basel, Switzerland.
This article is an open access article
distributed under the terms and
conditions of the Creative Commons
Attribution (CC BY) license (https://
creativecommons.org/licenses/by/
4.0/).
sustainability
Review
Drought Prediction: A Comprehensive Review of Differe
Drought Prediction Models and Adopted Technologies
Neeta Nandgude1 , T. P. Singh1,*, Sachin Nandgude2 and Mukesh Tiwari3
1 Symbiosis Institute of Geo-Informatics, Symbiosis International (Deemed University), Pune 411016, Ind
nsnandgude@gmail.com
2 Department of Soil and Water Conservation Engineering, Mahatma Phule Krishi Vidyapeeth,
Rahuri 413722, India; sbnandgude1@gmail.com
3 Department of Soil and Water Conservation Engineering, College of Agriculture Engineering and Techn
Anand Agriculture University, Godhra 389001, India; mukesh.tiwari@aau.in
* Correspondence: tarunsingh@rediffmail.com
Abstract:Precipitation deficit conditions and temperature anomalies are responsible for the
rence of various types of natural disasters that cause tremendous loss of human life and eco
of the country. Out of all natural disasters, drought is one of the most recurring and comple
nomenons.Prediction of the onset of drought poses significant challenges to societies worldw
Drought occurrences occur across the world due to a variety of hydro-meteorological cause
anomalies in sea surface temperature. This article aims to provide a comprehensive overview
fundamental concepts and characteristics of drought, its complex nature, and the various fa
that influence drought, drought indicators, and advanced drought prediction models. An exten
survey is presented in the different drought prediction models employed in the literature, ran
from statistical approaches to machine learning and deep learning models.It has been found that
advanced techniques like machine learning and deep learning models outperform traditional mo
by improving drought prediction accuracy. This review article critically examines the advance
in technology that have facilitated improved drought prediction, identifies the key challenge
opportunities in the field of drought prediction, and identifies the key trends and topics tha
likely to give new directions to the future of drought prediction research. It explores the integ
of remote sensing data, meteorological observations, hydrological modeling, and climate indic
enhanced accuracy. Under the frequently changing climate conditions, this comprehensive
provides a valuable resource for researchers, practitioners, and policymakers engaged in d
prediction and management and fosters a deeper understanding of their capabilities and limit
This article paves the way for more accurate and effective drought prediction strategies, contri
to improved resilience and sustainable development in drought-prone regions.
Keywords: spatial data; drought prediction; machine learning; deep learning
1. Introduction
Variability in climatic conditions adversely impacts the global ecosystem. Precipita
deficit conditions and anomalies in high temperatures are the most dreadful natural ev
Precipitation and land surface temperature anomalies are majorly responsible for t
occurrences of extreme weather and climatic events like droughts and heat waves. Th
events adversely affect ecological, environmental, and socio-economic aspects around
world. In recent years, climate change can lead to more dangerous and frequently occu
natural calamities such as droughts,storms,floods,wildfires,and desertification.Out
of the total economic damage across the globe, 22% is due to these natural disaste1].
Out of all natural hazards, drought is the most dreadful natural hazard [2,3]. Due to the
multiple climatic and meteorological driving factors [4] at different spatial or temporal
scales, drought has become the most complex phenomenon [5].
Sustainability 2023, 15, 11684. https://doi.org/10.3390/su151511684 https://www.mdpi.com/journal/sustainability
Paraphrase This Document
Need a fresh take? Get an instant paraphrase of this document with our AI Paraphraser
Sustainability 2023, 15, 11684 2 of 19
Drought is one of the deadliest natural phenomena that has devastating effects
ecosystems and communities. Drought prediction models are essential for preparin
and mitigating the impacts of drought and, subsequently, contingency planning.Early
drought prediction at local as well as global levels is becoming essential. Drought pred
study requires a huge dataset at temporal and spatial scales, a selection of appropr
models based on the available data,and computing resources.Most of the time,data
unavailability and the requirement of huge computing resources become key issues
drought prediction research.So, this paper aims to highlight key aspects of drought
prediction research.
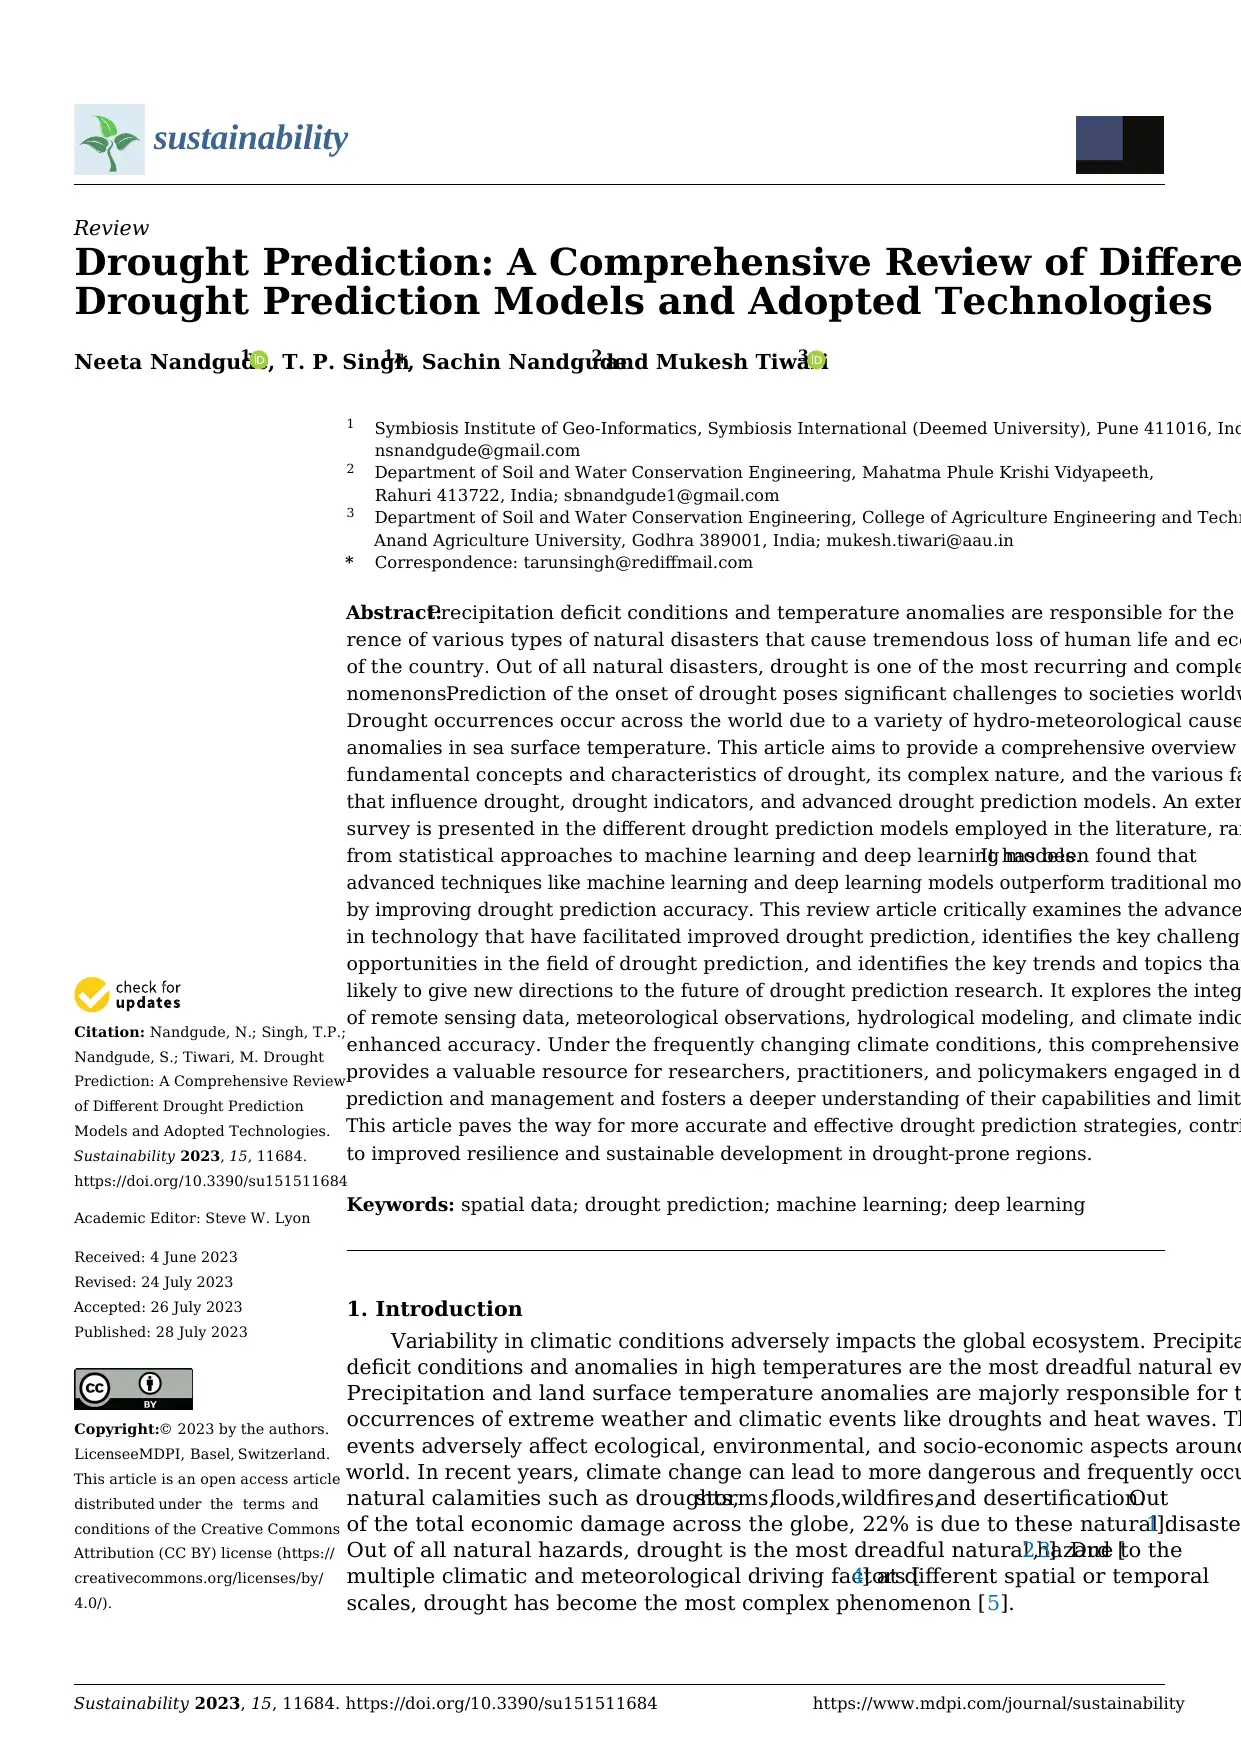
Drought: A Complex Phenomenon
Wilhite and Glantz [5] classified droughts into different types, like meteorological
hydrological, agriculture, and socio-economic droughts [6,7], which are shown in Figure 1.
Meteorological drought occurs due to deficit rainfall for a longer period, and it bec
a key for the occurrence of other types of droughts [8]. Less precipitation,the rise in
temperature,increase in the evaporation rate,and reduction in soilmoisture are key
indicators of agriculture drought triggers [9,10]. Declination of stream-flow and reduction
in water within water bodies causes hydrological droughts [11], which later impacts the
social and economic aspects of society and causes socio-economic drought [12]. Many
studies revealed that drought events lead to reduction in total agriculture producti
uncontrollable socioeconomic losses, and ecosystem degradation [13,14].
Due to the multiple climatic and meteorological driving factors [4] at different
temporal scales, drought has become the most complex phenomenon [5].
Drought is one of the deadliest natural phenomena that has devastating e
ecosystems and communities. Drought prediction models are essential for pre
and mitigating the impacts of drought and, subsequently, contingency plannin
drought prediction at local as well as global levels is becoming essential. Drou
tion study requires a huge dataset at temporal and spatial scales, a selection o
models based on the available data, and computing resources. Most of the tim
availability and the requirement of huge computing resources become k
drought prediction research. So, this paper aims to highlight key aspects of dr
diction research.
Drought: A Complex Phenomenon
Wilhite and Glantz [5] classified droughts into different types, like meteor
hydrological, agriculture, and socio-economic droughts [6,7], which are shown
1. Meteorological drought occurs due to deficit rainfall for a longer period, an
a key for the occurrence of other types of droughts [8]. Less precipitation, the
perature, increase in the evaporation rate, and reduction in soil moisture are k
tors of agriculture drought triggers [9,10]. Declination of stream-flow and red
water within water bodies causes hydrological droughts [11], which later impa
cial and economic aspects of society and causes socio-economic drought [12].
ies revealed that drought events lead to reduction in total agriculture product
controllable socioeconomic losses, and ecosystem degradation [13,14].
Figure 1. Drought types and its propagation.
Due to the complex nature of drought, its prediction has become a key ch
front of researchers, planners, and decision and policymakers. The identificati
sessment of drought-driving risk factors for planning and mitigation is becomi
issue across the globe [15,16].
The objective of this article is to offer a comprehensive overview of the ke
and features of drought, highlighting its complex nature, the major driving fac
contribute to its occurrence, and the drought indicators used to measure drou
ough examination is conducted on a variety of drought prediction models foun
existing literature, encompassing statistical approaches as well as machine le
deep learning models.
This critical review article analyzes the technological advancements that h
tributed to enhanced drought prediction, evaluates the main challenges and o
in this field, and identifies the emerging trends and topics that will shape the
drought prediction research. It investigates the integration of remote sensing
orological observations, hydrological modeling, and climate indices to improve
accuracy. By offering a comprehensive overview, this review serves as a valua
for researchers, practitioners, and policymakers involved in drought predictio
agement. The review will conclude by summarizing the current state of knowl
well as challenging and identifying areas for future research.
Meteorological
Drought
•Less
precipitation
•High
temperature
Agricultural
Drought
•Temperature rise
•Soil moisture
reduction
•Increased evapo-
transpiration rate
Hydrological
Drought
•Stream flow
declination
•Low water levels in
water bodies
Socio-Economic
Drought
•Food insecurity
•Water scarcity
•Health issues
Figure 1. Drought types and its propagation.
Due to the complex nature of drought,its prediction has become a key challenge
in front of researchers, planners, and decision and policymakers.The identification and
assessment of drought-driving risk factors for planning and mitigation is becoming a
issue across the globe [15,16].
The objective of this article is to offer a comprehensive overview of the key princ
and features of drought, highlighting its complex nature, the major driving factors
contribute to its occurrence,and the drought indicators used to measure drought.A
thorough examination is conducted on a variety of drought prediction models found in
existing literature, encompassing statistical approaches as well as machine learnin
deep learning models.
This critical review article analyzes the technological advancements that have
tributed to enhanced drought prediction, evaluates the main challenges and opportun
in this field, and identifies the emerging trends and topics that will shape the future
drought prediction research. It investigates the integration of remote sensing data, m
rological observations, hydrological modeling, and climate indices to improve predict
accuracy. By offering a comprehensive overview, this review serves as a valuable res
for researchers, practitioners, and policymakers involved in drought prediction and m
agement. The review will conclude by summarizing the current state of knowledge, as
as challenging and identifying areas for future research.
Drought is one of the deadliest natural phenomena that has devastating effects
ecosystems and communities. Drought prediction models are essential for preparin
and mitigating the impacts of drought and, subsequently, contingency planning.Early
drought prediction at local as well as global levels is becoming essential. Drought pred
study requires a huge dataset at temporal and spatial scales, a selection of appropr
models based on the available data,and computing resources.Most of the time,data
unavailability and the requirement of huge computing resources become key issues
drought prediction research.So, this paper aims to highlight key aspects of drought
prediction research.
Drought: A Complex Phenomenon
Wilhite and Glantz [5] classified droughts into different types, like meteorological
hydrological, agriculture, and socio-economic droughts [6,7], which are shown in Figure 1.
Meteorological drought occurs due to deficit rainfall for a longer period, and it bec
a key for the occurrence of other types of droughts [8]. Less precipitation,the rise in
temperature,increase in the evaporation rate,and reduction in soilmoisture are key
indicators of agriculture drought triggers [9,10]. Declination of stream-flow and reduction
in water within water bodies causes hydrological droughts [11], which later impacts the
social and economic aspects of society and causes socio-economic drought [12]. Many
studies revealed that drought events lead to reduction in total agriculture producti
uncontrollable socioeconomic losses, and ecosystem degradation [13,14].
Due to the multiple climatic and meteorological driving factors [4] at different
temporal scales, drought has become the most complex phenomenon [5].
Drought is one of the deadliest natural phenomena that has devastating e
ecosystems and communities. Drought prediction models are essential for pre
and mitigating the impacts of drought and, subsequently, contingency plannin
drought prediction at local as well as global levels is becoming essential. Drou
tion study requires a huge dataset at temporal and spatial scales, a selection o
models based on the available data, and computing resources. Most of the tim
availability and the requirement of huge computing resources become k
drought prediction research. So, this paper aims to highlight key aspects of dr
diction research.
Drought: A Complex Phenomenon
Wilhite and Glantz [5] classified droughts into different types, like meteor
hydrological, agriculture, and socio-economic droughts [6,7], which are shown
1. Meteorological drought occurs due to deficit rainfall for a longer period, an
a key for the occurrence of other types of droughts [8]. Less precipitation, the
perature, increase in the evaporation rate, and reduction in soil moisture are k
tors of agriculture drought triggers [9,10]. Declination of stream-flow and red
water within water bodies causes hydrological droughts [11], which later impa
cial and economic aspects of society and causes socio-economic drought [12].
ies revealed that drought events lead to reduction in total agriculture product
controllable socioeconomic losses, and ecosystem degradation [13,14].
Figure 1. Drought types and its propagation.
Due to the complex nature of drought, its prediction has become a key ch
front of researchers, planners, and decision and policymakers. The identificati
sessment of drought-driving risk factors for planning and mitigation is becomi
issue across the globe [15,16].
The objective of this article is to offer a comprehensive overview of the ke
and features of drought, highlighting its complex nature, the major driving fac
contribute to its occurrence, and the drought indicators used to measure drou
ough examination is conducted on a variety of drought prediction models foun
existing literature, encompassing statistical approaches as well as machine le
deep learning models.
This critical review article analyzes the technological advancements that h
tributed to enhanced drought prediction, evaluates the main challenges and o
in this field, and identifies the emerging trends and topics that will shape the
drought prediction research. It investigates the integration of remote sensing
orological observations, hydrological modeling, and climate indices to improve
accuracy. By offering a comprehensive overview, this review serves as a valua
for researchers, practitioners, and policymakers involved in drought predictio
agement. The review will conclude by summarizing the current state of knowl
well as challenging and identifying areas for future research.
Meteorological
Drought
•Less
precipitation
•High
temperature
Agricultural
Drought
•Temperature rise
•Soil moisture
reduction
•Increased evapo-
transpiration rate
Hydrological
Drought
•Stream flow
declination
•Low water levels in
water bodies
Socio-Economic
Drought
•Food insecurity
•Water scarcity
•Health issues
Figure 1. Drought types and its propagation.
Due to the complex nature of drought,its prediction has become a key challenge
in front of researchers, planners, and decision and policymakers.The identification and
assessment of drought-driving risk factors for planning and mitigation is becoming a
issue across the globe [15,16].
The objective of this article is to offer a comprehensive overview of the key princ
and features of drought, highlighting its complex nature, the major driving factors
contribute to its occurrence,and the drought indicators used to measure drought.A
thorough examination is conducted on a variety of drought prediction models found in
existing literature, encompassing statistical approaches as well as machine learnin
deep learning models.
This critical review article analyzes the technological advancements that have
tributed to enhanced drought prediction, evaluates the main challenges and opportun
in this field, and identifies the emerging trends and topics that will shape the future
drought prediction research. It investigates the integration of remote sensing data, m
rological observations, hydrological modeling, and climate indices to improve predict
accuracy. By offering a comprehensive overview, this review serves as a valuable res
for researchers, practitioners, and policymakers involved in drought prediction and m
agement. The review will conclude by summarizing the current state of knowledge, as
as challenging and identifying areas for future research.
Sustainability 2023, 15, 11684 3 of 19
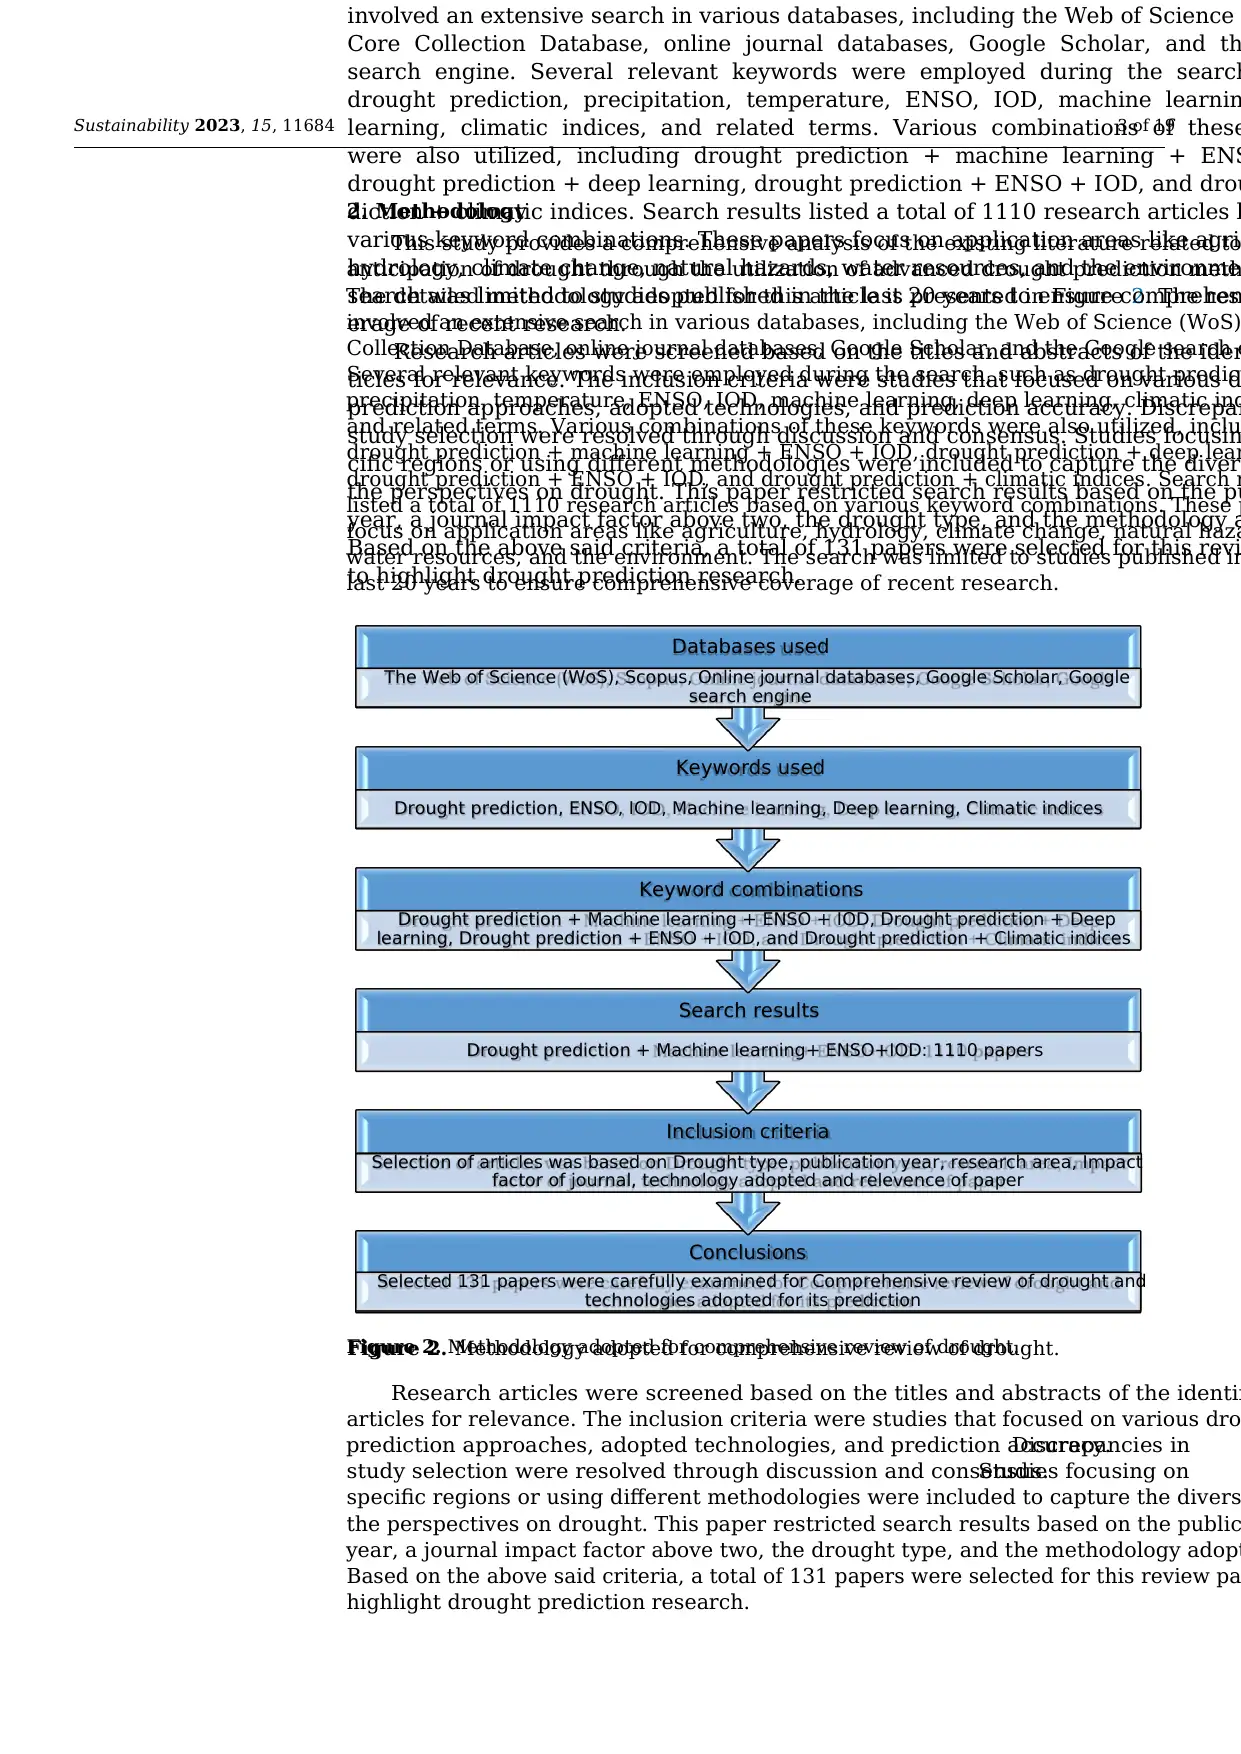
2. Methodology
This study provides a comprehensive analysis of the existing literature related to
anticipation of drought through the utilization of advanced drought prediction meth
The detailed methodology adopted for this article is presented in Figure 2. The rese
involved an extensive search in various databases, including the Web of Science (WoS)
Collection Database, online journal databases, Google Scholar, and the Google search e
Several relevant keywords were employed during the search, such as drought predict
precipitation, temperature, ENSO, IOD, machine learning, deep learning, climatic ind
and related terms. Various combinations of these keywords were also utilized, inclu
drought prediction + machine learning + ENSO + IOD, drought prediction + deep lear
drought prediction + ENSO + IOD, and drought prediction + climatic indices. Search r
listed a total of 1110 research articles based on various keyword combinations. These p
focus on application areas like agriculture, hydrology, climate change, natural haza
water resources, and the environment. The search was limited to studies published in
last 20 years to ensure comprehensive coverage of recent research.
involved an extensive search in various databases, including the Web of Science
Core Collection Database, online journal databases, Google Scholar, and th
search engine. Several relevant keywords were employed during the search
drought prediction, precipitation, temperature, ENSO, IOD, machine learnin
learning, climatic indices, and related terms. Various combinations of these
were also utilized, including drought prediction + machine learning + ENS
drought prediction + deep learning, drought prediction + ENSO + IOD, and drou
diction + climatic indices. Search results listed a total of 1110 research articles b
various keyword combinations. These papers focus on application areas like agric
hydrology, climate change, natural hazards, water resources, and the environme
search was limited to studies published in the last 20 years to ensure comprehen
erage of recent research.
Research articles were screened based on the titles and abstracts of the iden
ticles for relevance. The inclusion criteria were studies that focused on various d
prediction approaches, adopted technologies, and prediction accuracy. Discrepan
study selection were resolved through discussion and consensus. Studies focusin
cific regions or using different methodologies were included to capture the diver
the perspectives on drought. This paper restricted search results based on the pu
year, a journal impact factor above two, the drought type, and the methodology a
Based on the above said criteria, a total of 131 papers were selected for this revi
to highlight drought prediction research.
Figure 2. Methodology adopted for comprehensive review of drought.
Conclusions
Selected 131 papers were carefully examined for Comprehensive review of drought and
technologies adopted for its prediction
Inclusion criteria
Selection of articles was based on Drought type, publication year, research area, Impact
factor of journal, technology adopted and relevence of paper
Search results
Drought prediction + Machine learning+ ENSO+IOD: 1110 papers
Keyword combinations
Drought prediction + Machine learning + ENSO + IOD, Drought prediction + Deep
learning, Drought prediction + ENSO + IOD, and Drought prediction + Climatic indices
Keywords used
Drought prediction, ENSO, IOD, Machine learning, Deep learning, Climatic indices
Databases used
The Web of Science (WoS), Scopus, Online journal databases, Google Scholar, Google
search engine
Figure 2. Methodology adopted for comprehensive review of drought.
Research articles were screened based on the titles and abstracts of the identifi
articles for relevance. The inclusion criteria were studies that focused on various dro
prediction approaches, adopted technologies, and prediction accuracy.Discrepancies in
study selection were resolved through discussion and consensus.Studies focusing on
specific regions or using different methodologies were included to capture the divers
the perspectives on drought. This paper restricted search results based on the public
year, a journal impact factor above two, the drought type, and the methodology adopt
Based on the above said criteria, a total of 131 papers were selected for this review pa
highlight drought prediction research.
⊘ This is a preview!⊘
Do you want full access?
Subscribe today to unlock all pages.
Trusted by 1+ million students worldwide
Sustainability 2023, 15, 11684 4 of 19
3. Drought Modeling Components
Drought is an environmental catastrophe characterized by an extended period
unusually low precipitation,leading to water scarcity and posing risks to agriculture,
livestock, and ecosystems. There are several parameters like precipitation, soil moi
stream-flow,evapotranspiration,temperature,wind, relative humidity,and vegetation
health which can help to gain insights into the severity and duration of drought event
Drought studies require climatic, remote sensing (RS), hydrologic, and atmosph
data. The data can be acquired from various ground observation stations, earth observ
satellites,open linked data,sensors,and the Internet of Things (IoT).So, the data is
usually extracted from heterogeneous data sources in a heterogeneous format.It may
be continuous,discrete,images,texts,videos,etc.[17]. As earth observation systems
continue to advance rapidly, remote sensing (RS) systems and climate sensing systems
a wide range of high-resolution earth observations encompassing spatial, temporal
radiometric measurements [18–20]. Numerous efforts have been made to comprehend the
connection between drought and its influencing factors and to enhance the precisio
drought prediction [21–31]. Improving the accuracy of drought forecasting models require
an understanding of the broad range connections, or tele-connections, between clim
indices and variables indicating drought occurrence such as precipitation,vegetation,
and temperature.
3.1. Hydro-Meteorological Parameters
Hydrological and meteorological parameters play an important role in predictin
drought. The key parameters that are used for drought prediction are: (i) Precipitation
the amount of rain or snowfall that occurs in a particular region. Low levels of precipita
can indicate the onset of drought conditions [7]. (ii)Temperature: Elevated temperatures
have the potential to accelerate evapotranspiration, resulting in reduced soil moistur
ultimately leading to the onset of drought conditions [32]. (iii) Evapotranspiration:It is
the mechanism by which water is moved from the surface of the Earth to the atmosph
through evaporation and plant transpiration. High rates of evapotranspiration can ca
soil moisture deficits,leading to an increased risk of drought [33]. (iv) Soil Moisture:
Soil moisture is the water content in the soil.A lack of soil moisture can cause drought
conditions.Soil moisture is influenced by precipitation,evapotranspiration,and other
factors [34]. (v) Stream-flow: Stream-flow is the amount of water that flows in a strea
river. A decrease in stream-flow over a prolonged period can indicate hydrological drou
conditions [35]. (vi) Groundwater level: The groundwater level is the depth at which wate
is found below the ground surface. A decrease in the groundwater level over a prolon
period can indicate drought conditions [36]. (vii) Atmospheric conditions: These include
factors that can influence precipitation patterns and the initiation of drought condi
such as atmospheric pressure, humidity, wind speed, and direction [37–39].
In order to anticipate the likelihood and severity of drought conditions, drought pr
tion models often combine these hydrological and meteorological information. Researc
and decision-makers can create efficient strategies for reducing the effects of drou
agriculture,water resources,and other crucial sectors by tracking these characteristic
over time.
3.2. Climatological Parameters
Oceanic atmospheric parameters can significantly affect drought conditions. On
the most important factors is the El Niño–Southern Oscillation (ENSO), which is a na
climate phenomenon characterized by the periodic warming and cooling of the equat
Pacific Ocean.During El Niño events,the sea surface temperatures in the central and
eastern Pacific Ocean rise, resulting in changes in atmospheric circulation patterns th
alter rainfall patterns around the world.The patterns of ENSO phase variation can lead
to large variations in precipitation in the tropical Pacific Ocean [40]. Due to the potential
tele-connections, ENSO is considered to be an important driver that can be used to pr
Paraphrase This Document
Need a fresh take? Get an instant paraphrase of this document with our AI Paraphraser
Sustainability 2023, 15, 11684 5 of 19
climate change at different time scales in regional and global areas [41,42]. El Niño events
have been linked to severe droughts in various regions, including Southeast Asia [43,44],
Australia, and South America. The Oceanic Niño Index (ONI) and Niño 3.4 Index are t
most commonly used indices to define ENSO (El Niño and La Niña) phases [45,46]. Several
studies on drought forecasting have indicated the significant role of the Niño 3.4 inde
both monitoring [47,48] and predicting drought events. Additionally, the Niño 3.4 inde
is known to exhibit an inverse relationship with rainfall [49]. The Nino 3.4 index is used
to monitor and predict drought conditions in the tropical Pacific Ocean region, includ
countries such as Australia, Indonesia, India, and parts of Africa and South America tha
affected by the El Niño–Southern Oscillation (ENSO) climate phenomenon [47,48,50–
It has been observed [54] that another important oceanic atmospheric parameter
affecting drought is the Indian Ocean Dipole (IOD), which is a climate mode that descri
the fluctuations in sea surface temperatures in the Indian Ocean.During positive IOD
events, the western Indian Ocean becomes warmer than the eastern Indian Ocean, resu
in changes in atmospheric circulation that can impact rainfall patterns in regions su
East Africa, Southeast Asia [55,56], and Australia [57].
In addition to ENSO and IOD, other oceanic atmospheric parameters,such as the
Atlantic Multidecadal Oscillation (AMO) and the Pacific Decadal Oscillation (PDO),
also affect drought conditions. These climate modes describe the variability of sea su
temperatures in the Atlantic and Pacific Oceans,respectively,and can influence atmo-
spheric circulation patterns and precipitation patterns in different regions of the world
Iran [24,52]. Overall, oceanic atmospheric parameters play a significant role in drought
velopment, and their monitoring can help in predicting and managing drought conditio
3.3. Drought Indicators
Drought indices are quantitative representations of drought severity computed u
climatic or hydro-meteorological parameters. These indices combine various hydrolog
and meteorological parameters to assess drought conditions. By analyzing the chan
patterns of precipitation, temperature, soil moisture, stream-flow, vegetation health
snowpack in a region,one can observe the slow onset of drought.Drought indicators
always help measure the qualitative state of drought and keep track of the propagatio
droughts. These statistical measures are used to characterize the severity and duratio
drought conditions.
There have been numerous drought indices developed throughout the years, wh
utilize different climatic and meteorological variables. Some of the popular represent
indices are listed in Table 1. Wayne Palmer developed the Palmer Drought Severity In
(PDSI) during the 1960s specifically for the United States Department of Agricultur8].
The PDSI is widely utilized as a drought index in various applications.It calculates the
water balance equation to determine the moisture availability in the study region.This
index has the advantage that it incorporates precipitation, temperature, and soil mois
as well as previous PDSI values. But, it has the drawback of a time lag of 9 months, w
is not suitable for rapid drought identification [58,59]. It is specifically designed to assess
extended periods of abnormal weather conditions, encompassing both excessive ra
and arid conditions. However, due to its slow responsiveness, the PDSI may not provi
timely detection of short-term dry spells that could be detrimental to crops during cru
growth periods. The short-term agricultural drought conditions that impact crop grow
can be monitored using the CMI. The CMI is determined by evaluating evapotranspirat
deficits [60]. PDSI and CMI have a limitation of assumption that Land Used Land Cov
(LULC) and soil profile of the entire region is the same.In reality,the LULC and soil
properties vary from place to place.
Sustainability 2023, 15, 11684 6 of 19
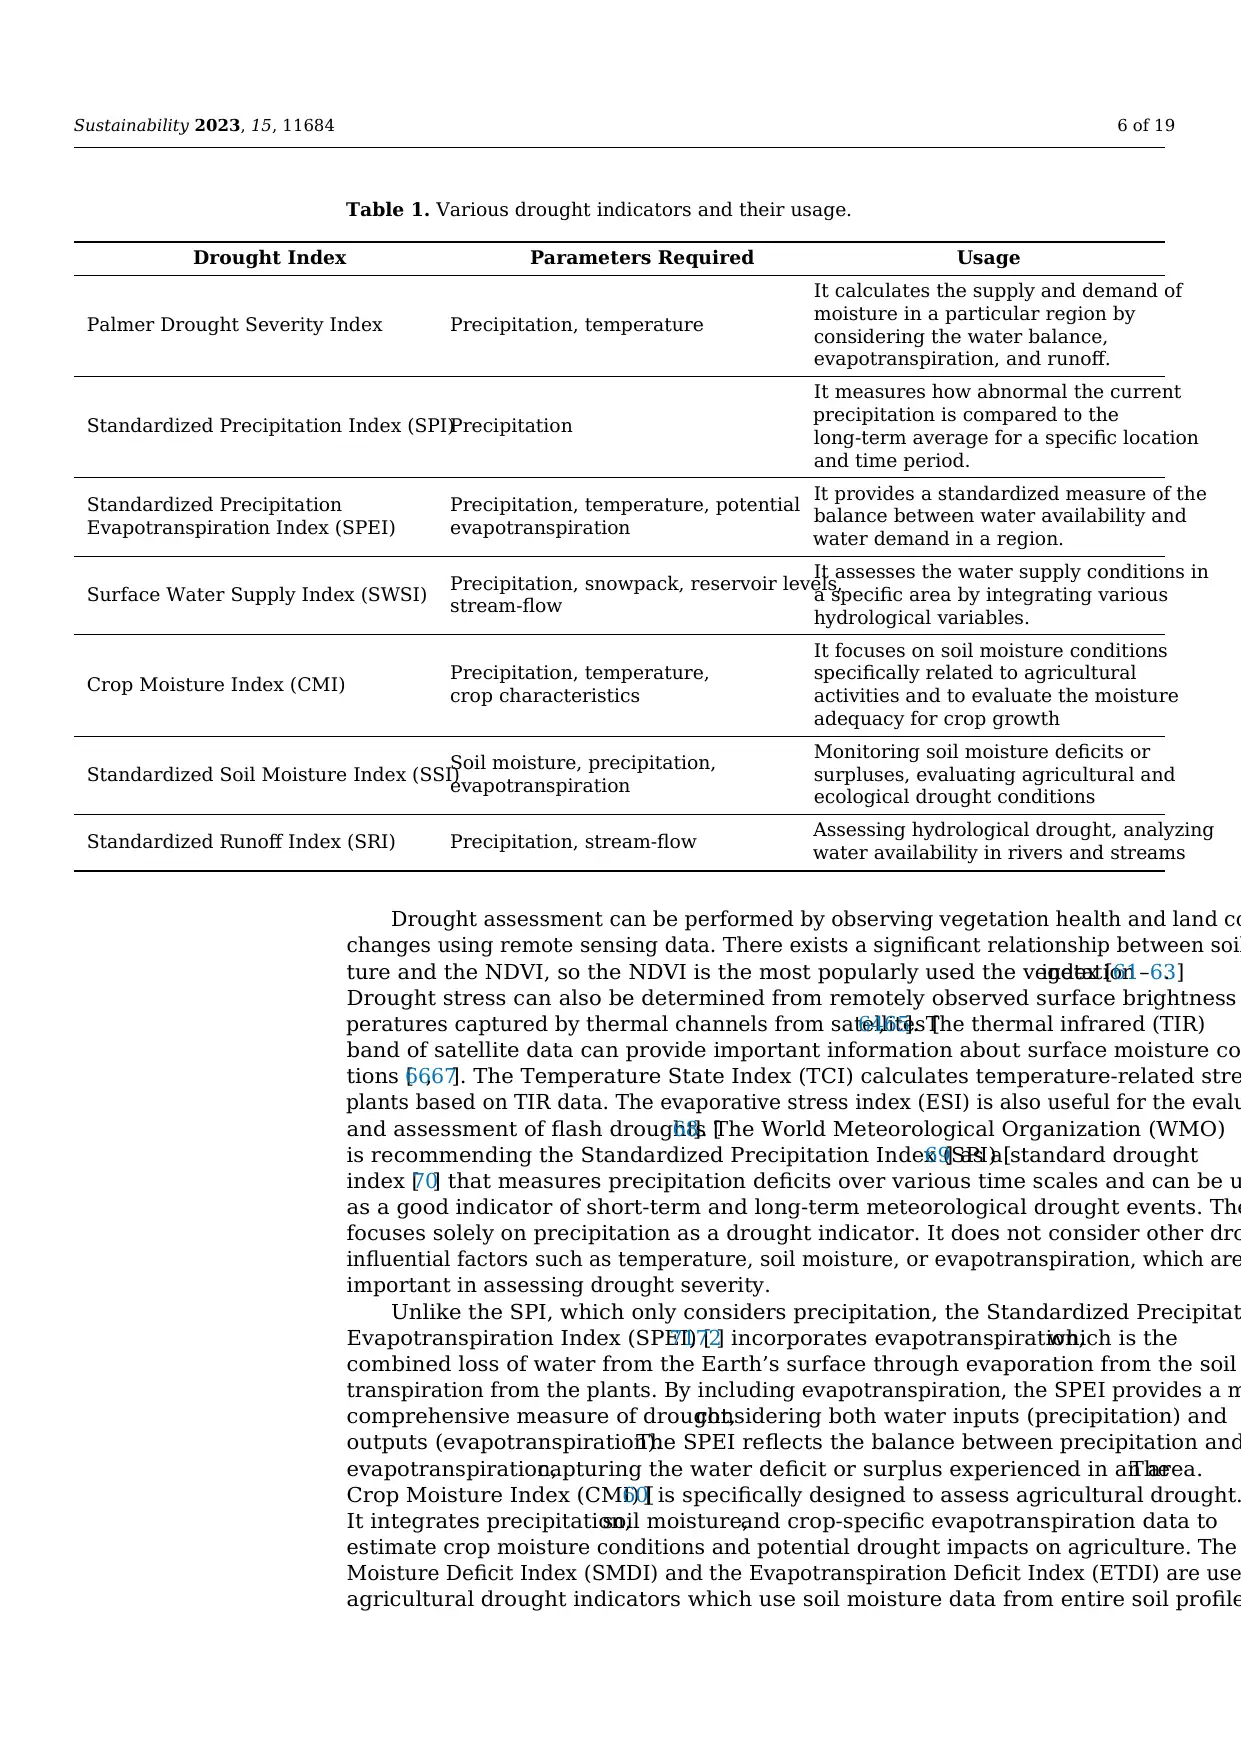
Table 1. Various drought indicators and their usage.
Drought Index Parameters Required Usage
Palmer Drought Severity Index Precipitation, temperature
It calculates the supply and demand of
moisture in a particular region by
considering the water balance,
evapotranspiration, and runoff.
Standardized Precipitation Index (SPI)Precipitation
It measures how abnormal the current
precipitation is compared to the
long-term average for a specific location
and time period.
Standardized Precipitation
Evapotranspiration Index (SPEI)
Precipitation, temperature, potential
evapotranspiration
It provides a standardized measure of the
balance between water availability and
water demand in a region.
Surface Water Supply Index (SWSI) Precipitation, snowpack, reservoir levels,
stream-flow
It assesses the water supply conditions in
a specific area by integrating various
hydrological variables.
Crop Moisture Index (CMI) Precipitation, temperature,
crop characteristics
It focuses on soil moisture conditions
specifically related to agricultural
activities and to evaluate the moisture
adequacy for crop growth
Standardized Soil Moisture Index (SSI)
Soil moisture, precipitation,
evapotranspiration
Monitoring soil moisture deficits or
surpluses, evaluating agricultural and
ecological drought conditions
Standardized Runoff Index (SRI) Precipitation, stream-flow Assessing hydrological drought, analyzing
water availability in rivers and streams
Drought assessment can be performed by observing vegetation health and land co
changes using remote sensing data. There exists a significant relationship between soil
ture and the NDVI, so the NDVI is the most popularly used the vegetationindex [61–63].
Drought stress can also be determined from remotely observed surface brightness
peratures captured by thermal channels from satellites [64,65]. The thermal infrared (TIR)
band of satellite data can provide important information about surface moisture co
tions [66,67]. The Temperature State Index (TCI) calculates temperature-related stre
plants based on TIR data. The evaporative stress index (ESI) is also useful for the evalu
and assessment of flash droughts [68]. The World Meteorological Organization (WMO)
is recommending the Standardized Precipitation Index (SPI) [69] as a standard drought
index [70] that measures precipitation deficits over various time scales and can be u
as a good indicator of short-term and long-term meteorological drought events. The
focuses solely on precipitation as a drought indicator. It does not consider other dro
influential factors such as temperature, soil moisture, or evapotranspiration, which are
important in assessing drought severity.
Unlike the SPI, which only considers precipitation, the Standardized Precipitat
Evapotranspiration Index (SPEI) [71,72] incorporates evapotranspiration,which is the
combined loss of water from the Earth’s surface through evaporation from the soil
transpiration from the plants. By including evapotranspiration, the SPEI provides a m
comprehensive measure of drought,considering both water inputs (precipitation) and
outputs (evapotranspiration).The SPEI reflects the balance between precipitation and
evapotranspiration,capturing the water deficit or surplus experienced in an area.The
Crop Moisture Index (CMI) [60] is specifically designed to assess agricultural drought.
It integrates precipitation,soil moisture,and crop-specific evapotranspiration data to
estimate crop moisture conditions and potential drought impacts on agriculture. The
Moisture Deficit Index (SMDI) and the Evapotranspiration Deficit Index (ETDI) are use
agricultural drought indicators which use soil moisture data from entire soil profile
⊘ This is a preview!⊘
Do you want full access?
Subscribe today to unlock all pages.
Trusted by 1+ million students worldwide
Sustainability 2023, 15, 11684 7 of 19
evapotranspiration data, respectively. These two indices are good indicators of short-
drought events [73,74].
All these drought indicators provide meaningful information, but every individu
drought index has its own merits and demerits [75]. So, it will be helpful to use the
composite drought index that takes into account region-based impactful drought indica
to build an accurate and powerful drought prediction system. Many studies proved t
VCI coupled with TCI provides a powerful tool to monitor drought conditions [76–79].
There exists a strong correlation between drought indices such as the TCI, VCI, PCI, N
and the Soil Moisture Condition Index (SMCI). Incorporating knowledge of such ind
in drought prediction studies will improve forecast accuracy [80–82]. Instead of using a
single drought index, the integration of multiple drought indices will improve resul
drought forecasting studies [78,79,82].
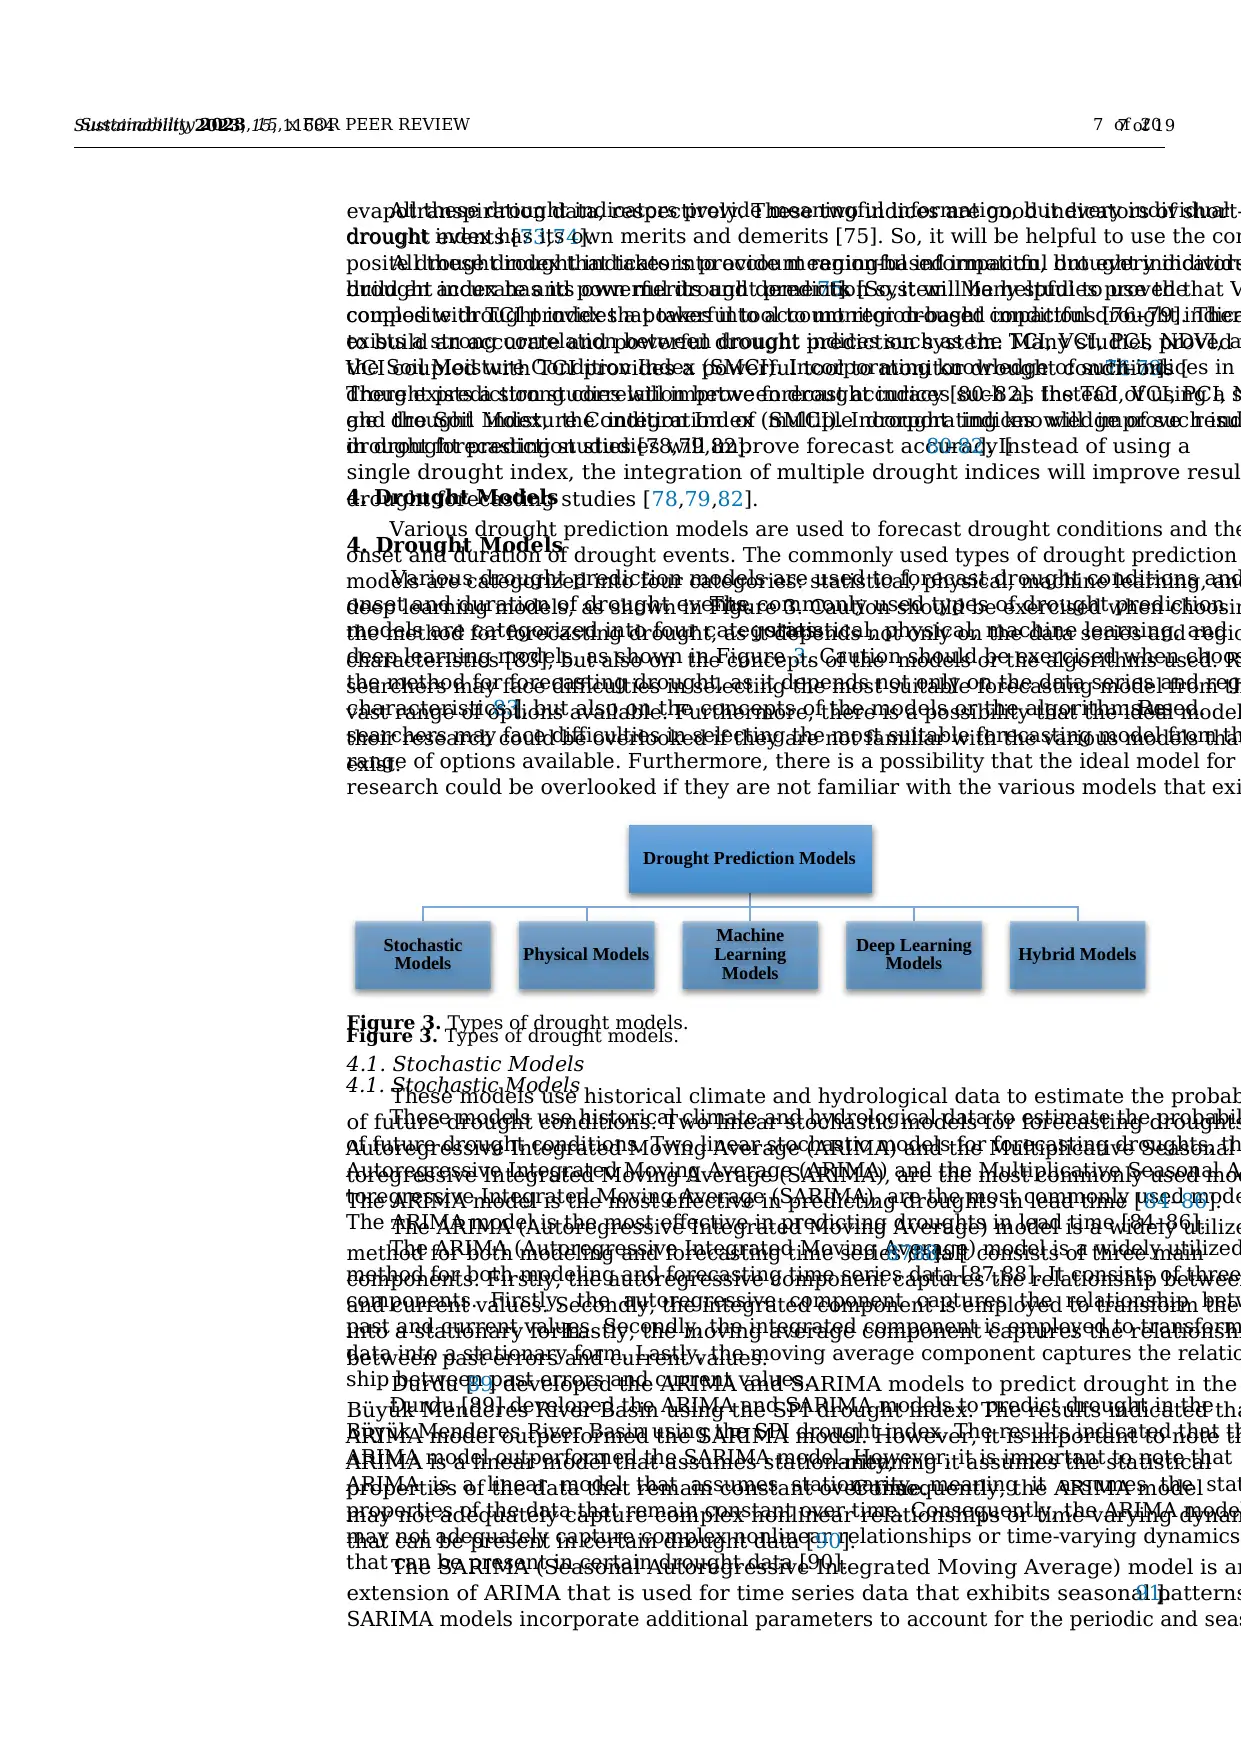
4. Drought Models
Various drought prediction models are used to forecast drought conditions and
onset and duration of drought events.The commonly used types of drought prediction
models are categorized into four categories:statistical, physical, machine learning, and
deep learning models, as shown in Figure 3. Caution should be exercised when choos
the method for forecasting drought, as it depends not only on the data series and reg
characteristics [83], but also on the concepts of the models or the algorithms used.Re-
searchers may face difficulties in selecting the most suitable forecasting model from th
range of options available. Furthermore, there is a possibility that the ideal model for
research could be overlooked if they are not familiar with the various models that exi
Sustainability 2023, 15, x FOR PEER REVIEW 7 of 20
All these drought indicators provide meaningful information, but every individual
drought index has its own merits and demerits [75]. So, it will be helpful to use the com
posite drought index that takes into account region-based impactful drought indicators
build an accurate and powerful drought prediction system. Many studies proved that V
coupled with TCI provides a powerful tool to monitor drought conditions [76–79]. Ther
exists a strong correlation between drought indices such as the TCI, VCI, PCI, NDVI, a
the Soil Moisture Condition Index (SMCI). Incorporating knowledge of such indices in
drought prediction studies will improve forecast accuracy [80–82]. Instead of using a s
gle drought index, the integration of multiple drought indices will improve resul
drought forecasting studies [78,79,82].
4. Drought Models
Various drought prediction models are used to forecast drought conditions and the
onset and duration of drought events. The commonly used types of drought prediction
models are categorized into four categories: statistical, physical, machine learning, and
deep learning models, as shown in Figure 3. Caution should be exercised when choosin
the method for forecasting drought, as it depends not only on the data series and regio
characteristics [83], but also on the concepts of the models or the algorithms used. R
searchers may face difficulties in selecting the most suitable forecasting model from th
vast range of options available. Furthermore, there is a possibility that the ideal model
their research could be overlooked if they are not familiar with the various models that
exist.
Figure 3. Types of drought models.
4.1. Stochastic Models
These models use historical climate and hydrological data to estimate the probabil
of future drought conditions. Two linear stochastic models for forecasting droughts, th
Autoregressive Integrated Moving Average (ARIMA) and the Multiplicative Seasonal A
toregressive Integrated Moving Average (SARIMA), are the most commonly used mode
The ARIMA model is the most effective in predicting droughts in lead time [84–86].
The ARIMA (Autoregressive Integrated Moving Average) model is a widely utilized
method for both modeling and forecasting time series data [87,88]. It consists of three
components. Firstly, the autoregressive component captures the relationship betw
past and current values. Secondly, the integrated component is employed to transform
data into a stationary form. Lastly, the moving average component captures the relatio
ship between past errors and current values.
Durdu [89] developed the ARIMA and SARIMA models to predict drought in the
Büyük Menderes River Basin using the SPI drought index. The results indicated that th
ARIMA model outperformed the SARIMA model. However, it is important to note that
ARIMA is a linear model that assumes stationarity, meaning it assumes the stat
properties of the data that remain constant over time. Consequently, the ARIMA model
may not adequately capture complex nonlinear relationships or time-varying dynamics
that can be present in certain drought data [90].
Drought Prediction Models
Stochastic
Models Physical Models
Machine
Learning
Models
Deep Learning
Models Hybrid Models
Figure 3. Types of drought models.
4.1. Stochastic Models
These models use historical climate and hydrological data to estimate the probab
of future drought conditions. Two linear stochastic models for forecasting droughts
Autoregressive Integrated Moving Average (ARIMA) and the Multiplicative Seasonal
toregressive Integrated Moving Average (SARIMA), are the most commonly used mod
The ARIMA model is the most effective in predicting droughts in lead time [84–86].
The ARIMA (Autoregressive Integrated Moving Average) model is a widely utilize
method for both modeling and forecasting time series data [87,88]. It consists of three main
components. Firstly, the autoregressive component captures the relationship between
and current values. Secondly, the integrated component is employed to transform the
into a stationary form.Lastly, the moving average component captures the relationshi
between past errors and current values.
Durdu [89] developed the ARIMA and SARIMA models to predict drought in the
Büyük Menderes River Basin using the SPI drought index. The results indicated tha
ARIMA model outperformed the SARIMA model. However, it is important to note th
ARIMA is a linear model that assumes stationarity,meaning it assumes the statistical
properties of the data that remain constant over time.Consequently, the ARIMA model
may not adequately capture complex nonlinear relationships or time-varying dynam
that can be present in certain drought data [90].
The SARIMA (Seasonal Autoregressive Integrated Moving Average) model is an
extension of ARIMA that is used for time series data that exhibits seasonal patterns91].
SARIMA models incorporate additional parameters to account for the periodic and seas
evapotranspiration data, respectively. These two indices are good indicators of short-
drought events [73,74].
All these drought indicators provide meaningful information, but every individu
drought index has its own merits and demerits [75]. So, it will be helpful to use the
composite drought index that takes into account region-based impactful drought indica
to build an accurate and powerful drought prediction system. Many studies proved t
VCI coupled with TCI provides a powerful tool to monitor drought conditions [76–79].
There exists a strong correlation between drought indices such as the TCI, VCI, PCI, N
and the Soil Moisture Condition Index (SMCI). Incorporating knowledge of such ind
in drought prediction studies will improve forecast accuracy [80–82]. Instead of using a
single drought index, the integration of multiple drought indices will improve resul
drought forecasting studies [78,79,82].
4. Drought Models
Various drought prediction models are used to forecast drought conditions and
onset and duration of drought events.The commonly used types of drought prediction
models are categorized into four categories:statistical, physical, machine learning, and
deep learning models, as shown in Figure 3. Caution should be exercised when choos
the method for forecasting drought, as it depends not only on the data series and reg
characteristics [83], but also on the concepts of the models or the algorithms used.Re-
searchers may face difficulties in selecting the most suitable forecasting model from th
range of options available. Furthermore, there is a possibility that the ideal model for
research could be overlooked if they are not familiar with the various models that exi
Sustainability 2023, 15, x FOR PEER REVIEW 7 of 20
All these drought indicators provide meaningful information, but every individual
drought index has its own merits and demerits [75]. So, it will be helpful to use the com
posite drought index that takes into account region-based impactful drought indicators
build an accurate and powerful drought prediction system. Many studies proved that V
coupled with TCI provides a powerful tool to monitor drought conditions [76–79]. Ther
exists a strong correlation between drought indices such as the TCI, VCI, PCI, NDVI, a
the Soil Moisture Condition Index (SMCI). Incorporating knowledge of such indices in
drought prediction studies will improve forecast accuracy [80–82]. Instead of using a s
gle drought index, the integration of multiple drought indices will improve resul
drought forecasting studies [78,79,82].
4. Drought Models
Various drought prediction models are used to forecast drought conditions and the
onset and duration of drought events. The commonly used types of drought prediction
models are categorized into four categories: statistical, physical, machine learning, and
deep learning models, as shown in Figure 3. Caution should be exercised when choosin
the method for forecasting drought, as it depends not only on the data series and regio
characteristics [83], but also on the concepts of the models or the algorithms used. R
searchers may face difficulties in selecting the most suitable forecasting model from th
vast range of options available. Furthermore, there is a possibility that the ideal model
their research could be overlooked if they are not familiar with the various models that
exist.
Figure 3. Types of drought models.
4.1. Stochastic Models
These models use historical climate and hydrological data to estimate the probabil
of future drought conditions. Two linear stochastic models for forecasting droughts, th
Autoregressive Integrated Moving Average (ARIMA) and the Multiplicative Seasonal A
toregressive Integrated Moving Average (SARIMA), are the most commonly used mode
The ARIMA model is the most effective in predicting droughts in lead time [84–86].
The ARIMA (Autoregressive Integrated Moving Average) model is a widely utilized
method for both modeling and forecasting time series data [87,88]. It consists of three
components. Firstly, the autoregressive component captures the relationship betw
past and current values. Secondly, the integrated component is employed to transform
data into a stationary form. Lastly, the moving average component captures the relatio
ship between past errors and current values.
Durdu [89] developed the ARIMA and SARIMA models to predict drought in the
Büyük Menderes River Basin using the SPI drought index. The results indicated that th
ARIMA model outperformed the SARIMA model. However, it is important to note that
ARIMA is a linear model that assumes stationarity, meaning it assumes the stat
properties of the data that remain constant over time. Consequently, the ARIMA model
may not adequately capture complex nonlinear relationships or time-varying dynamics
that can be present in certain drought data [90].
Drought Prediction Models
Stochastic
Models Physical Models
Machine
Learning
Models
Deep Learning
Models Hybrid Models
Figure 3. Types of drought models.
4.1. Stochastic Models
These models use historical climate and hydrological data to estimate the probab
of future drought conditions. Two linear stochastic models for forecasting droughts
Autoregressive Integrated Moving Average (ARIMA) and the Multiplicative Seasonal
toregressive Integrated Moving Average (SARIMA), are the most commonly used mod
The ARIMA model is the most effective in predicting droughts in lead time [84–86].
The ARIMA (Autoregressive Integrated Moving Average) model is a widely utilize
method for both modeling and forecasting time series data [87,88]. It consists of three main
components. Firstly, the autoregressive component captures the relationship between
and current values. Secondly, the integrated component is employed to transform the
into a stationary form.Lastly, the moving average component captures the relationshi
between past errors and current values.
Durdu [89] developed the ARIMA and SARIMA models to predict drought in the
Büyük Menderes River Basin using the SPI drought index. The results indicated tha
ARIMA model outperformed the SARIMA model. However, it is important to note th
ARIMA is a linear model that assumes stationarity,meaning it assumes the statistical
properties of the data that remain constant over time.Consequently, the ARIMA model
may not adequately capture complex nonlinear relationships or time-varying dynam
that can be present in certain drought data [90].
The SARIMA (Seasonal Autoregressive Integrated Moving Average) model is an
extension of ARIMA that is used for time series data that exhibits seasonal patterns91].
SARIMA models incorporate additional parameters to account for the periodic and seas
Paraphrase This Document
Need a fresh take? Get an instant paraphrase of this document with our AI Paraphraser
Sustainability 2023, 15, 11684 8 of 19
patterns in the data.The seasonal autoregressive integrated moving average (SARIMA
models by monitoring the Vegetation Temperature Condition Index (VTCI) [83] and the
Standardized Precipitation Index (SPI) [92], which provides good accuracy to predict
droughts using time series data.
The SARIMAX multivariate model is created by adding parameter covariate variab
(exogenous variables) to SARIMA. Arjmandi Harat [93] performed comparative studies on
SARIMA and SARIMAX with precipitation and potential evapotranspiration as predicto
by monitoring the Reconnaissance Drought Index (RDI).The SARIMAX model yields
higher accuracy as compared to SARIMA.
Both the ARIMA and SARIMA models can be used for drought prediction by model
the historical time series of drought-related variables such as precipitation, temper
potential evapotranspiration,or stream-flow.These models can then be used to make
forecasts of future values of the variable, which can be used to predict drought condi
However,it is important to note that these models are statistical in nature and cann
account for all the complex factors that influence drought, such as land use change
climate change, and do not provide spatial extent of prevailing drought.
4.2. Physical Models
Through the representation of the intricate connections between numerous hydro
cal cycle components using mathematical or physical equations, physical models repl
the behavior of drought. The Soil and Water Assessment Tool (SWAT), the Drought Mo
ing and Forecasting System (DMFS), and the Variable Infiltration Capacity (VIC) mode94]
are a few examples.
The VIC is a macro-scale hydrologic model that simulates the hydrologic cycle
the land surface by using the responses to the water and energy balance equations
model is frequently used to predict droughts [95,96]. By taking into account variables
such as precipitation, evapotranspiration, soil moisture, and runoff, it mimics the w
balance of a basin. As a physically based model that takes into consideration geogra
variation in the landscape, the VIC is especially helpful for forecasting drought in b
basins. This model has demonstrated its effectiveness in numerous river basins [97–100]
by simulating intricate relationships among water, energy, and vegetation through th
of soil properties and meteorological datasets for the grid-based discretization of the
surface [101,102].
Another well-liked hydrologic model for drought forecasting is SWAT (Soil and W
ter Assessment Tool).It models the water balance of a basin similarly to the VIC, but i
also takes into consideration how changes in land use and land cover affect hydrolo
processes [103]. The SWAT is especially helpful for forecasting how land managemen
techniques, including crop rotation and irrigation, would affect the drought.Using the
SWAT and VIC models, Dash [104] evaluated the accuracy of evapotranspiration data for
catchment-scale drought assessment and irrigation planning. The study proved tha
SWAT gives consistent results, whereas the VIC-3L gives underestimated or overestim
results.Kang and Sridhar [105] studied short-term drought forecasting using the SWAT
and VIC models in the United States, where both models produced acceptable foreca
accuracy.Under the changing climate scenario,the SWAT model can also be used for
analyzing the trend of runoff and predicting future hydrologic drought events [106]. The
SWAT is a surface water model that has some demerits, such as it cannot model gr
water flows [107]. The power of the SWAT model can be increased by coupling it with
other techniques such as Copula (SWAT-Copula) [104] and Water Evaluation and Planning
(SWAT-WEAP) [108].
4.3. Machine Learning Models
Machine learning (ML) models are increasingly being used for drought forecas
due to their ability to identify complex patterns and relationships in the data. These mo
use algorithms to learn patterns from historical climate and hydrological data and use
Sustainability 2023, 15, 11684 9 of 19
knowledge to predict future drought conditions.Some commonly used ML models for
drought forecasting are included in the following: Random Forest (RF), Artificial Ne
Networks (ANNs), and Support Vector Machines (SVMs).
4.3.1. Support Vector Machines (SVMs)
SVMs are a type of ML model that can be used for classification or regression t
They work by finding the hyperplane that maximally separates the data points into diffe
classes or predicts the values of a dependent variable. SVMs significantly proved accu
in drought prediction using different kernel functions: the Normalized poly kernel, the
son universal kernel, and the Radial basis kernel [13,109]. The Least Square Support Vector
Machine (LSSVM) also showed an improved performance for the prediction of drou
in eastern Australia by forecasting the SPI in eastern Australia [110]. Achite [111] used a
SVM for forecasting meteorological and hydrological droughts in the Wadi Ouahrane b
located in the northern region of Algeria. They developed four machine learning meth
where the SVM outperform all other techniques with a 0.95 coefficient of determin
SVMs also proved significant accuracy for predicting hydrological droughts [112].
The SVM performance can be increased by preprocessing the input time series
Zhu [113] has shown that using in situ precipitation as input to the SVM gives the be
performance for soil moisture prediction as well as predicting the Soil Water Deficit I
(SWDI) as a drought index.Pham [114] coupled the SVM with a time-series analysis
technique,Singular Spectrum Analysis (SSA),to decompose a time series into a set of
components that capture different types of variability. The SPI3 and SPI6 drought ind
were used as the output in drought forecasting models. This study gives improved res
for the SVM by preprocessing the data using a SSA.
4.3.2. Random Forest (RF)
Random Forest (RF) is an ensemble learning technique that utilizes multiple deci
trees to generate predictions. The construction of each tree involves using a random su
of the available data, and the final prediction is obtained by aggregating the output
all the trees. The RF approach for drought prediction does not impose any constraints
the relationships between the drought index series, and it does not rely on any prede
assumptions regarding the distribution of model errors.
Chen [115] demonstrated that the random forest algorithm is more consistent an
reliable over ARIMA for long- and short-term drought predictions by predicting the SP
the drought index. Dikshit [28] conducted a study to forecast drought at short-term scale
(1 and 3 months) for the New South Wales (NSW) region of Australia using the SPEI a
drought indicator.
The Random Forest algorithm is ideal for analyzing large datasets, making it a suit
choice for tasks involving satellite imagery. One of the main benefits of this algorith
that it creates a tree-based regression function, eliminating the need for scale adjustm
between different input parameters. This is particularly advantageous when working w
multiple input parameters that have different scales. Park [116] developed a Severe Drought
Area Prediction (SDAP) model for short-term drought. They excluded meteorological d
and analyzed various parameters that are responsible for changes in the Soil Moisture
as a drought parameter using the Random Forest (RF) algorithm over the satellite da
4.3.3. Artificial Neural Networks (ANNs)
ANNs are a type of ML model that can be trained to recognize patterns in time se
data and make predictions based on those patterns. Barua [117] developed the Nonlinear
Aggregated Drought Index (NADI) which takes into account overall dryness within
system to identify drought conditions using two ANN forecasting models,namely a
Recursive MultiStep Neural Network (RMSNN) and a Direct MultiStep Neural Netw
(DMSNN), where both models outperformed the ARIMA model by producing improve
predictions.Employing advanced input representations in artificial intelligence-base
⊘ This is a preview!⊘
Do you want full access?
Subscribe today to unlock all pages.
Trusted by 1+ million students worldwide
Sustainability 2023, 15, 11684 10 of 19
solutions can lead to promising success in predicting drought for hydro-meteorolog
variables, especially in intricate geographical scenarios.
Machine learning models for drought forecasting typically require large amoun
of data to train and validate.They can incorporate a variety of data sources, including
meteorological data, remote sensing data, hydrological data, and land-use data. ML mo
have the potential to provide accurate and timely drought forecasts, but they require c
evaluation and validation to ensure their reliability and accuracy.
4.3.4. Deep Learning Models
Deep learning (DL) is a branch of machine learning (ML) that employs deep artifi
neural networks consisting of multiple layers to uncover intricate patterns from the
The DL models have shown promising results for drought prediction by capturing n
linear relationships in the data. The effectiveness of DL models in the context of dro
prediction arises from their capacity to capture intricate patterns and non-linear conne
within the data.
Convolutional Neural Networks (CNNs) are frequently utilized in image recognit
applications, but they can also be used to anticipate droughts using time series data s
as meteorological data. CNNs use filters to identify spatial and temporal patterns in
data and can automatically learn to extract relevant features. The CNN was found
the most computationally efficient model for drought prediction using satellite imag
requiring less time and computational resources for training and prediction [118,119
Recurrent Neural Networks (RNNs) have been developed to analyze sequential d
making them ideal for time series data such as drought indices. RNNs use a hidden s
to maintain information from previous time steps and can learn long-term dependencie
the data.
Long Short-Term Memory (LSTM) Networks are a type of RNN that can recall or fo
information from earlier time steps selectively. LSTMs have been demonstrated to be
successful when dealing with time series data with long-term dependencies [30,39,12
DL models for drought prediction can incorporate a variety of data sources, includ
meteorological data, remote sensing data, hydrological data, and land-use data. DL mo
have shown promising results for drought prediction, outperforming traditional statist
models in some cases. However, DL models can be computationally intensive and req
large amounts of data for training and validation. Careful evaluation and validation
necessary to ensure the reliability and accuracy of DL models for drought prediction.
4.3.5. Hybrid Models
Hybrid models for drought forecasting combine the strengths of different mode
approaches to improve the accuracy and reliability of drought predictions. Hybrid mod
typically consist of two or more models that are integrated to provide more robust
accurate predictions than any one model alone.
The ARIMA method is known for its accurate forecasting and versatility in model
various types of time series data. However, it is limited by its requirement for linear d
which makes it unsuitable for complex non-linear time series modeling [121]. On the other
hand, ANNs are able to effectively address this limitation, although their performance
be variable for time series data that are relatively linear. Khan [122] developed a Wavelet
based hybrid ANN-ARIMA model that combines the strengths of each model to develo
robust model.
Ganguli and Reddy [123] developed ensemble drought prediction models over West-
ern Rajasthan (India) using a SVM–copula approach.They incorporated large scale cli-
matic indices such as ENSO, IOD, and AMO to predict meteorological droughts usi
the Standardized Precipitation Index (SPI). Their ensemble model demonstrated supe
accuracy compared to individual models such as the adaptive neuro-fuzzy interfere
system (ANFIS), multilayer perceptron (MLP), artificial neural networks (ANN), supp
Paraphrase This Document
Need a fresh take? Get an instant paraphrase of this document with our AI Paraphraser
Sustainability 2023, 15, 11684 11 of 19
vector machine (SVM), autoregressive integrated moving average (ARIMA), and AN
models [124].
Hybrid models, such as the Dragonfly Algorithm-SVM [125] and the Nomadic People
Algorithm (NPA) in conjunction with SVM, ANFIS, MLP, and ANN [126], outperformed
the individual models mentioned previously. These hybrid models exhibit an enhanc
performance in drought prediction, providing better accuracy and more reliable estima
of uncertainty associated with drought forecasts.
Furthermore, wavelets, which are mathematical functions capable of analyzing sig
across time, frequency, and scale domains, can also be employed in drought prediction
WSVM approach applies a wavelet transform to the input data to decompose it into diff
frequency components. These components are then used as inputs to an SVM algori
which is trained to classify or predict the target variable.The wavelet-support vector
machine (WSVM) is a machine learning technique that combines wavelet analysis a
support vector machine (SVM) algorithms to improve the accuracy of drought predict
Komasi [127] used the WSVM for drought prediction using the Standardized Precipitatio
Index (SPI).
A hybrid intelligent model called LSTM-ELM combines the power of a long sho
term memory (LSTM) neural network with an extreme learning machine (ELM) that
effectively handle the nonlinearity and complexity of meteorological drought forecast
The hybrid LSTM-ELM model outperforms the LSTM and ELM models in terms of accu
and robustness [128].
Hybrid models for drought forecasting can provide more accurate and reliable
dictions than any one model alone, but they require careful evaluation and validatio
ensure their reliability and accuracy.The choice of models to combine, the weighting of
individual models, and the integration method all have important implications for th
accuracy and reliability of the final predictions.
5. Result and Discussion
The evolving climate patterns, characterized by the alterations in temperature,
cipitation, and extreme weather occurrences, have substantial implications for foreca
droughts. The variability in climate data due to climate change poses challenges for t
tional statistical models. Various drought prediction techniques are listed in Table 2.
Table 2, it is clear that machine learning and deep learning algorithms are inherently a
able and can account for non-linear relationships, making them well-suited for captur
and predicting complex climate patterns associated with droughts under the chang
climatic conditions. Leveraging machine learning and deep learning methods enables
capture and analysis of intricate connections between the climate variables and the ons
droughts amidst shifting climate conditions.
The incorporation of climatic indices that play a significant role in the changing
climate, namely ENSO (El Niño–Southern Oscillation) and IOD (Indian Ocean Dipole), h
demonstrated its critical role in enhancing the effectiveness of drought prediction mo
By utilizing these indices as predictors, valuable information regarding the macro-s
climate patterns influencing regional and global drought dynamics can be obtained. Th
strong correlations are observed between ENSO, IOD, and drought occurrences.When
these indices were integrated into drought prediction models,it resulted in enhanced
accuracy and reliability [47–51].
The selection of a suitable model for drought prediction depends on various fac
The availability of the data, desired level of accuracy, and intended use of the predict
play a crucial role in determining the appropriate model. Each model has its own stren
and weaknesses.No single model can be deemed as the best choice for all situations
Ensemble models, a combination of different model types, can be employed to enhance
accuracy and reliability of drought predictions. The complexity of drought, along with
relationship with the input variables and data characteristics, emphasizes the importa
of considering periodicity in drought forecasting. Furthermore, the study findings indi
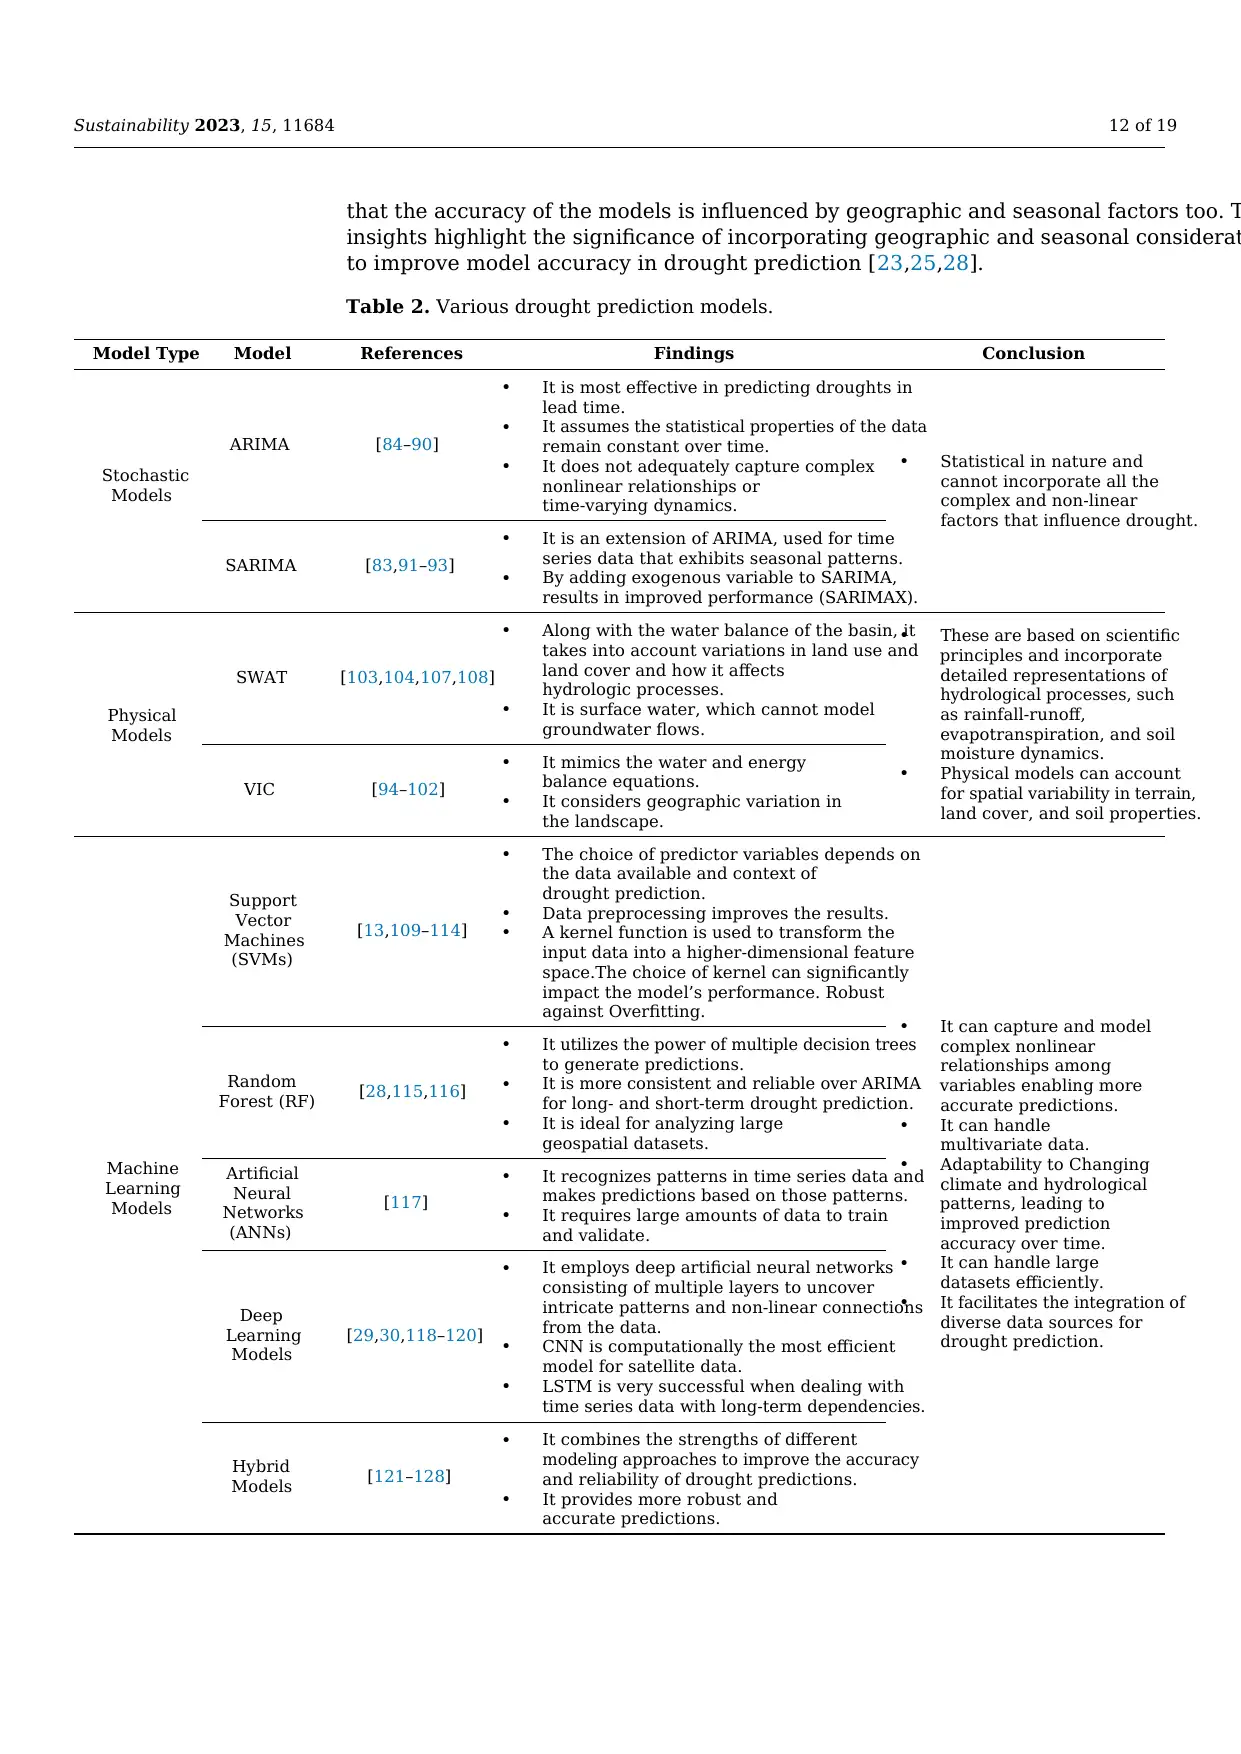
Sustainability 2023, 15, 11684 12 of 19
that the accuracy of the models is influenced by geographic and seasonal factors too. T
insights highlight the significance of incorporating geographic and seasonal considerat
to improve model accuracy in drought prediction [23,25,28].
Table 2. Various drought prediction models.
Model Type Model References Findings Conclusion
Stochastic
Models
ARIMA [84–90]
• It is most effective in predicting droughts in
lead time.
• It assumes the statistical properties of the data
remain constant over time.
• It does not adequately capture complex
nonlinear relationships or
time-varying dynamics.
• Statistical in nature and
cannot incorporate all the
complex and non-linear
factors that influence drought.
SARIMA [83,91–93]
• It is an extension of ARIMA, used for time
series data that exhibits seasonal patterns.
• By adding exogenous variable to SARIMA,
results in improved performance (SARIMAX).
Physical
Models
SWAT [103,104,107,108]
• Along with the water balance of the basin, it
takes into account variations in land use and
land cover and how it affects
hydrologic processes.
• It is surface water, which cannot model
groundwater flows.
• These are based on scientific
principles and incorporate
detailed representations of
hydrological processes, such
as rainfall-runoff,
evapotranspiration, and soil
moisture dynamics.
• Physical models can account
for spatial variability in terrain,
land cover, and soil properties.
VIC [94–102]
• It mimics the water and energy
balance equations.
• It considers geographic variation in
the landscape.
Machine
Learning
Models
Support
Vector
Machines
(SVMs)
[13,109–114]
• The choice of predictor variables depends on
the data available and context of
drought prediction.
• Data preprocessing improves the results.
• A kernel function is used to transform the
input data into a higher-dimensional feature
space.The choice of kernel can significantly
impact the model’s performance. Robust
against Overfitting. • It can capture and model
complex nonlinear
relationships among
variables enabling more
accurate predictions.
• It can handle
multivariate data.
• Adaptability to Changing
climate and hydrological
patterns, leading to
improved prediction
accuracy over time.
• It can handle large
datasets efficiently.
• It facilitates the integration of
diverse data sources for
drought prediction.
Random
Forest (RF) [28,115,116]
• It utilizes the power of multiple decision trees
to generate predictions.
• It is more consistent and reliable over ARIMA
for long- and short-term drought prediction.
• It is ideal for analyzing large
geospatial datasets.
Artificial
Neural
Networks
(ANNs)
[117]
• It recognizes patterns in time series data and
makes predictions based on those patterns.
• It requires large amounts of data to train
and validate.
Deep
Learning
Models
[29,30,118–120]
• It employs deep artificial neural networks
consisting of multiple layers to uncover
intricate patterns and non-linear connections
from the data.
• CNN is computationally the most efficient
model for satellite data.
• LSTM is very successful when dealing with
time series data with long-term dependencies.
Hybrid
Models [121–128]
• It combines the strengths of different
modeling approaches to improve the accuracy
and reliability of drought predictions.
• It provides more robust and
accurate predictions.
⊘ This is a preview!⊘
Do you want full access?
Subscribe today to unlock all pages.
Trusted by 1+ million students worldwide
1 out of 19
Your All-in-One AI-Powered Toolkit for Academic Success.
+13062052269
info@desklib.com
Available 24*7 on WhatsApp / Email
![[object Object]](/_next/static/media/star-bottom.7253800d.svg)
Unlock your academic potential
Copyright © 2020–2026 A2Z Services. All Rights Reserved. Developed and managed by ZUCOL.