Financial Analysis: Dunelm Plc and Halfords Group Plc (2016-2017)
VerifiedAdded on 2023/03/23
|11
|523
|48
Report
AI Summary
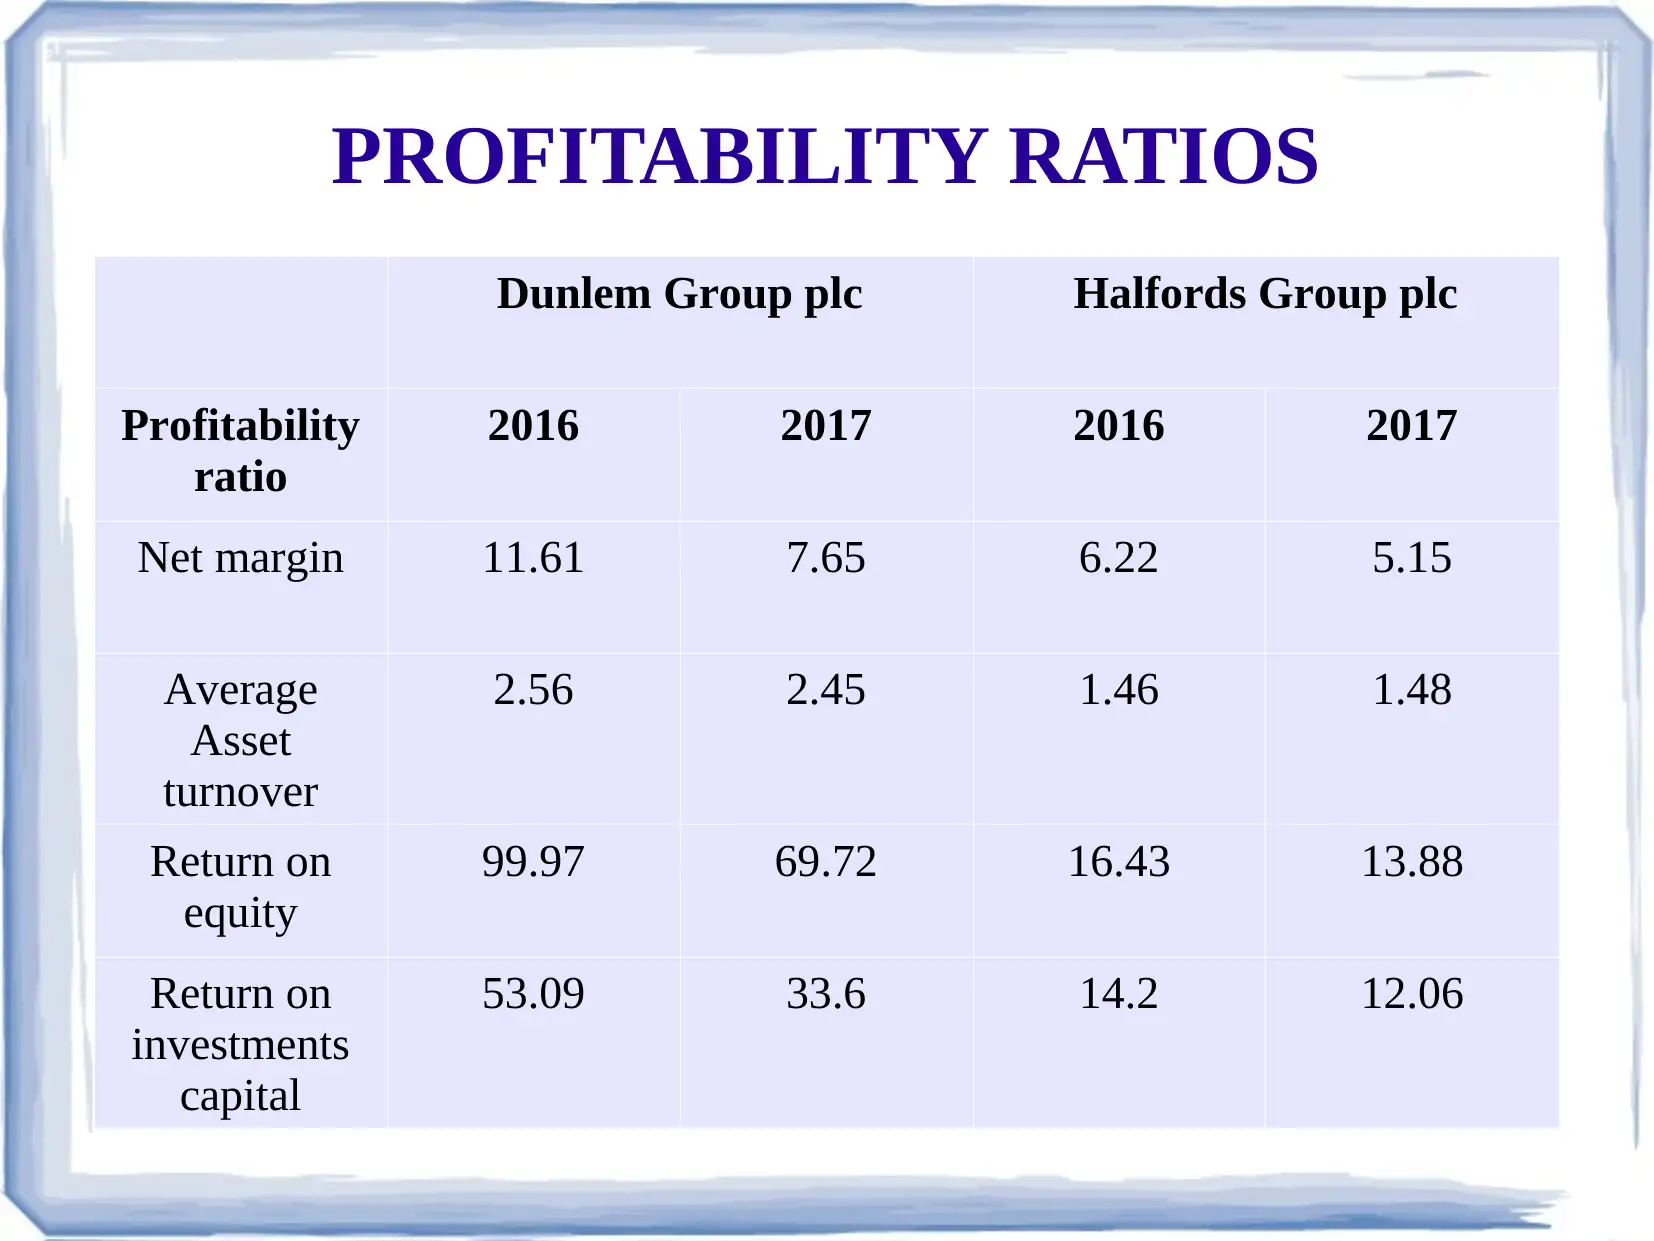
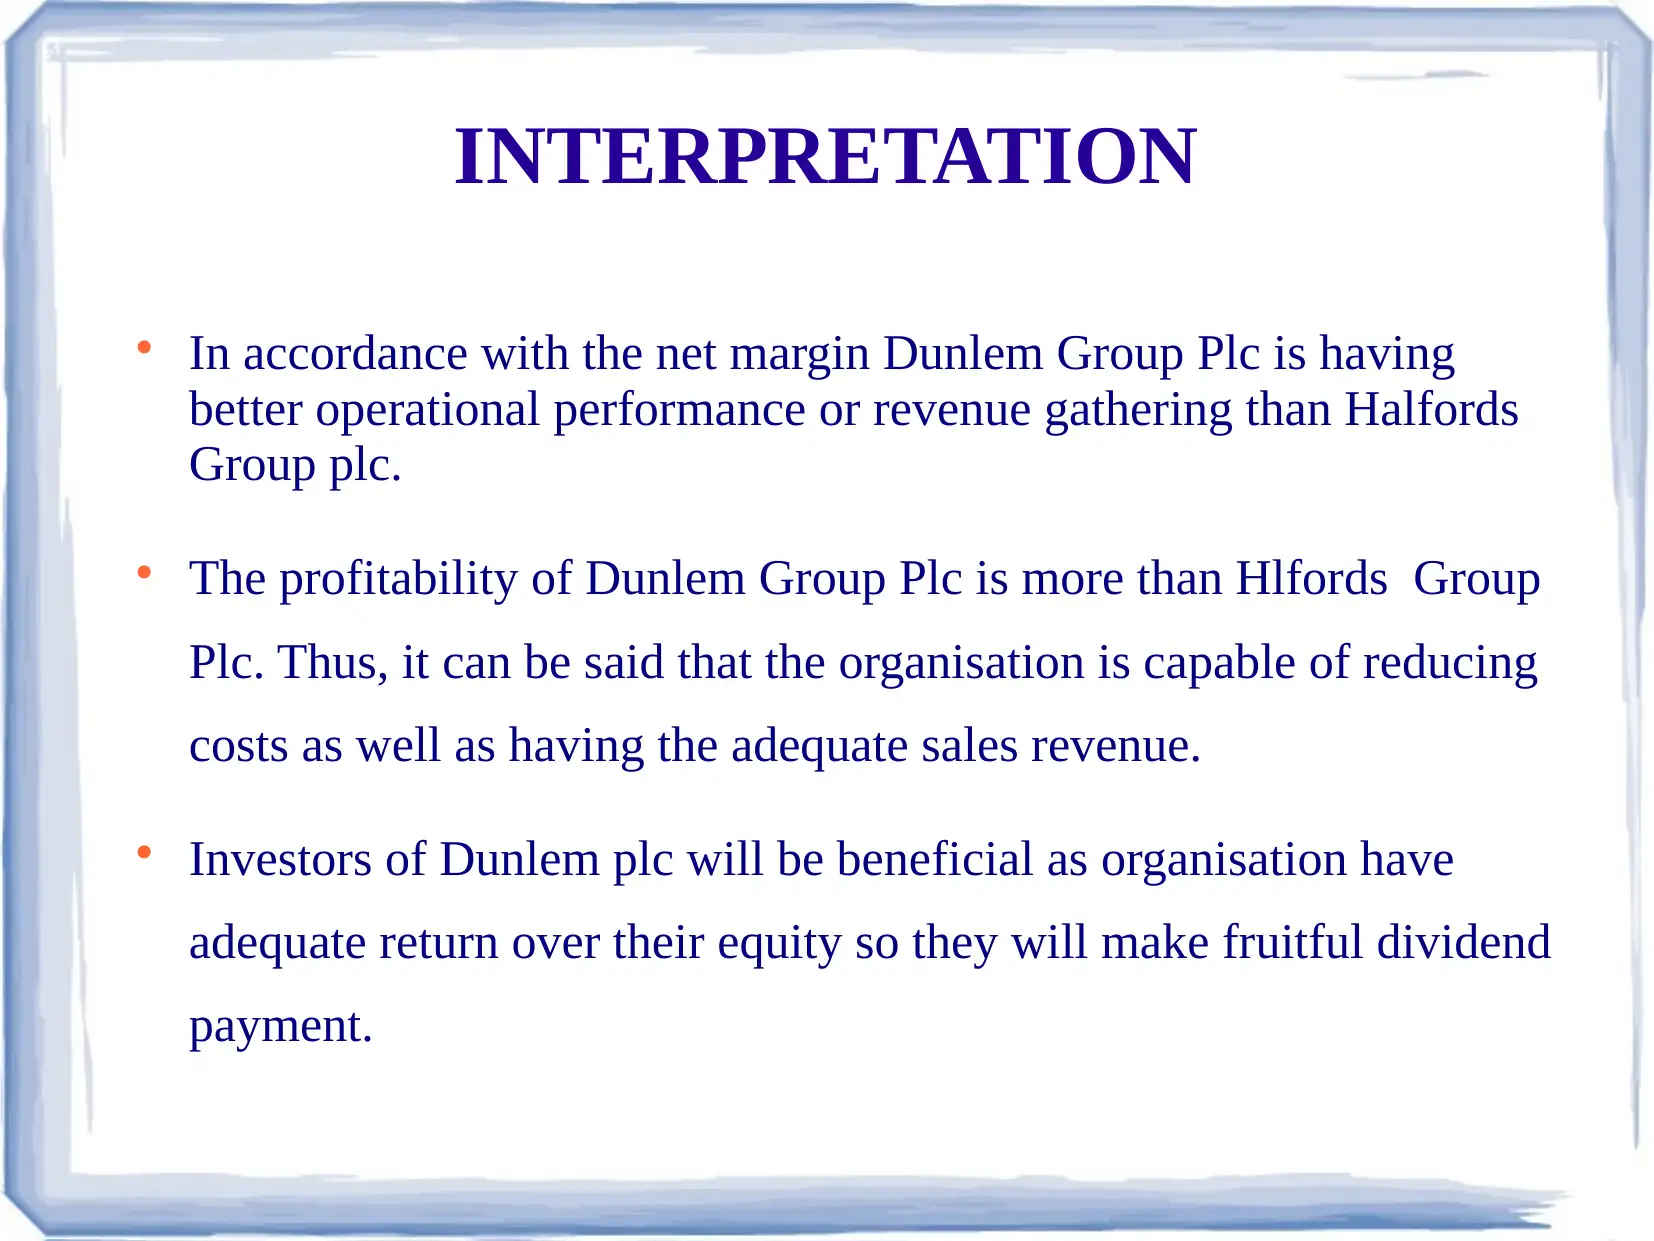
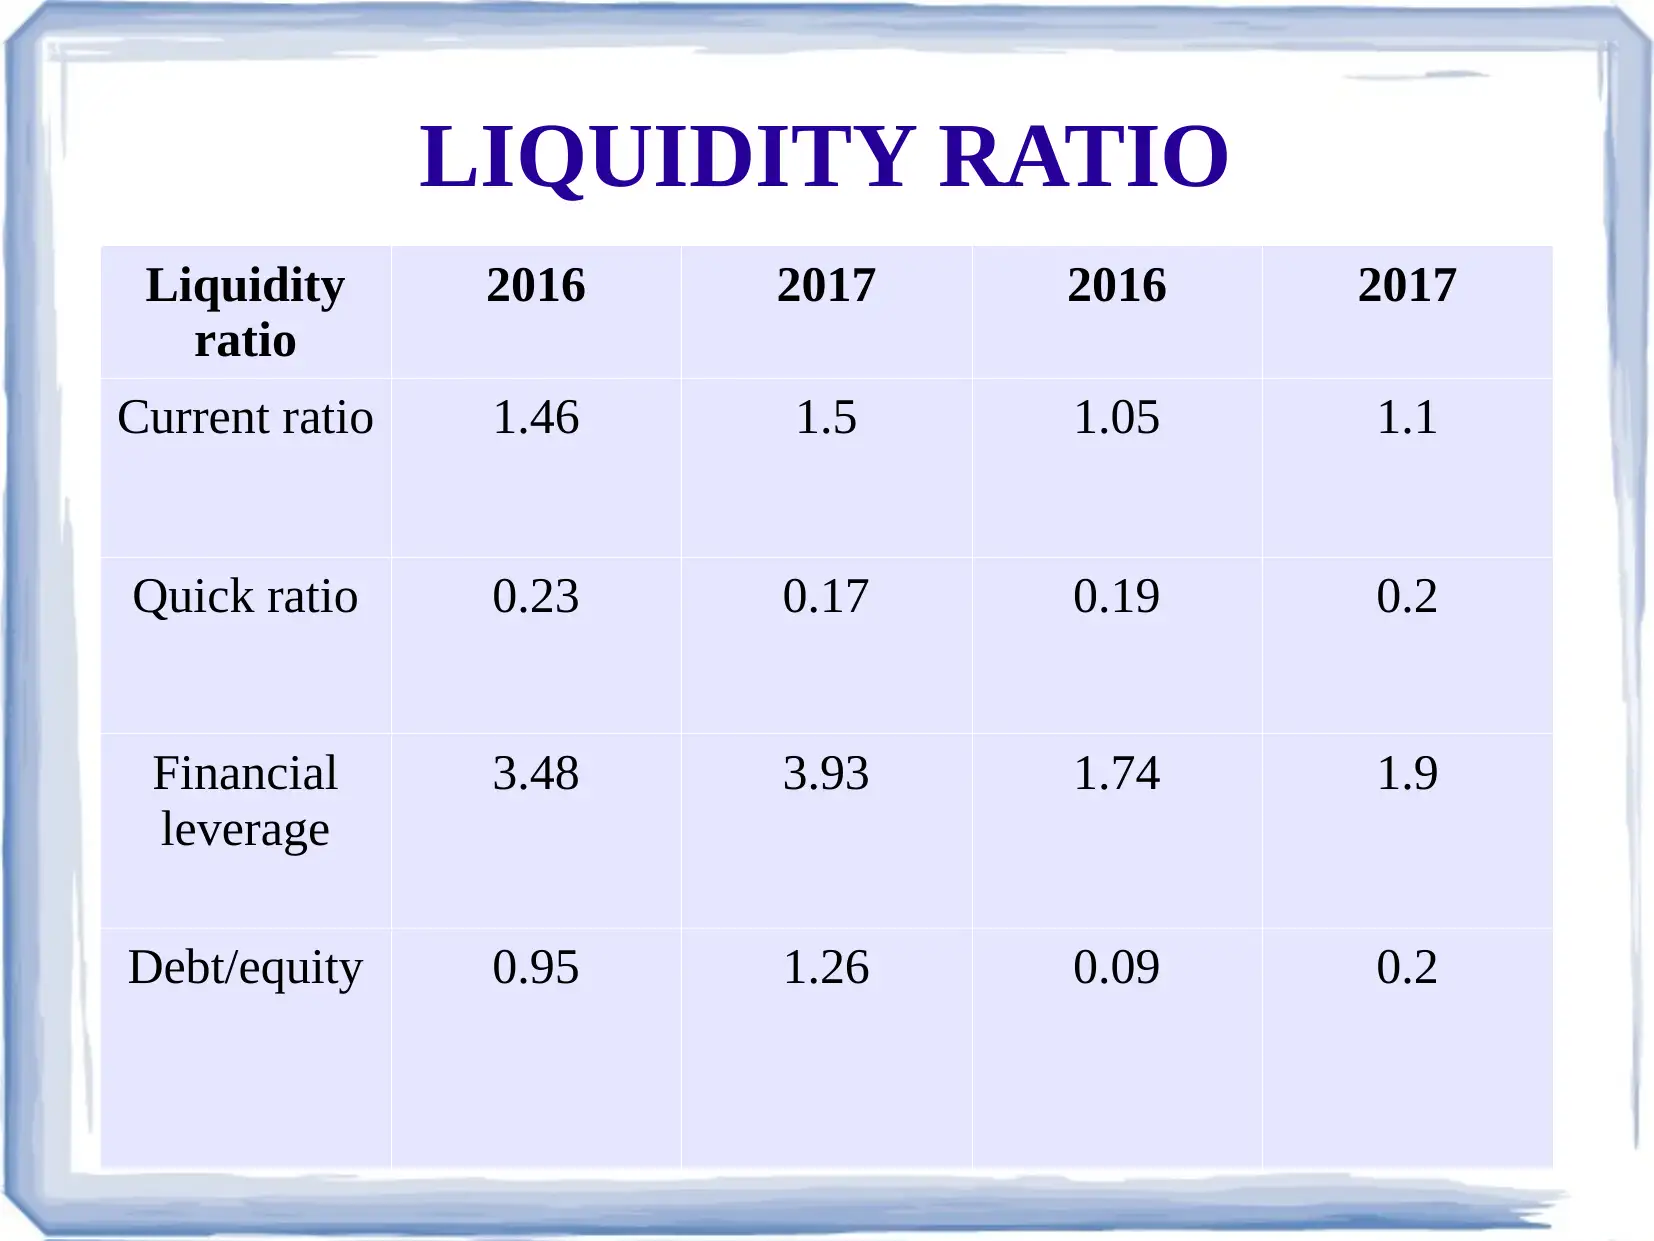
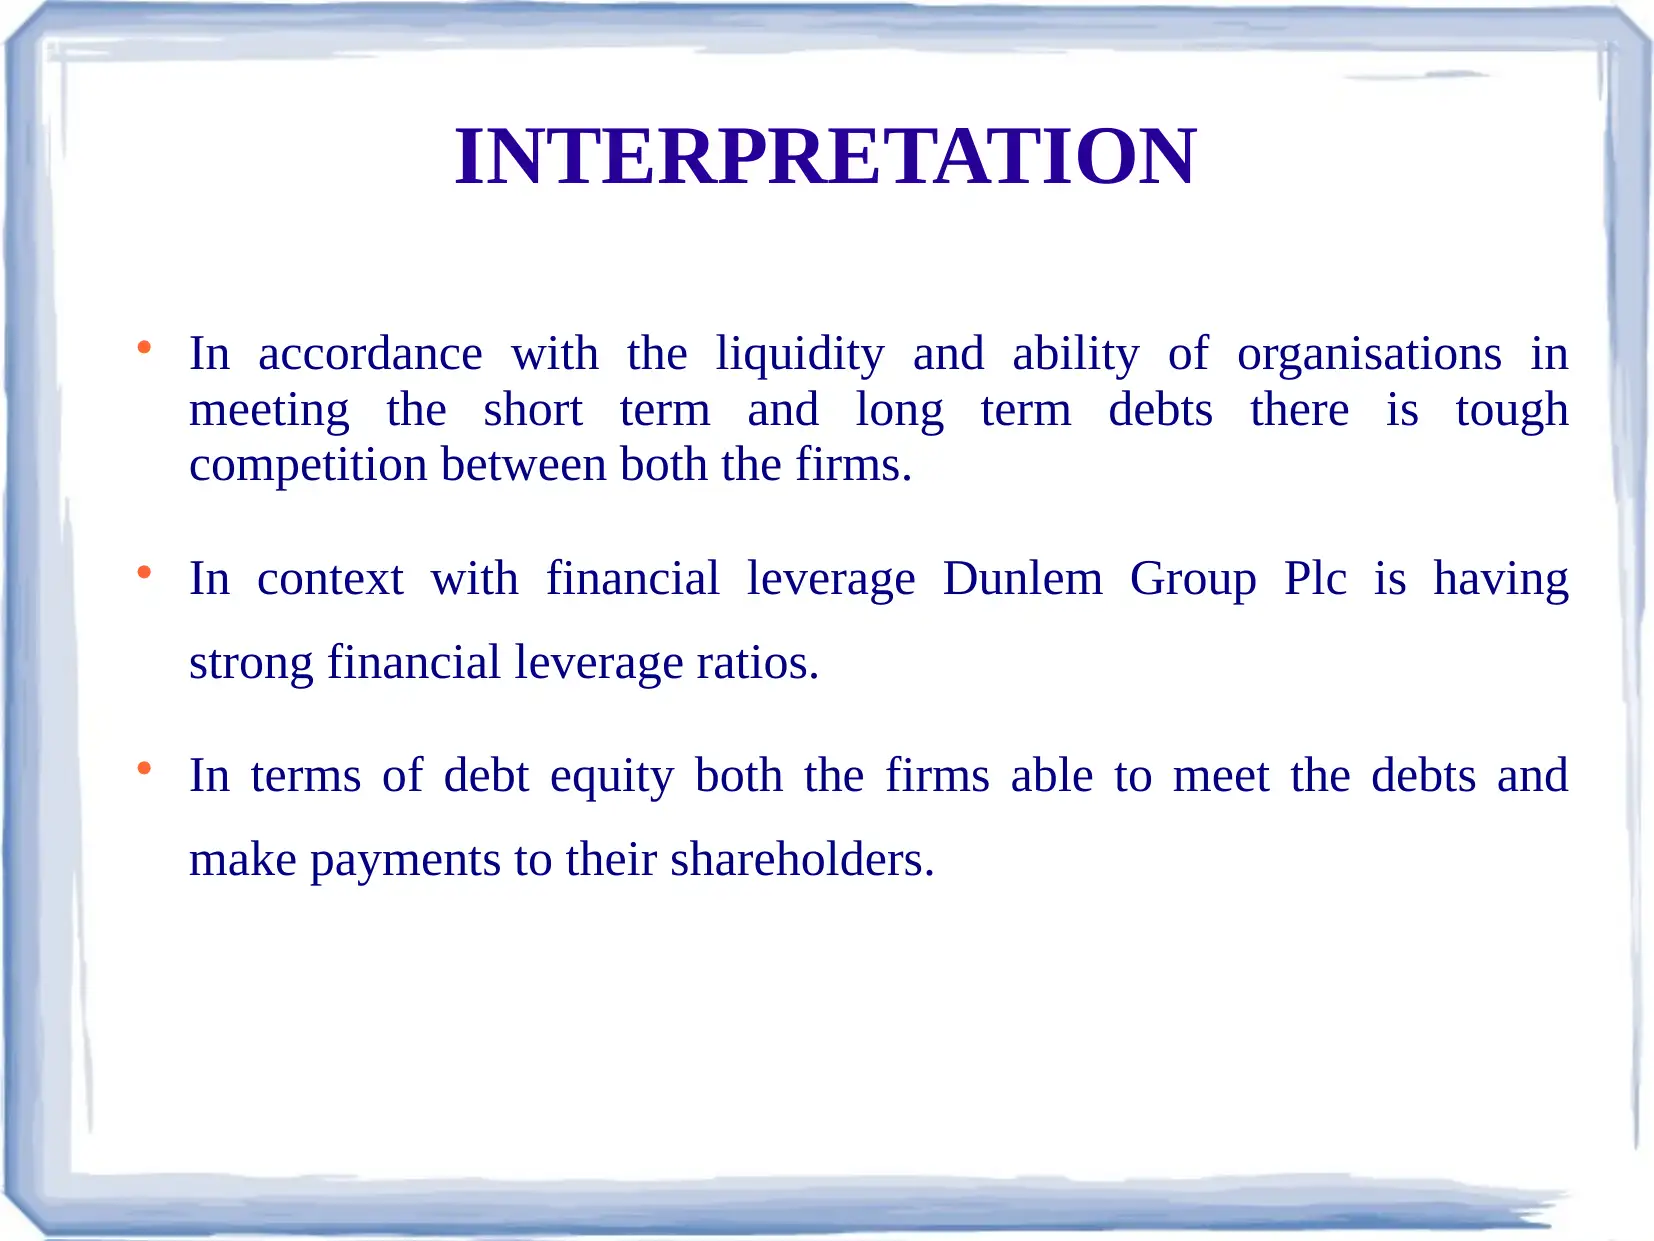
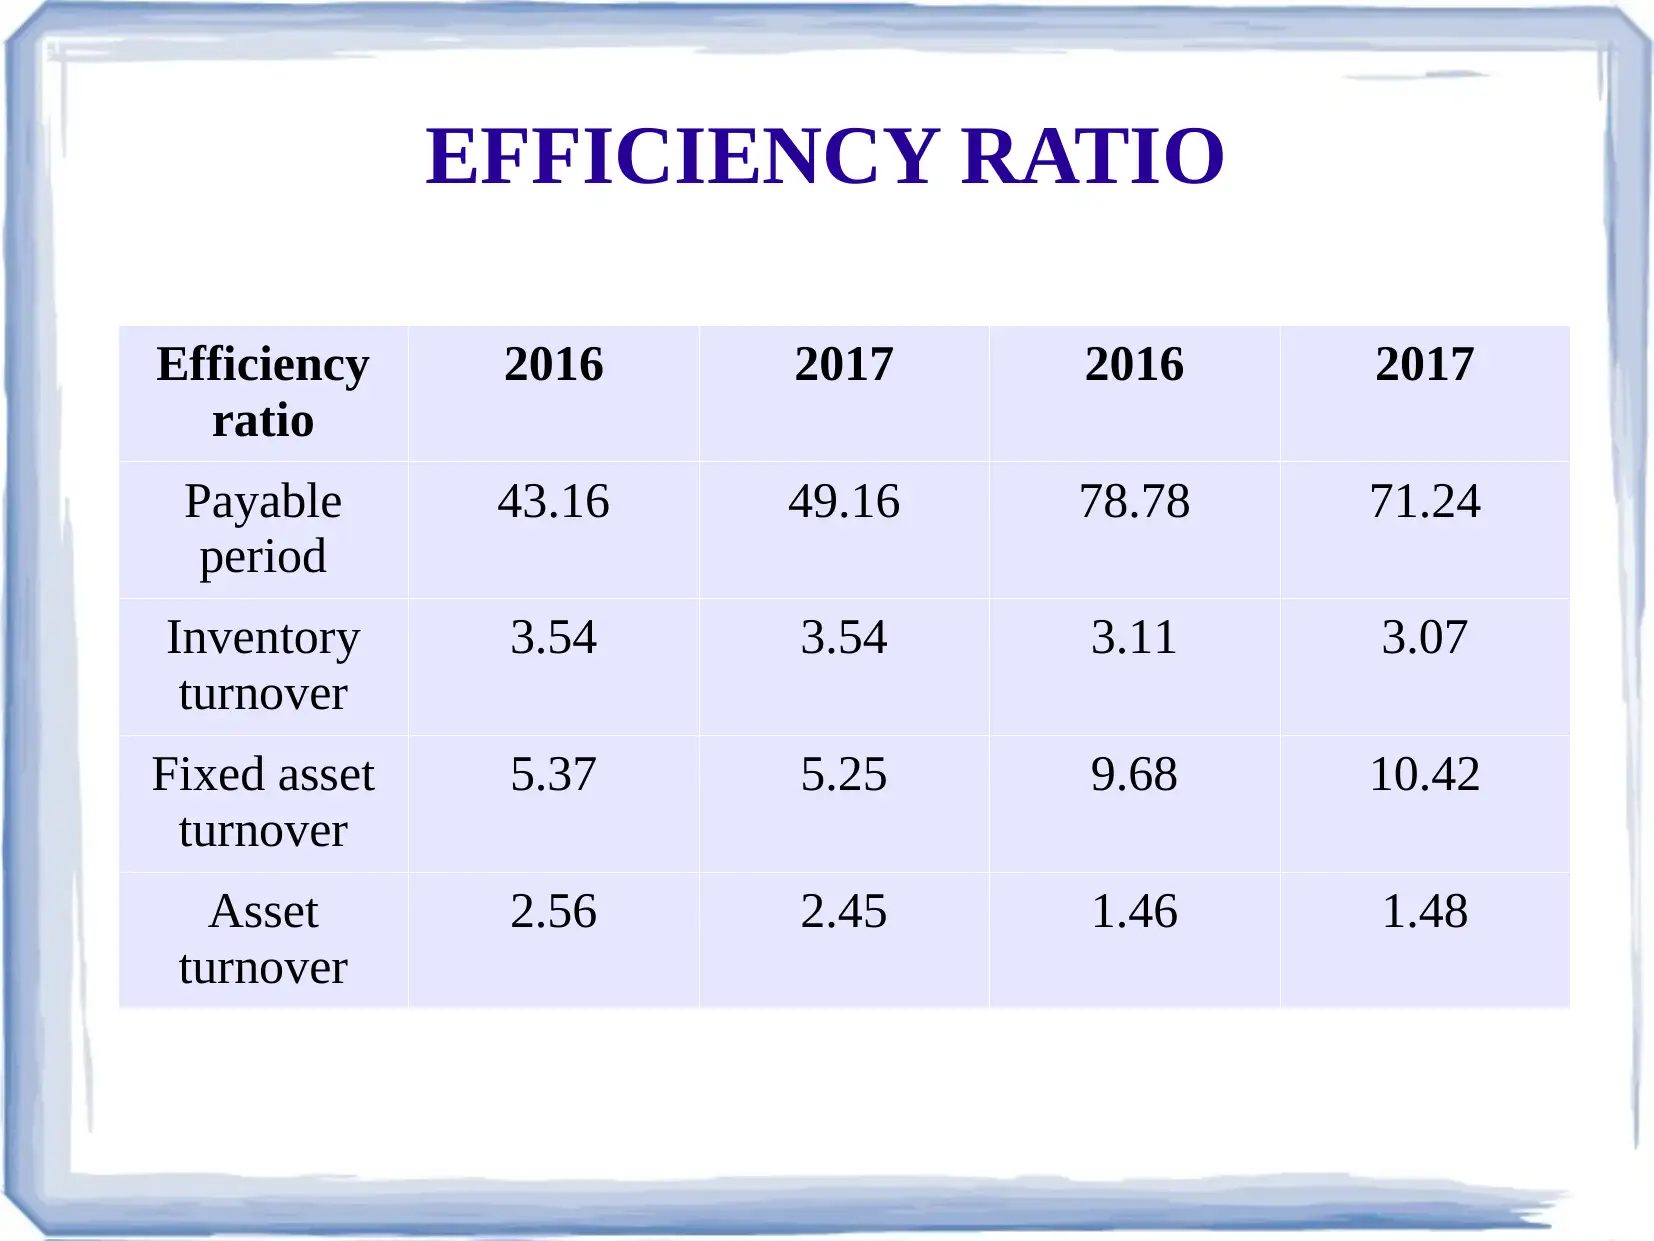
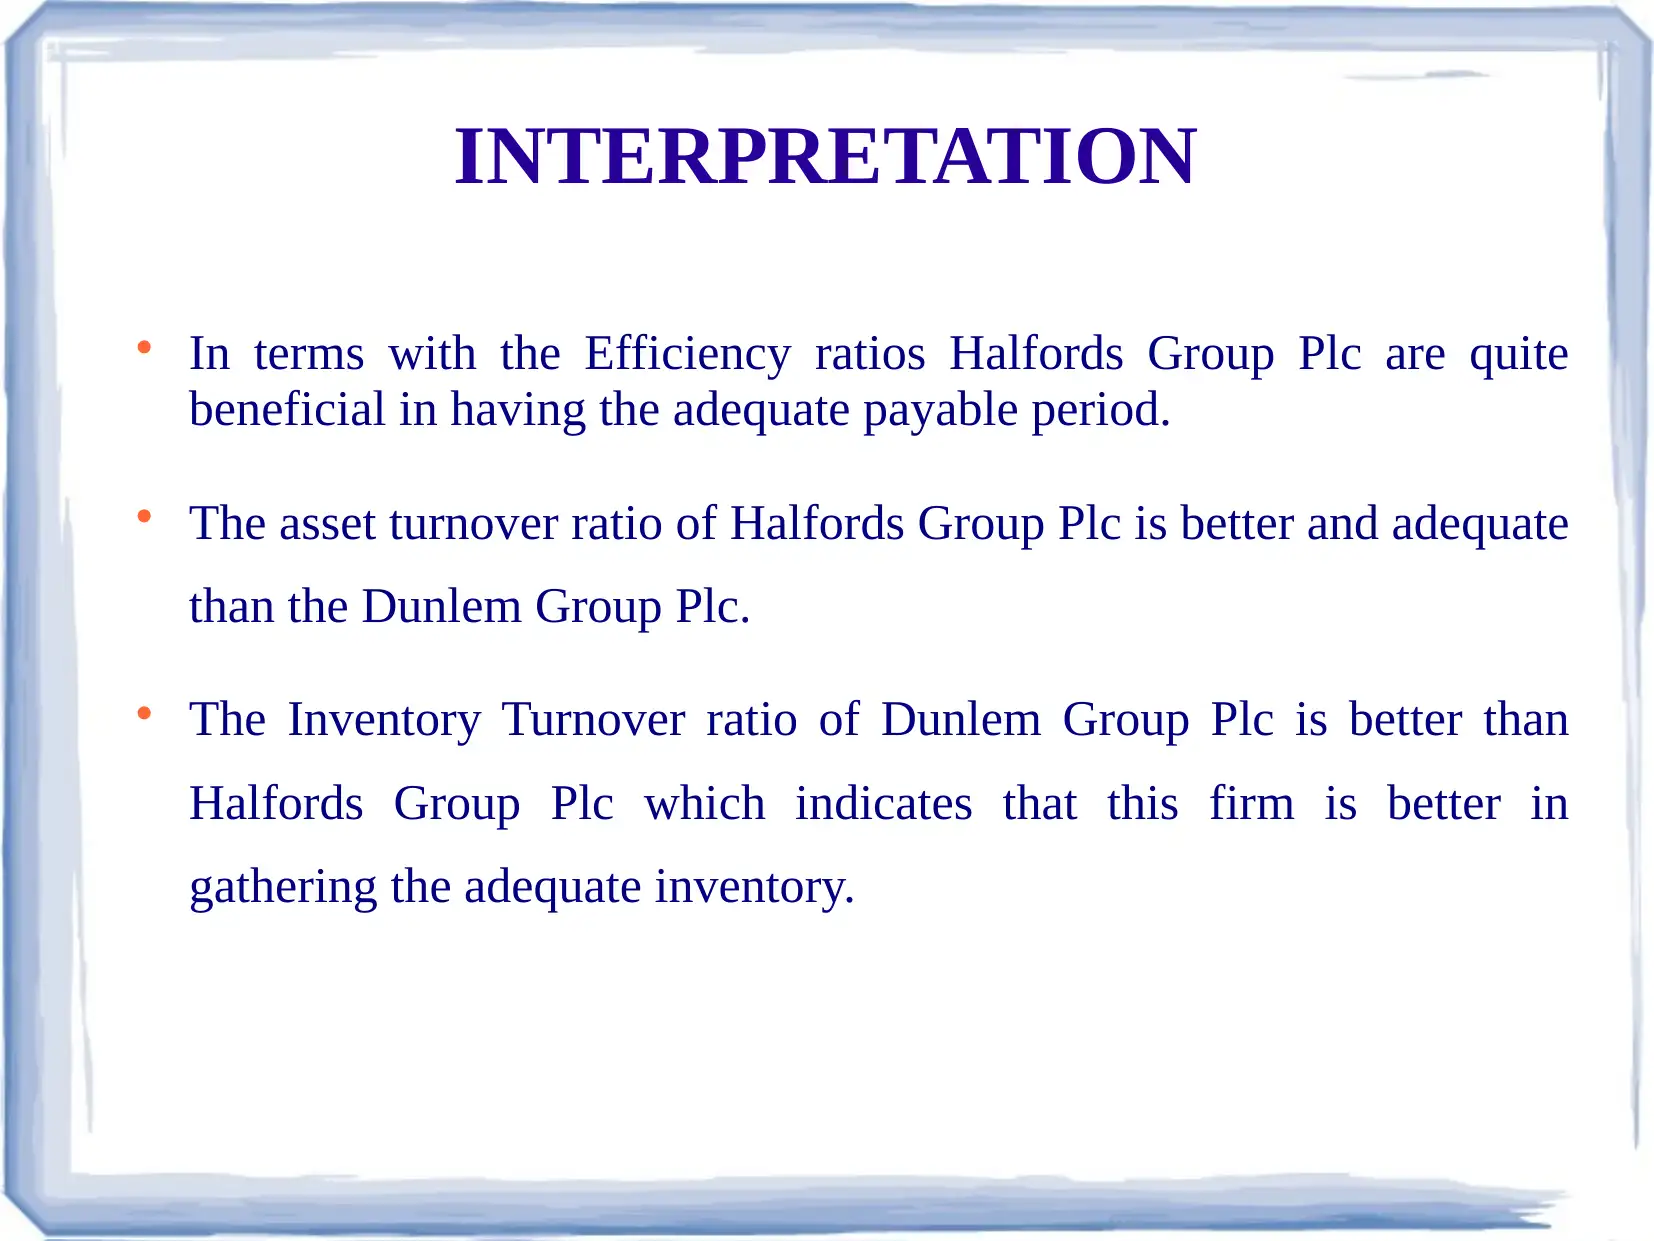
This report offers a comparative financial analysis of Dunelm Group Plc and Halfords Group Plc, focusing on their financial performance between 2016 and 2017. The analysis delves into profitability ratios, including net margin, asset turnover, return on equity, and return on investment capital, revealing Dunelm's superior operational performance and profitability. Liquidity ratios, such as current ratio, quick ratio, financial leverage, and debt/equity, are examined to assess the firms' abilities to meet short-term and long-term debts, with Dunelm displaying stronger financial leverage. Efficiency ratios, encompassing payable period, inventory turnover, fixed asset turnover, and asset turnover, are also scrutinized, highlighting Halfords' advantage in payable periods while Dunelm excels in inventory turnover. The conclusion suggests that Dunelm Group Plc is a more favorable investment due to its profitability and revenue generation capabilities, supported by cited references. This analysis is designed to help students understand financial statement analysis and company performance comparison.


1 out of 11
Related Documents


Your All-in-One AI-Powered Toolkit for Academic Success.
+13062052269
info@desklib.com
Available 24*7 on WhatsApp / Email
![[object Object]](/_next/static/media/star-bottom.7253800d.svg)
Copyright © 2020–2026 A2Z Services. All Rights Reserved. Developed and managed by ZUCOL.