Analysis of Financial Performance: Dunelm Group Plc and Halfords Group
VerifiedAdded on 2020/07/22
|19
|3286
|304
Report
AI Summary
This report conducts a financial statement analysis comparing the performance of Dunelm Group Plc and Halfords Group Plc. It begins with an introduction to financial statement analysis and its importance for stakeholders. The report then performs a SWOT analysis for both companies, examining their internal strengths and weaknesses, as well as external opportunities and threats. The core of the report involves a detailed ratio analysis, including profitability, liquidity, solvency, and efficiency ratios, calculated for both companies over two years. The analysis includes interpretation of the results, comparing the financial health and performance of Dunelm and Halfords. The report concludes by summarizing the key findings and comparing the financial positions of both companies.
Financial Statement
Analysis
Analysis
Paraphrase This Document
Need a fresh take? Get an instant paraphrase of this document with our AI Paraphraser
TABLE OF CONTENTS
INTRODUCTION...........................................................................................................................1
TASK...............................................................................................................................................1
Analyzing financial performance of Dunelmand Halfords Group Plcwith the help of internal
and external factors......................................................................................................................1
CONCLUSION..............................................................................................................................15
REFERENCES..............................................................................................................................16
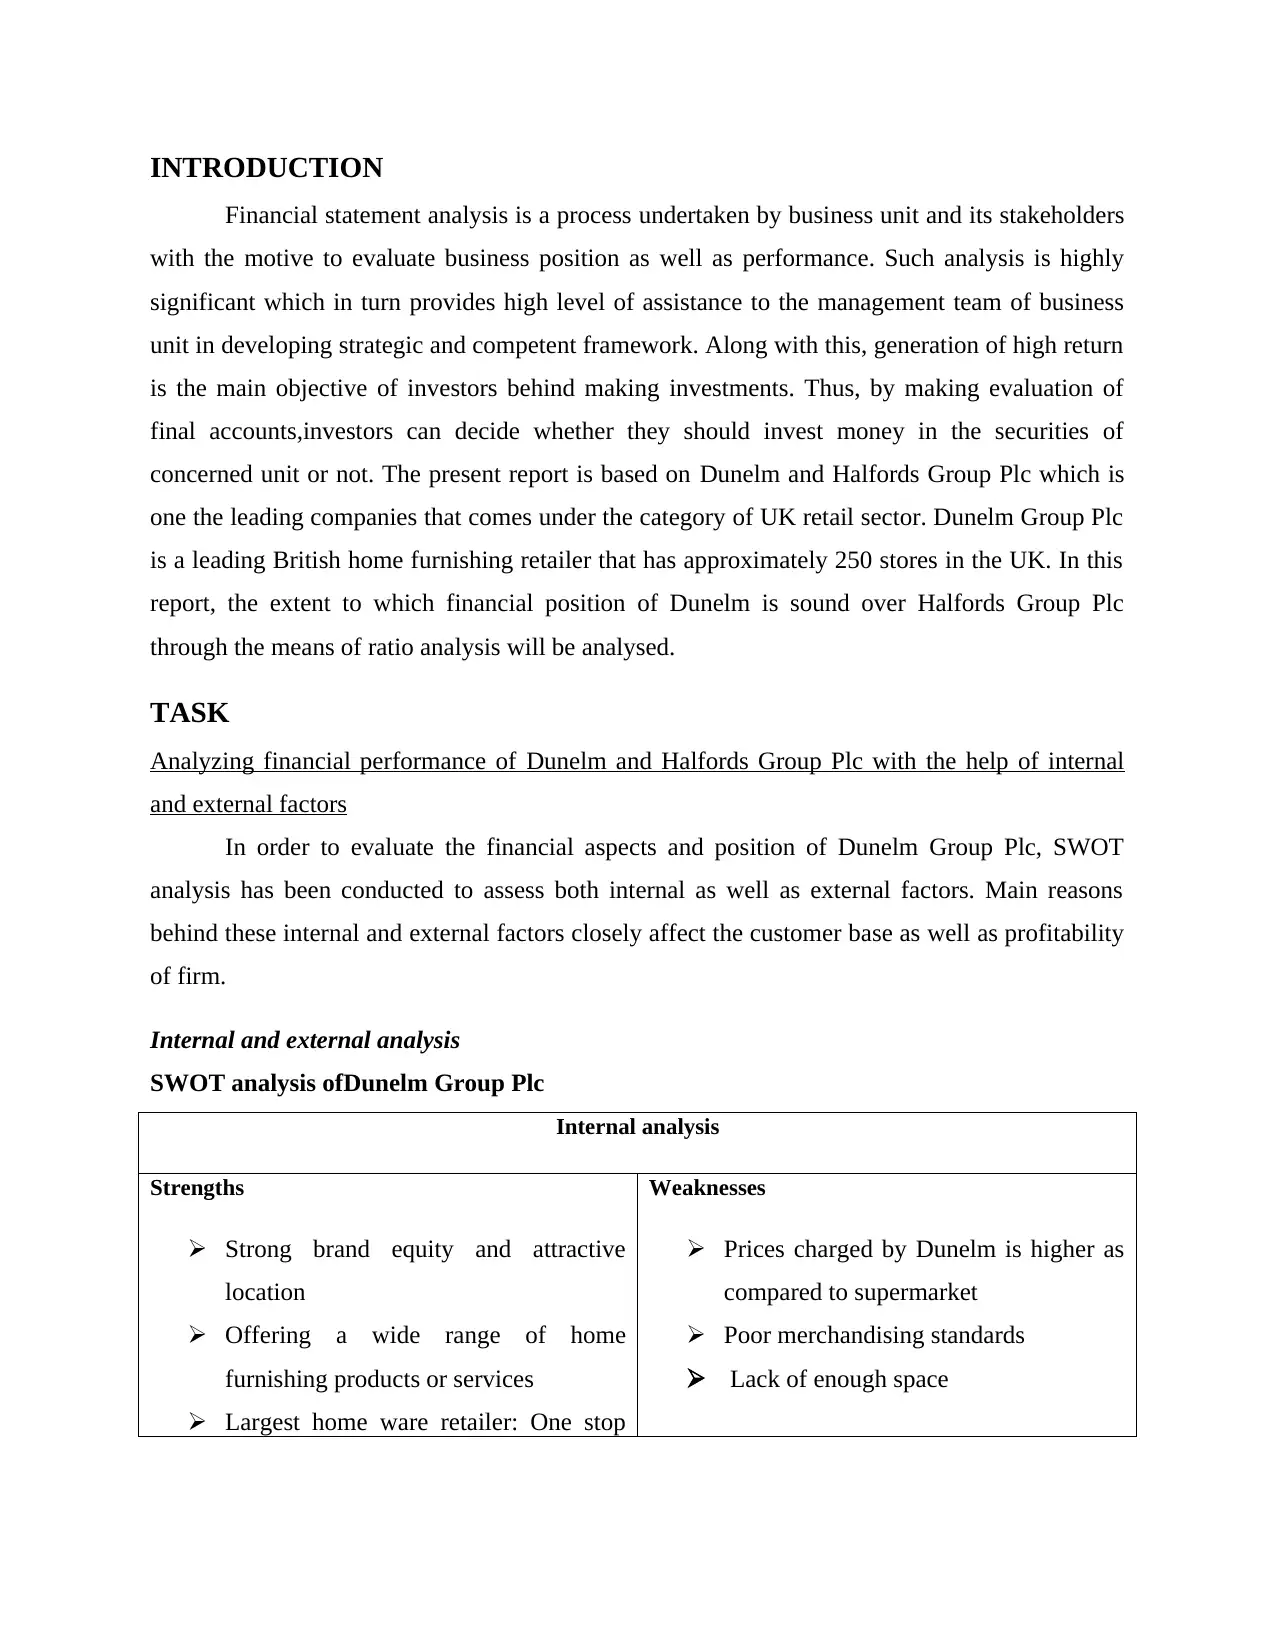
INTRODUCTION
Financial statement analysis is a process undertaken by business unit and its stakeholders
with the motive to evaluate business position as well as performance. Such analysis is highly
significant which in turn provides high level of assistance to the management team of business
unit in developing strategic and competent framework. Along with this, generation of high return
is the main objective of investors behind making investments. Thus, by making evaluation of
final accounts,investors can decide whether they should invest money in the securities of
concerned unit or not. The present report is based on Dunelm and Halfords Group Plc which is
one the leading companies that comes under the category of UK retail sector. Dunelm Group Plc
is a leading British home furnishing retailer that has approximately 250 stores in the UK. In this
report, the extent to which financial position of Dunelm is sound over Halfords Group Plc
through the means of ratio analysis will be analysed.
TASK
Analyzing financial performance of Dunelm and Halfords Group Plc with the help of internal
and external factors
In order to evaluate the financial aspects and position of Dunelm Group Plc, SWOT
analysis has been conducted to assess both internal as well as external factors. Main reasons
behind these internal and external factors closely affect the customer base as well as profitability
of firm.
Internal and external analysis
SWOT analysis ofDunelm Group Plc
Internal analysis
Strengths
Strong brand equity and attractive
location
Offering a wide range of home
furnishing products or services
Largest home ware retailer: One stop
Weaknesses
Prices charged by Dunelm is higher as
compared to supermarket
Poor merchandising standards
Lack of enough space
⊘ This is a preview!⊘
Do you want full access?
Subscribe today to unlock all pages.
Trusted by 1+ million students worldwide
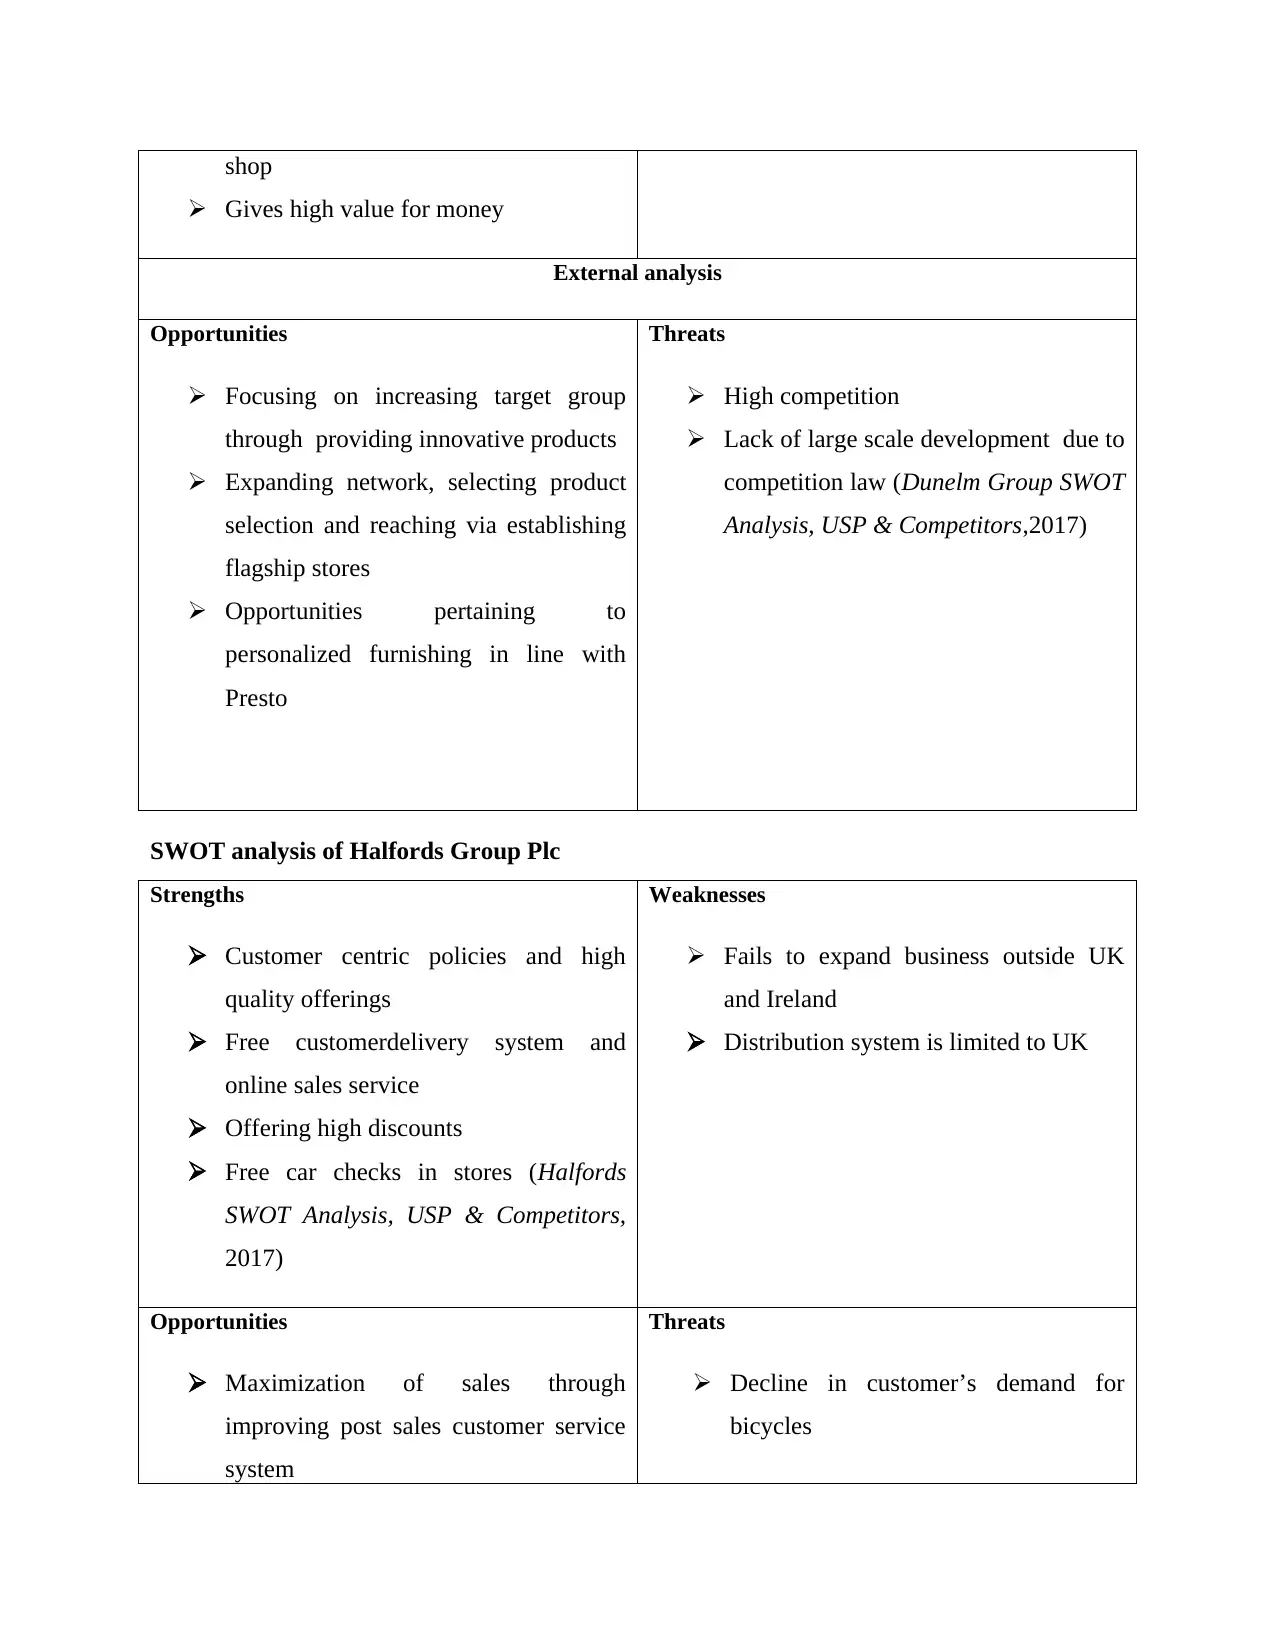
shop
Gives high value for money
External analysis
Opportunities
Focusing on increasing target group
through providing innovative products
Expanding network, selecting product
selection and reaching via establishing
flagship stores
Opportunities pertaining to
personalized furnishing in line with
Presto
Threats
High competition
Lack of large scale development due to
competition law (Dunelm Group SWOT
Analysis, USP & Competitors,2017)
SWOT analysis of Halfords Group Plc
Strengths
Customer centric policies and high
quality offerings
Free customerdelivery system and
online sales service
Offering high discounts
Free car checks in stores (Halfords
SWOT Analysis, USP & Competitors,
2017)
Weaknesses
Fails to expand business outside UK
and Ireland
Distribution system is limited to UK
Opportunities
Maximization of sales through
improving post sales customer service
system
Threats
Decline in customer’s demand for
bicycles
Paraphrase This Document
Need a fresh take? Get an instant paraphrase of this document with our AI Paraphraser
Creation of efficient distribution system
Explore business operations in
developing countries
Intense competition
Decreasing purchasing power of
customers due to financial crisis
Financial statement analysis
Methodology: To analyze and interpret financial statements,ratio analysis tool has been
selected as well as applied. Such tool assists in summarizing and evaluating the position of firm
from various perspectives such as profitability, liquidity, solvency, efficiency and investment. By
making assessment of all such aspects, one can easily determine whether financial condition of
the concerned organization is good or not (Fabregat-Sanjuan, Ferrando and De la Flor,
2015).Further, by using the tool of ratio analysis,firm can measure performance over the years
and in against to the rival firms. However, on the critical note, it can be presented thatdifferent
business units undertake various rules while preparing final accounts (Fraser, Bhaumik and
Wright, 2015). This is one of the main aspects which in turn closely influences the significance
of such methods and creates issue in comparing the performance of different firms.
Ratio analysis of Dunelm and Halfords Group Plc is as follows:
Profitability ratios
Dunelm Group
Plc
Halfords
Group Plc
Particulars Formul
a
2016 2017 2016 2017
Gross profit 439 467 543 559
Net profit 102 73 64 56
Sales
revenue
881
(Financial
statements
of
Dunelm
Group
PLC,
2017)
956 1022 1095
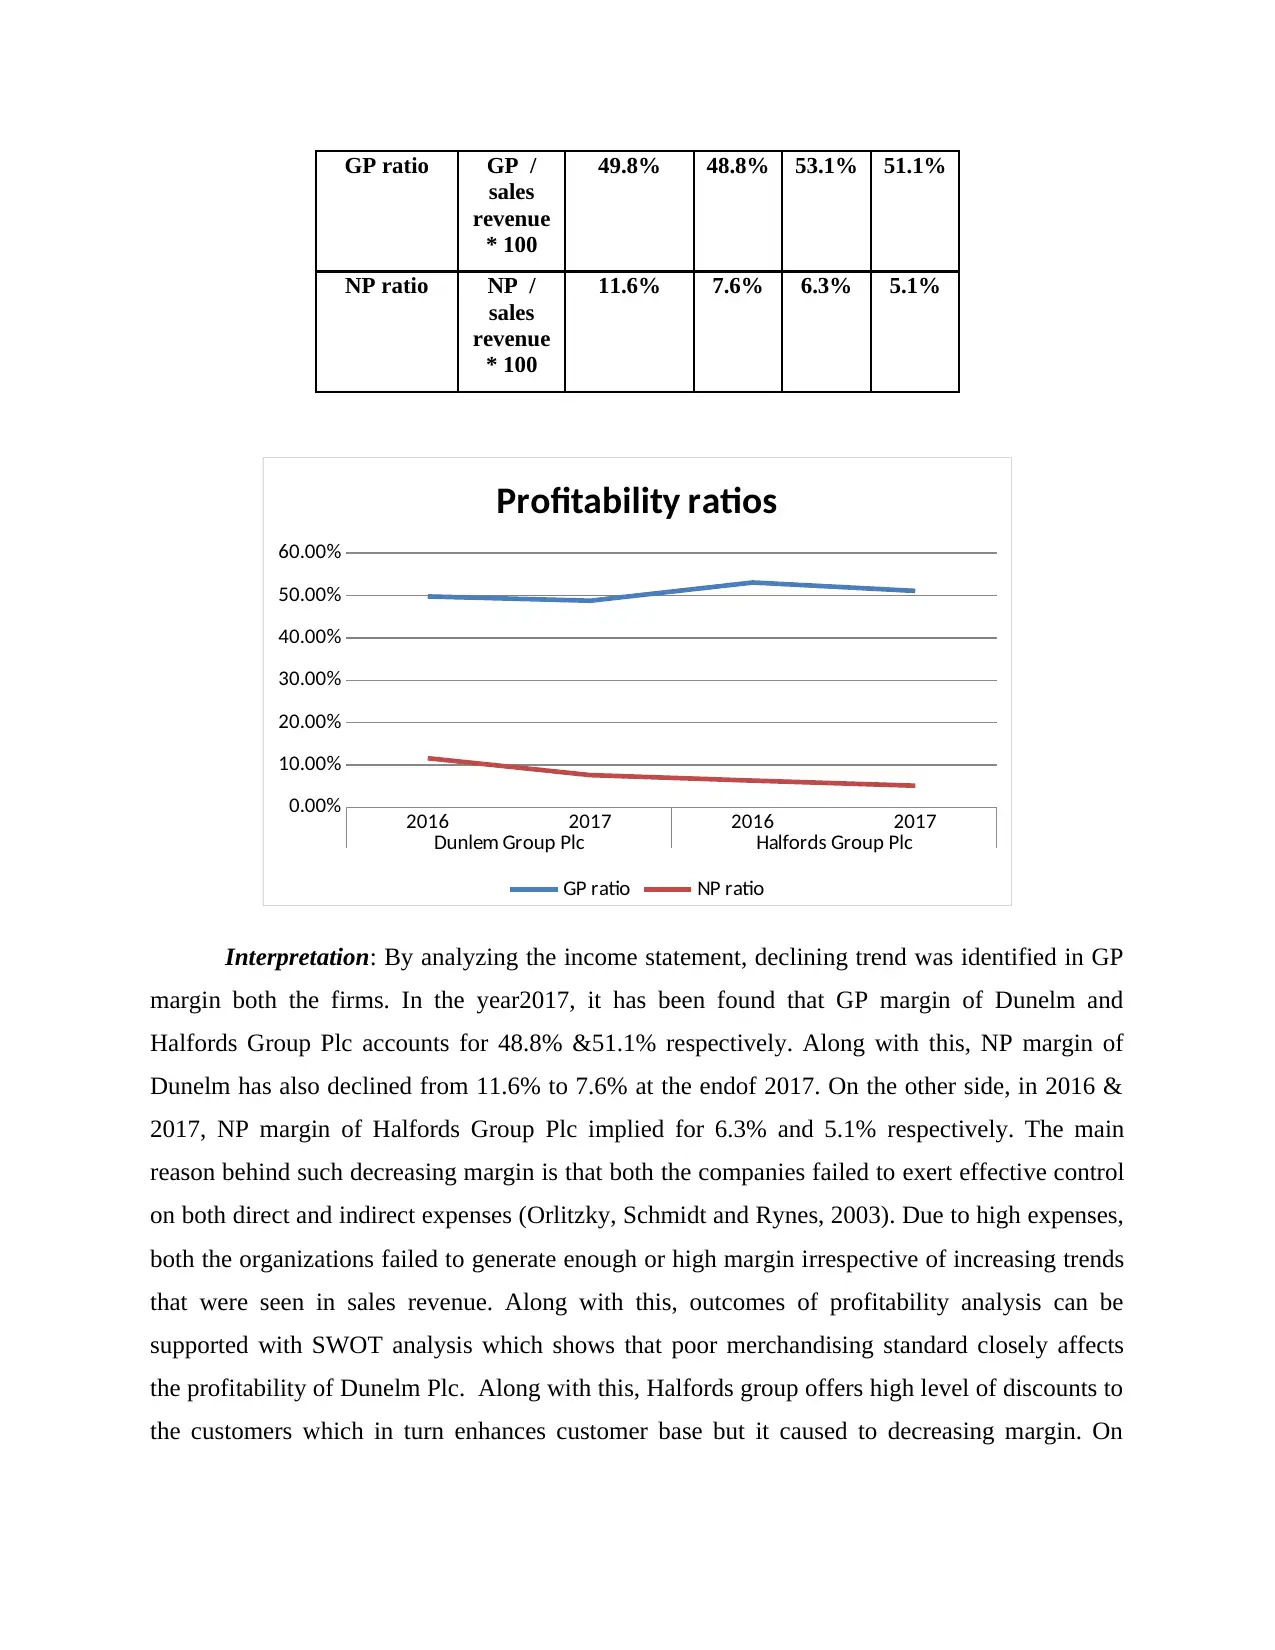
GP ratio GP /
sales
revenue
* 100
49.8% 48.8% 53.1% 51.1%
NP ratio NP /
sales
revenue
* 100
11.6% 7.6% 6.3% 5.1%
2016 2017 2016 2017
Dunlem Group Plc Halfords Group Plc
0.00%
10.00%
20.00%
30.00%
40.00%
50.00%
60.00%
Profitability ratios
GP ratio NP ratio
Interpretation: By analyzing the income statement, declining trend was identified in GP
margin both the firms. In the year2017, it has been found that GP margin of Dunelm and
Halfords Group Plc accounts for 48.8% &51.1% respectively. Along with this, NP margin of
Dunelm has also declined from 11.6% to 7.6% at the endof 2017. On the other side, in 2016 &
2017, NP margin of Halfords Group Plc implied for 6.3% and 5.1% respectively. The main
reason behind such decreasing margin is that both the companies failed to exert effective control
on both direct and indirect expenses (Orlitzky, Schmidt and Rynes, 2003). Due to high expenses,
both the organizations failed to generate enough or high margin irrespective of increasing trends
that were seen in sales revenue. Along with this, outcomes of profitability analysis can be
supported with SWOT analysis which shows that poor merchandising standard closely affects
the profitability of Dunelm Plc. Along with this, Halfords group offers high level of discounts to
the customers which in turn enhances customer base but it caused to decreasing margin. On
sales
revenue
* 100
49.8% 48.8% 53.1% 51.1%
NP ratio NP /
sales
revenue
* 100
11.6% 7.6% 6.3% 5.1%
2016 2017 2016 2017
Dunlem Group Plc Halfords Group Plc
0.00%
10.00%
20.00%
30.00%
40.00%
50.00%
60.00%
Profitability ratios
GP ratio NP ratio
Interpretation: By analyzing the income statement, declining trend was identified in GP
margin both the firms. In the year2017, it has been found that GP margin of Dunelm and
Halfords Group Plc accounts for 48.8% &51.1% respectively. Along with this, NP margin of
Dunelm has also declined from 11.6% to 7.6% at the endof 2017. On the other side, in 2016 &
2017, NP margin of Halfords Group Plc implied for 6.3% and 5.1% respectively. The main
reason behind such decreasing margin is that both the companies failed to exert effective control
on both direct and indirect expenses (Orlitzky, Schmidt and Rynes, 2003). Due to high expenses,
both the organizations failed to generate enough or high margin irrespective of increasing trends
that were seen in sales revenue. Along with this, outcomes of profitability analysis can be
supported with SWOT analysis which shows that poor merchandising standard closely affects
the profitability of Dunelm Plc. Along with this, Halfords group offers high level of discounts to
the customers which in turn enhances customer base but it caused to decreasing margin. On
⊘ This is a preview!⊘
Do you want full access?
Subscribe today to unlock all pages.
Trusted by 1+ million students worldwide
comparing both the firms, it can be saidt hat profitability aspect of Dunelm Plc was good in 2016
and 2017 as compared to Halfords.
Liquidity ratios
Dunelm
Group Plc
Halfords
GroupPlc
Particulars Formula 2016 2017 2016 2017
Current
assets
158 210 235 271
Stock 117 165 158 191
Prepaid
expenses
16 22 34 30
Current
liabilities
108 141 223 247
(Financial
statements
of
Halfords
Group
PLC,2017)
Current
ratio
Current
assets /
current
liabilitie
s
1.46 1.49 1.05 1.10
Quick
ratio
Quick
assets /
current
liabilitie
s
0.23 0.16 0.19 0.20
Paraphrase This Document
Need a fresh take? Get an instant paraphrase of this document with our AI Paraphraser
2016 2017 2016 2017
Dunlem Group Plc Halfords Group Plc
1.46 1.49
1.05 1.1
0.23 0.16 0.19 0.2
Liquidity ratios
Current ratio Quick ratio
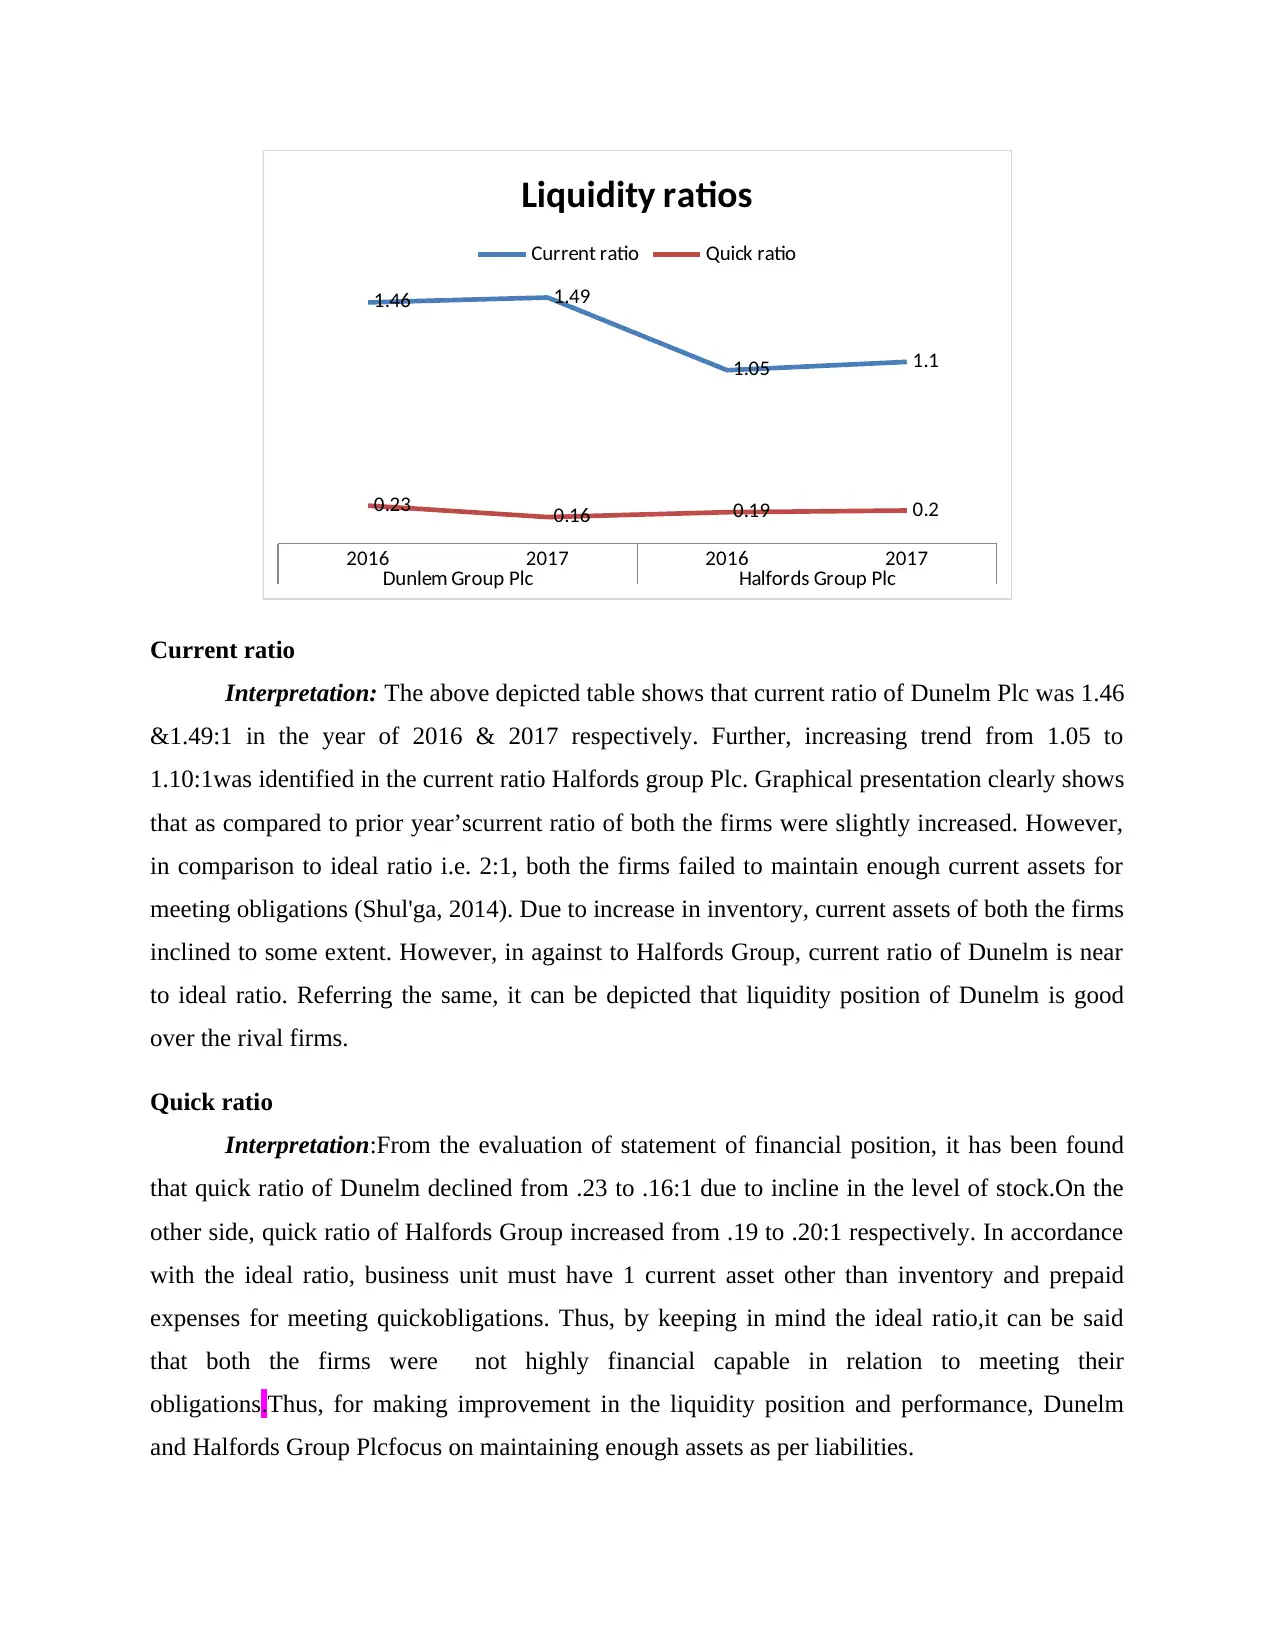
Current ratio
Interpretation: The above depicted table shows that current ratio of Dunelm Plc was 1.46
&1.49:1 in the year of 2016 & 2017 respectively. Further, increasing trend from 1.05 to
1.10:1was identified in the current ratio Halfords group Plc. Graphical presentation clearly shows
that as compared to prior year’scurrent ratio of both the firms were slightly increased. However,
in comparison to ideal ratio i.e. 2:1, both the firms failed to maintain enough current assets for
meeting obligations (Shul'ga, 2014). Due to increase in inventory, current assets of both the firms
inclined to some extent. However, in against to Halfords Group, current ratio of Dunelm is near
to ideal ratio. Referring the same, it can be depicted that liquidity position of Dunelm is good
over the rival firms.
Quick ratio
Interpretation:From the evaluation of statement of financial position, it has been found
that quick ratio of Dunelm declined from .23 to .16:1 due to incline in the level of stock.On the
other side, quick ratio of Halfords Group increased from .19 to .20:1 respectively. In accordance
with the ideal ratio, business unit must have 1 current asset other than inventory and prepaid
expenses for meeting quickobligations. Thus, by keeping in mind the ideal ratio,it can be said
that both the firms were not highly financial capable in relation to meeting their
obligations.Thus, for making improvement in the liquidity position and performance, Dunelm
and Halfords Group Plcfocus on maintaining enough assets as per liabilities.
Dunlem Group Plc Halfords Group Plc
1.46 1.49
1.05 1.1
0.23 0.16 0.19 0.2
Liquidity ratios
Current ratio Quick ratio
Current ratio
Interpretation: The above depicted table shows that current ratio of Dunelm Plc was 1.46
&1.49:1 in the year of 2016 & 2017 respectively. Further, increasing trend from 1.05 to
1.10:1was identified in the current ratio Halfords group Plc. Graphical presentation clearly shows
that as compared to prior year’scurrent ratio of both the firms were slightly increased. However,
in comparison to ideal ratio i.e. 2:1, both the firms failed to maintain enough current assets for
meeting obligations (Shul'ga, 2014). Due to increase in inventory, current assets of both the firms
inclined to some extent. However, in against to Halfords Group, current ratio of Dunelm is near
to ideal ratio. Referring the same, it can be depicted that liquidity position of Dunelm is good
over the rival firms.
Quick ratio
Interpretation:From the evaluation of statement of financial position, it has been found
that quick ratio of Dunelm declined from .23 to .16:1 due to incline in the level of stock.On the
other side, quick ratio of Halfords Group increased from .19 to .20:1 respectively. In accordance
with the ideal ratio, business unit must have 1 current asset other than inventory and prepaid
expenses for meeting quickobligations. Thus, by keeping in mind the ideal ratio,it can be said
that both the firms were not highly financial capable in relation to meeting their
obligations.Thus, for making improvement in the liquidity position and performance, Dunelm
and Halfords Group Plcfocus on maintaining enough assets as per liabilities.
Solvency ratio analysis
Dunelm Group Plc Halfords Group Plc
Particulars Formula 2016 2017 2016 2017
Long term debt 94 140 25 72
Shareholders’ equity 100 110 405 408
Debt-equity ratio Long term debt /
shareholders’
equity
0.94:1 1.27:1 0.06:1 0.18:1
2016 2017 2016 2017
Dunlem Group Plc Halfords Group Plc
0
0.2
0.4
0.6
0.8
1
1.2
1.4
Debt-equity ratio
Debt-equity ratio
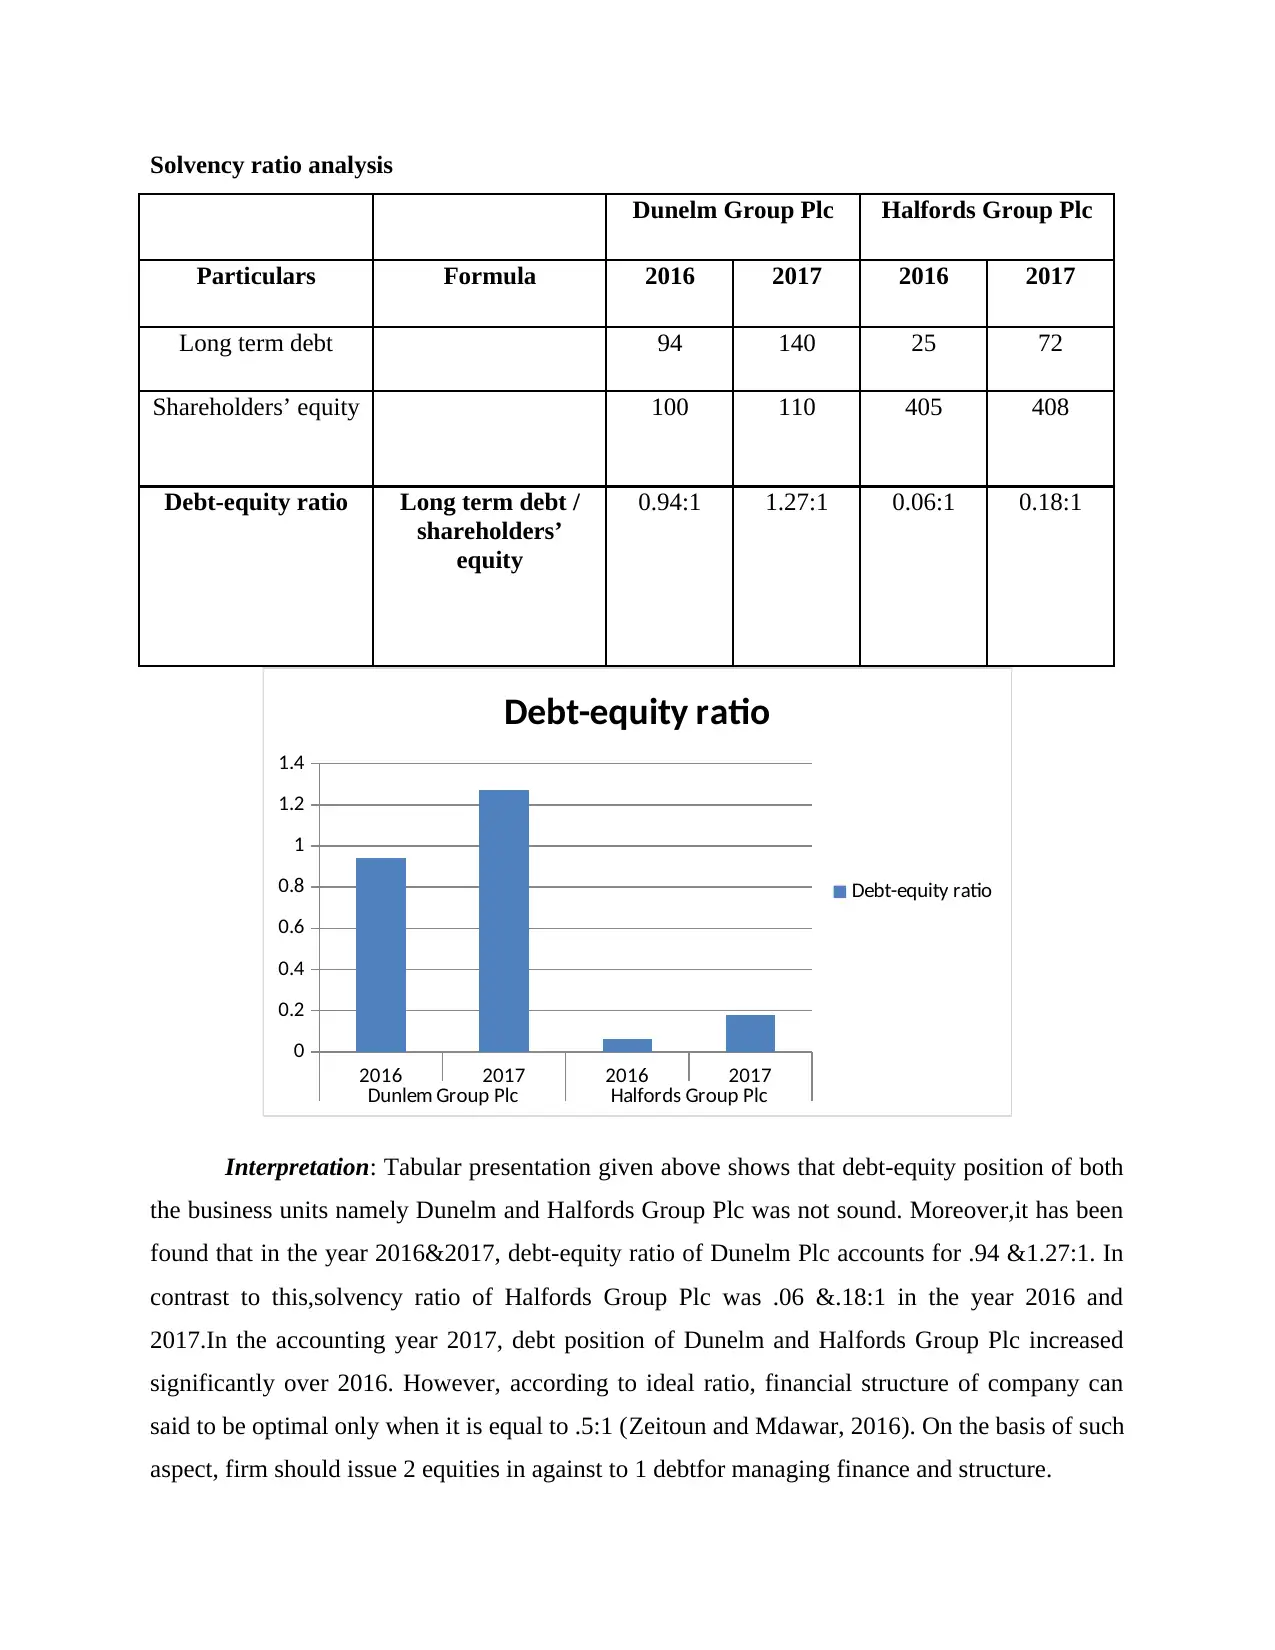
Interpretation: Tabular presentation given above shows that debt-equity position of both
the business units namely Dunelm and Halfords Group Plc was not sound. Moreover,it has been
found that in the year 2016&2017, debt-equity ratio of Dunelm Plc accounts for .94 &1.27:1. In
contrast to this,solvency ratio of Halfords Group Plc was .06 &.18:1 in the year 2016 and
2017.In the accounting year 2017, debt position of Dunelm and Halfords Group Plc increased
significantly over 2016. However, according to ideal ratio, financial structure of company can
said to be optimal only when it is equal to .5:1 (Zeitoun and Mdawar, 2016). On the basis of such
aspect, firm should issue 2 equities in against to 1 debtfor managing finance and structure.
Dunelm Group Plc Halfords Group Plc
Particulars Formula 2016 2017 2016 2017
Long term debt 94 140 25 72
Shareholders’ equity 100 110 405 408
Debt-equity ratio Long term debt /
shareholders’
equity
0.94:1 1.27:1 0.06:1 0.18:1
2016 2017 2016 2017
Dunlem Group Plc Halfords Group Plc
0
0.2
0.4
0.6
0.8
1
1.2
1.4
Debt-equity ratio
Debt-equity ratio
Interpretation: Tabular presentation given above shows that debt-equity position of both
the business units namely Dunelm and Halfords Group Plc was not sound. Moreover,it has been
found that in the year 2016&2017, debt-equity ratio of Dunelm Plc accounts for .94 &1.27:1. In
contrast to this,solvency ratio of Halfords Group Plc was .06 &.18:1 in the year 2016 and
2017.In the accounting year 2017, debt position of Dunelm and Halfords Group Plc increased
significantly over 2016. However, according to ideal ratio, financial structure of company can
said to be optimal only when it is equal to .5:1 (Zeitoun and Mdawar, 2016). On the basis of such
aspect, firm should issue 2 equities in against to 1 debtfor managing finance and structure.
⊘ This is a preview!⊘
Do you want full access?
Subscribe today to unlock all pages.
Trusted by 1+ million students worldwide
Outcomesof analysis shows that monetary structure of Dunelm Plc was not good in 2016
&2017. Result like.94 & 1.27:1clearly shows that Dunelm has met more of its financial needs
through the means of debt rather than equities. This in turn imposes fixed burden on Dunelm in
the form of interest and thereby affects profitability aspects. Apart from this, debt equity position
of Halfords Group Plc is improved in the positive or upward manner. Thus, while raising
funds,both the firms need to keep in mind ideal ratio which in turn assists in creating effective
monetary structure.Hence, considering the overall assessment, it can be entailed that solvency
position of Halfords Group is good over Dunelm.
Efficiency ratios
Dunelm Group Plc Halfords GroupPlc
Particulars Formula 2016 2017 2016 2017
Total assets 346 433 705 776
Revenue 881 956 1022 1095
Creditors 53 79 99 111
COGS 442 489 478 536
Stock 117 165 158 191
Fixed assets 189 223 470 505
(Financial
statements
of
Halfords
Group
PLC,
2017)
Fixed assets
turnover ratio
Revenue /
Fixed assets
4.66 times 4.29 times 2.17 times 2.17 times
Total assets
turnover ratio
Revenue /
Total assets
2.55 times 2.21 times 1.45 times 1.41 times
Inventory
turnover ratio
COGS /
inventory
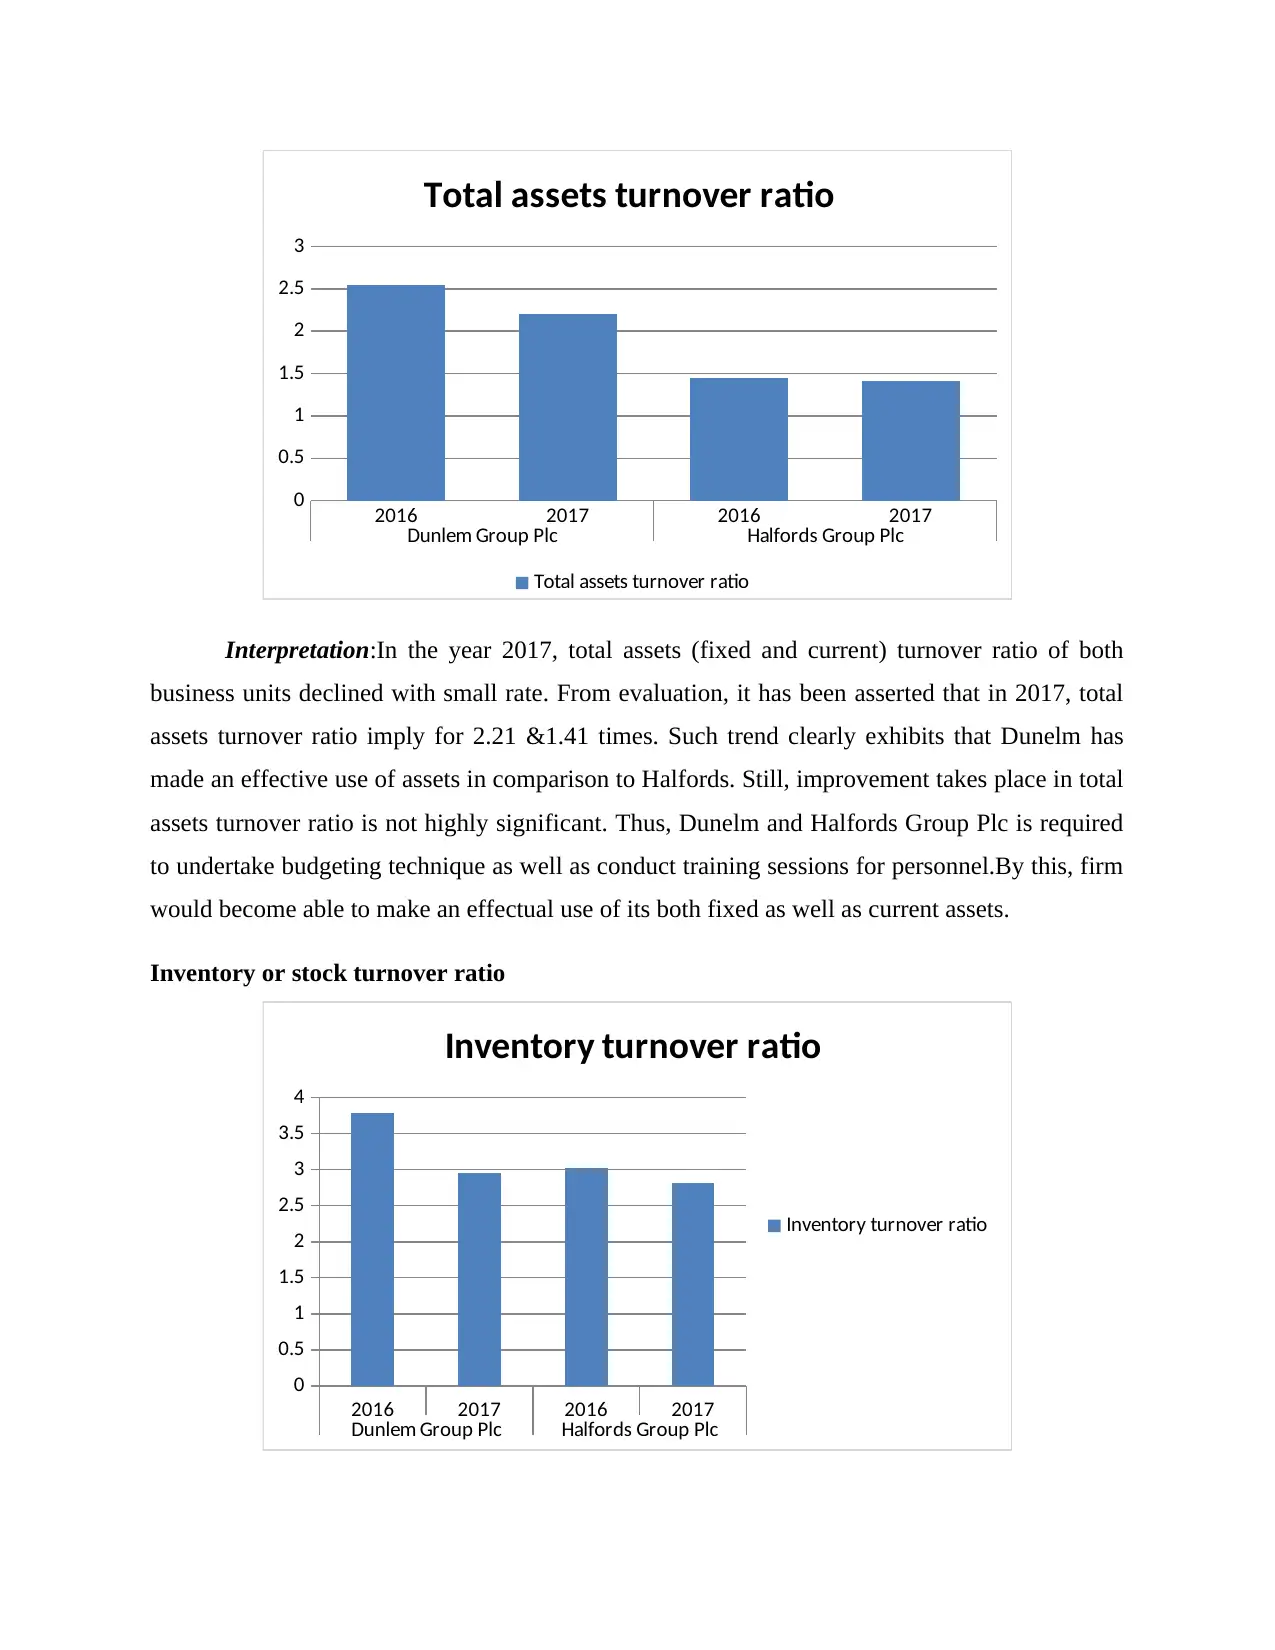
3.78 times 2.96 times 3.03 times 2.81 times
Payment period Accounts
payable * 365 /
43.77 days 58.97 days 75.60 days 75.59 days
&2017. Result like.94 & 1.27:1clearly shows that Dunelm has met more of its financial needs
through the means of debt rather than equities. This in turn imposes fixed burden on Dunelm in
the form of interest and thereby affects profitability aspects. Apart from this, debt equity position
of Halfords Group Plc is improved in the positive or upward manner. Thus, while raising
funds,both the firms need to keep in mind ideal ratio which in turn assists in creating effective
monetary structure.Hence, considering the overall assessment, it can be entailed that solvency
position of Halfords Group is good over Dunelm.
Efficiency ratios
Dunelm Group Plc Halfords GroupPlc
Particulars Formula 2016 2017 2016 2017
Total assets 346 433 705 776
Revenue 881 956 1022 1095
Creditors 53 79 99 111
COGS 442 489 478 536
Stock 117 165 158 191
Fixed assets 189 223 470 505
(Financial
statements
of
Halfords
Group
PLC,
2017)
Fixed assets
turnover ratio
Revenue /
Fixed assets
4.66 times 4.29 times 2.17 times 2.17 times
Total assets
turnover ratio
Revenue /
Total assets
2.55 times 2.21 times 1.45 times 1.41 times
Inventory
turnover ratio
COGS /
inventory
3.78 times 2.96 times 3.03 times 2.81 times
Payment period Accounts
payable * 365 /
43.77 days 58.97 days 75.60 days 75.59 days
Paraphrase This Document
Need a fresh take? Get an instant paraphrase of this document with our AI Paraphraser
COGS or
purchase
Fixed assets turnover ratio
2016 2017 2016 2017
Dunlem Group Plc Halfords Group Plc
0
0.5
1
1.5
2
2.5
3
3.5
4
4.5
5
Fixed assets turnover ratio
Fixed assets turnover ratio
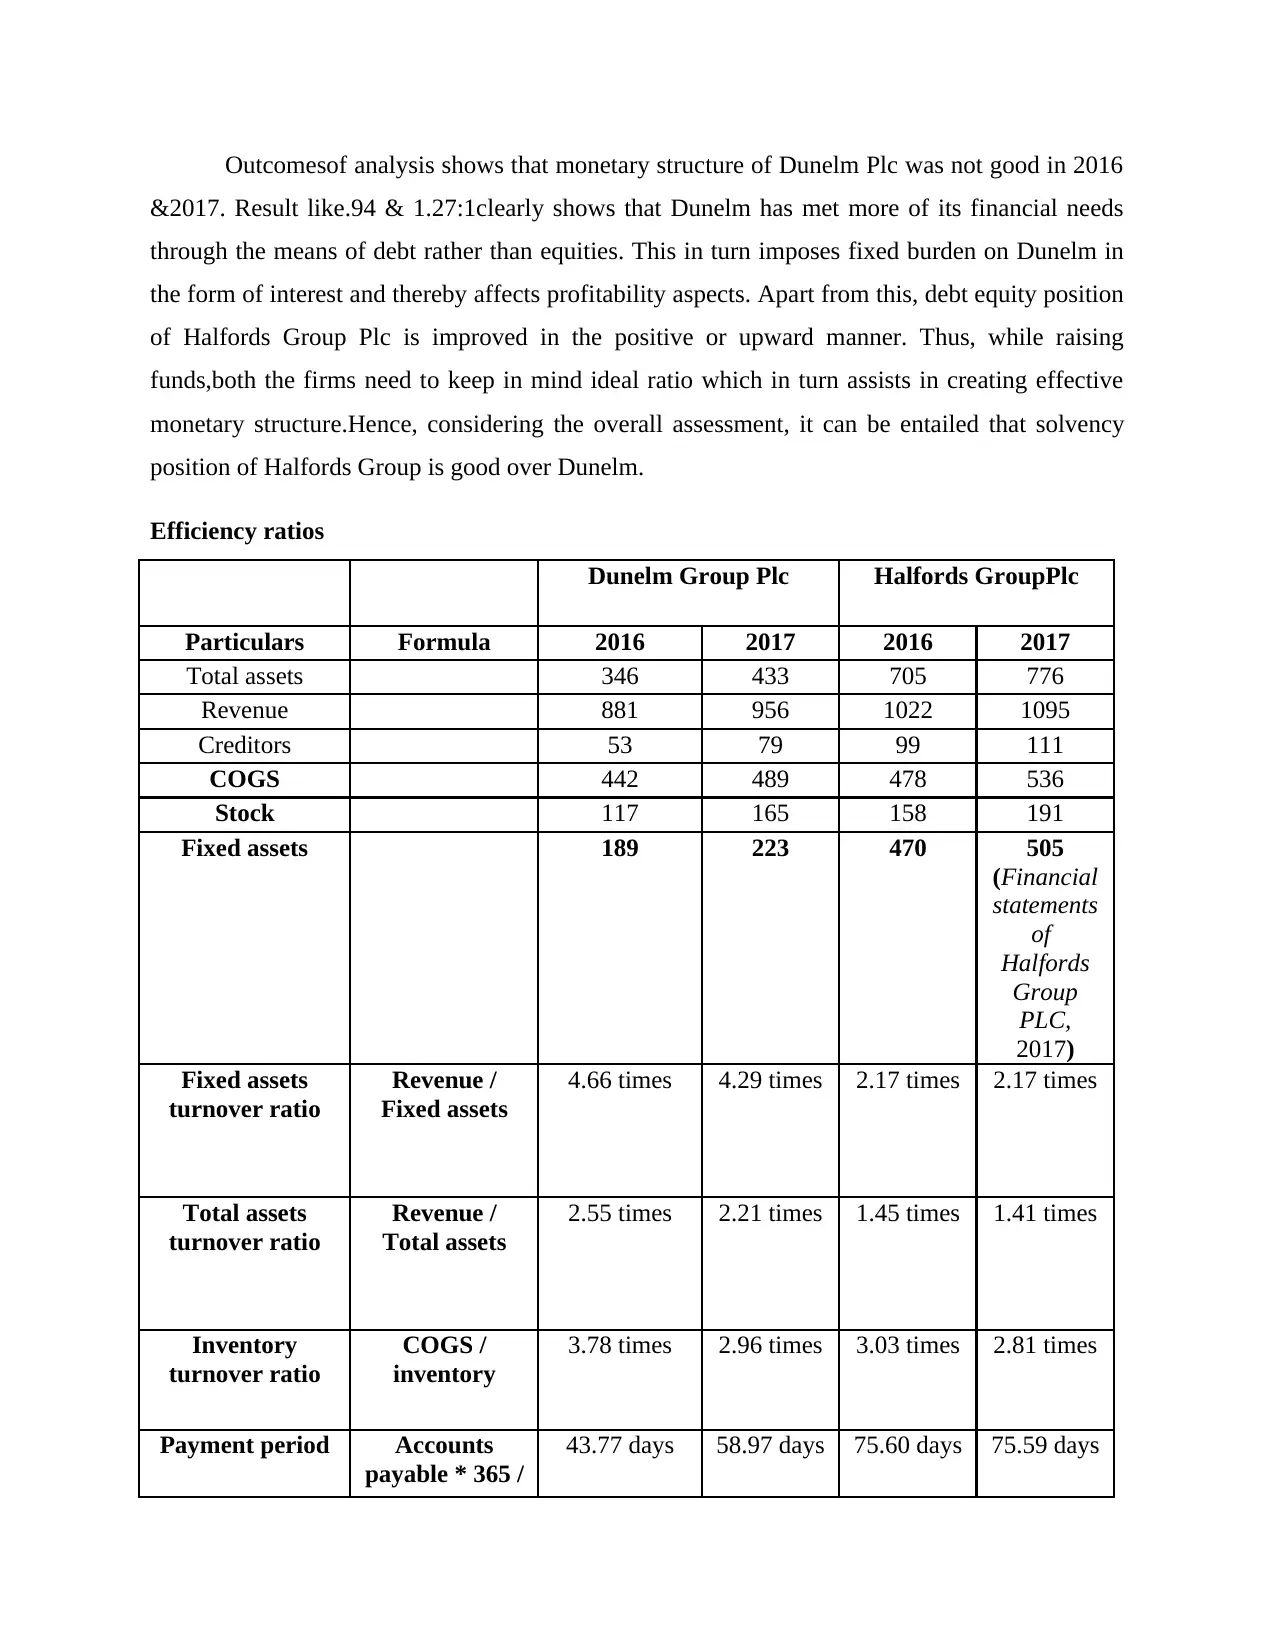
Interpretation: By applying the tool of ratio analysis on financial data set, it has been
identified that fixed assets turnover ratio of Dunelm Plc decreased from 4.66 to 4.29 times. On
the other hand, fixed assets turnover ratio of Halfords Group Plc was constant i.e.2.17 times
(Financial statements of Dunlem Group PLC, 2017). As per evaluation, in 2017, both the
business units failed to generate enough returns through using fixed assets. Due to lack of having
competent staff, Halfords failed to make optimum use of assets and thereby, generated sales.
Further, lack of fixed assets maintenance is another main cause behind decreasing ratio. Hence,
as compared to Halfords, Dunelm Plc has used fixed assets in the business operations effectually.
Besides this, to improve this ratio, Dunelm Plc is required to undertake the latest equipment and
focus on up-gradation of same. Through this, firm would become able to get the desired level of
outcomes or success.
Totalassets turnover ratio
purchase
Fixed assets turnover ratio
2016 2017 2016 2017
Dunlem Group Plc Halfords Group Plc
0
0.5
1
1.5
2
2.5
3
3.5
4
4.5
5
Fixed assets turnover ratio
Fixed assets turnover ratio
Interpretation: By applying the tool of ratio analysis on financial data set, it has been
identified that fixed assets turnover ratio of Dunelm Plc decreased from 4.66 to 4.29 times. On
the other hand, fixed assets turnover ratio of Halfords Group Plc was constant i.e.2.17 times
(Financial statements of Dunlem Group PLC, 2017). As per evaluation, in 2017, both the
business units failed to generate enough returns through using fixed assets. Due to lack of having
competent staff, Halfords failed to make optimum use of assets and thereby, generated sales.
Further, lack of fixed assets maintenance is another main cause behind decreasing ratio. Hence,
as compared to Halfords, Dunelm Plc has used fixed assets in the business operations effectually.
Besides this, to improve this ratio, Dunelm Plc is required to undertake the latest equipment and
focus on up-gradation of same. Through this, firm would become able to get the desired level of
outcomes or success.
Totalassets turnover ratio
2016 2017 2016 2017
Dunlem Group Plc Halfords Group Plc
0
0.5
1
1.5
2
2.5
3
Total assets turnover ratio
Total assets turnover ratio
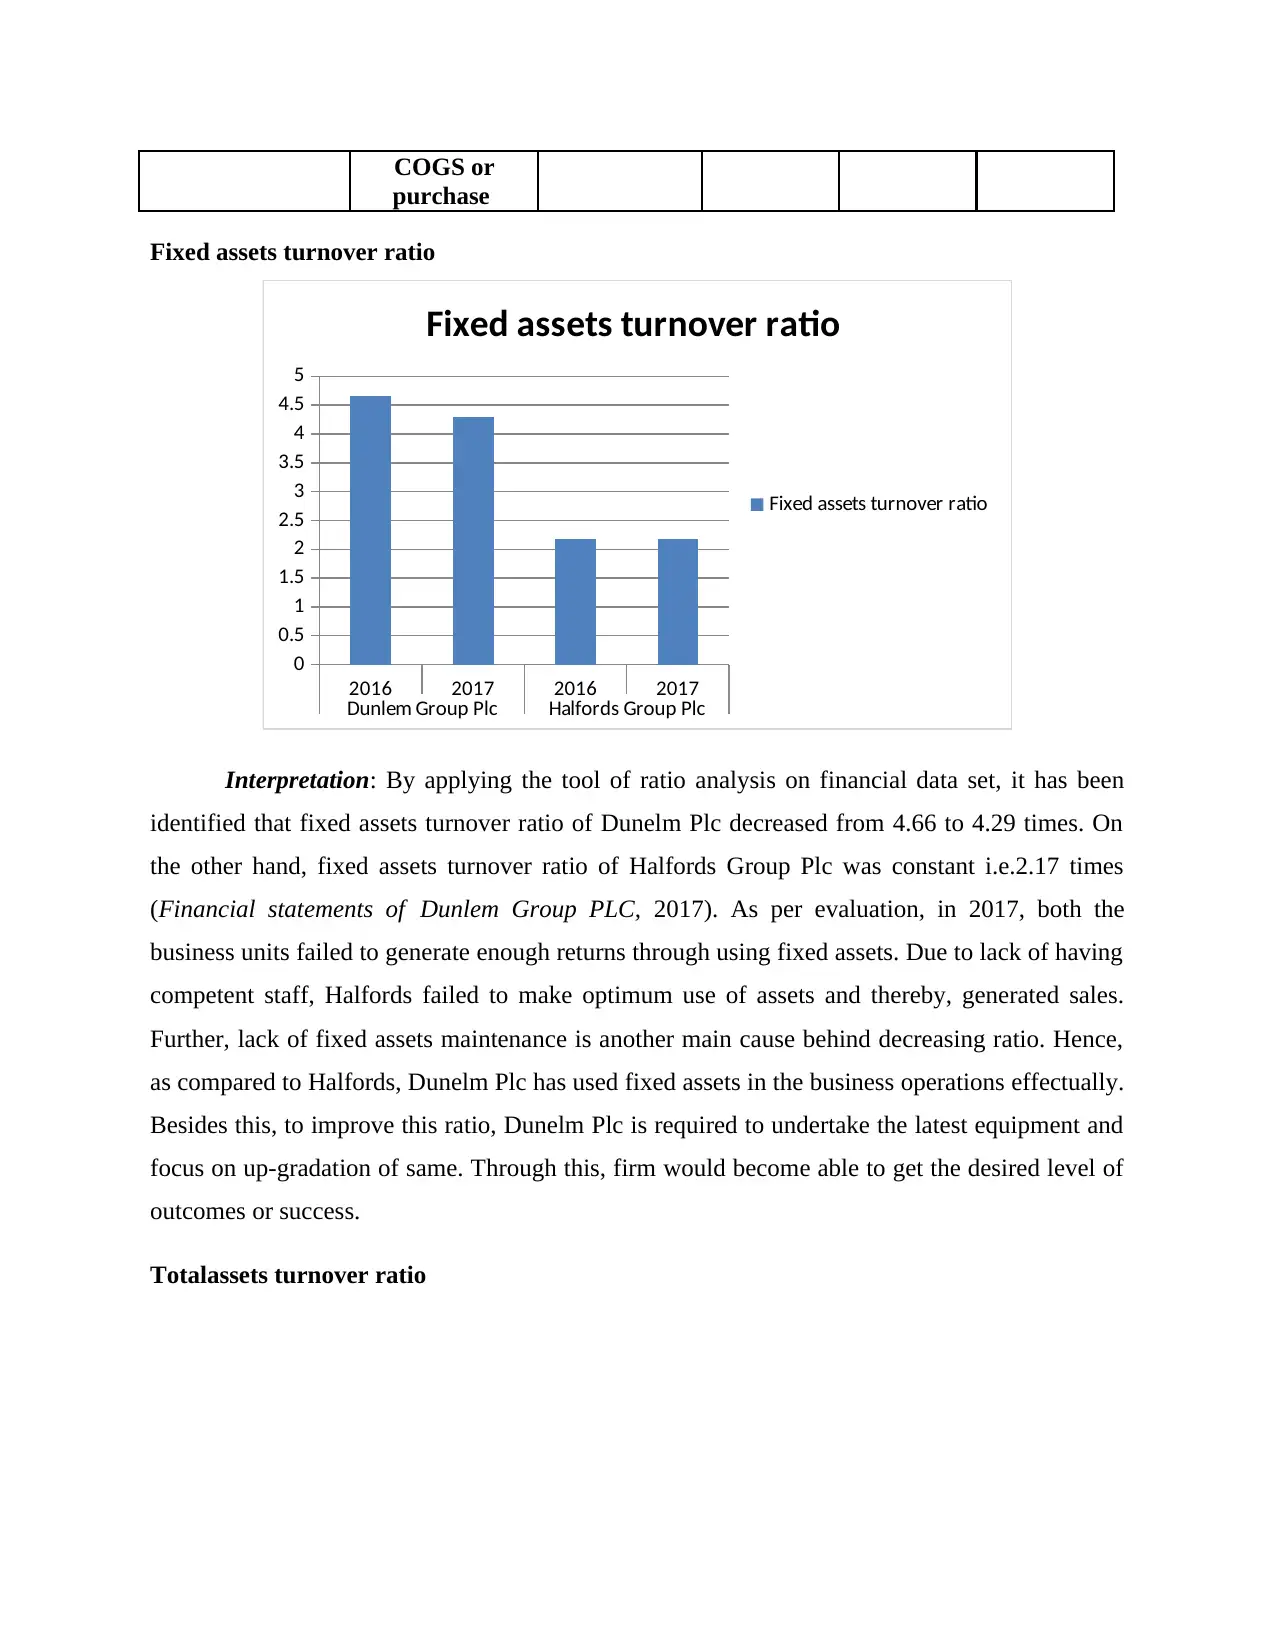
Interpretation:In the year 2017, total assets (fixed and current) turnover ratio of both
business units declined with small rate. From evaluation, it has been asserted that in 2017, total
assets turnover ratio imply for 2.21 &1.41 times. Such trend clearly exhibits that Dunelm has
made an effective use of assets in comparison to Halfords. Still, improvement takes place in total
assets turnover ratio is not highly significant. Thus, Dunelm and Halfords Group Plc is required
to undertake budgeting technique as well as conduct training sessions for personnel.By this, firm
would become able to make an effectual use of its both fixed as well as current assets.
Inventory or stock turnover ratio
2016 2017 2016 2017
Dunlem Group Plc Halfords Group Plc
0
0.5
1
1.5
2
2.5
3
3.5
4
Inventory turnover ratio
Inventory turnover ratio
Dunlem Group Plc Halfords Group Plc
0
0.5
1
1.5
2
2.5
3
Total assets turnover ratio
Total assets turnover ratio
Interpretation:In the year 2017, total assets (fixed and current) turnover ratio of both
business units declined with small rate. From evaluation, it has been asserted that in 2017, total
assets turnover ratio imply for 2.21 &1.41 times. Such trend clearly exhibits that Dunelm has
made an effective use of assets in comparison to Halfords. Still, improvement takes place in total
assets turnover ratio is not highly significant. Thus, Dunelm and Halfords Group Plc is required
to undertake budgeting technique as well as conduct training sessions for personnel.By this, firm
would become able to make an effectual use of its both fixed as well as current assets.
Inventory or stock turnover ratio
2016 2017 2016 2017
Dunlem Group Plc Halfords Group Plc
0
0.5
1
1.5
2
2.5
3
3.5
4
Inventory turnover ratio
Inventory turnover ratio
⊘ This is a preview!⊘
Do you want full access?
Subscribe today to unlock all pages.
Trusted by 1+ million students worldwide
1 out of 19
Related Documents


Your All-in-One AI-Powered Toolkit for Academic Success.
+13062052269
info@desklib.com
Available 24*7 on WhatsApp / Email
![[object Object]](/_next/static/media/star-bottom.7253800d.svg)
Unlock your academic potential
Copyright © 2020–2026 A2Z Services. All Rights Reserved. Developed and managed by ZUCOL.