Financial Analysis Report: DuPont Method for Company Profitability

Verified

Added on  2020/12/18

|7
|847
|453
Report
AI Summary
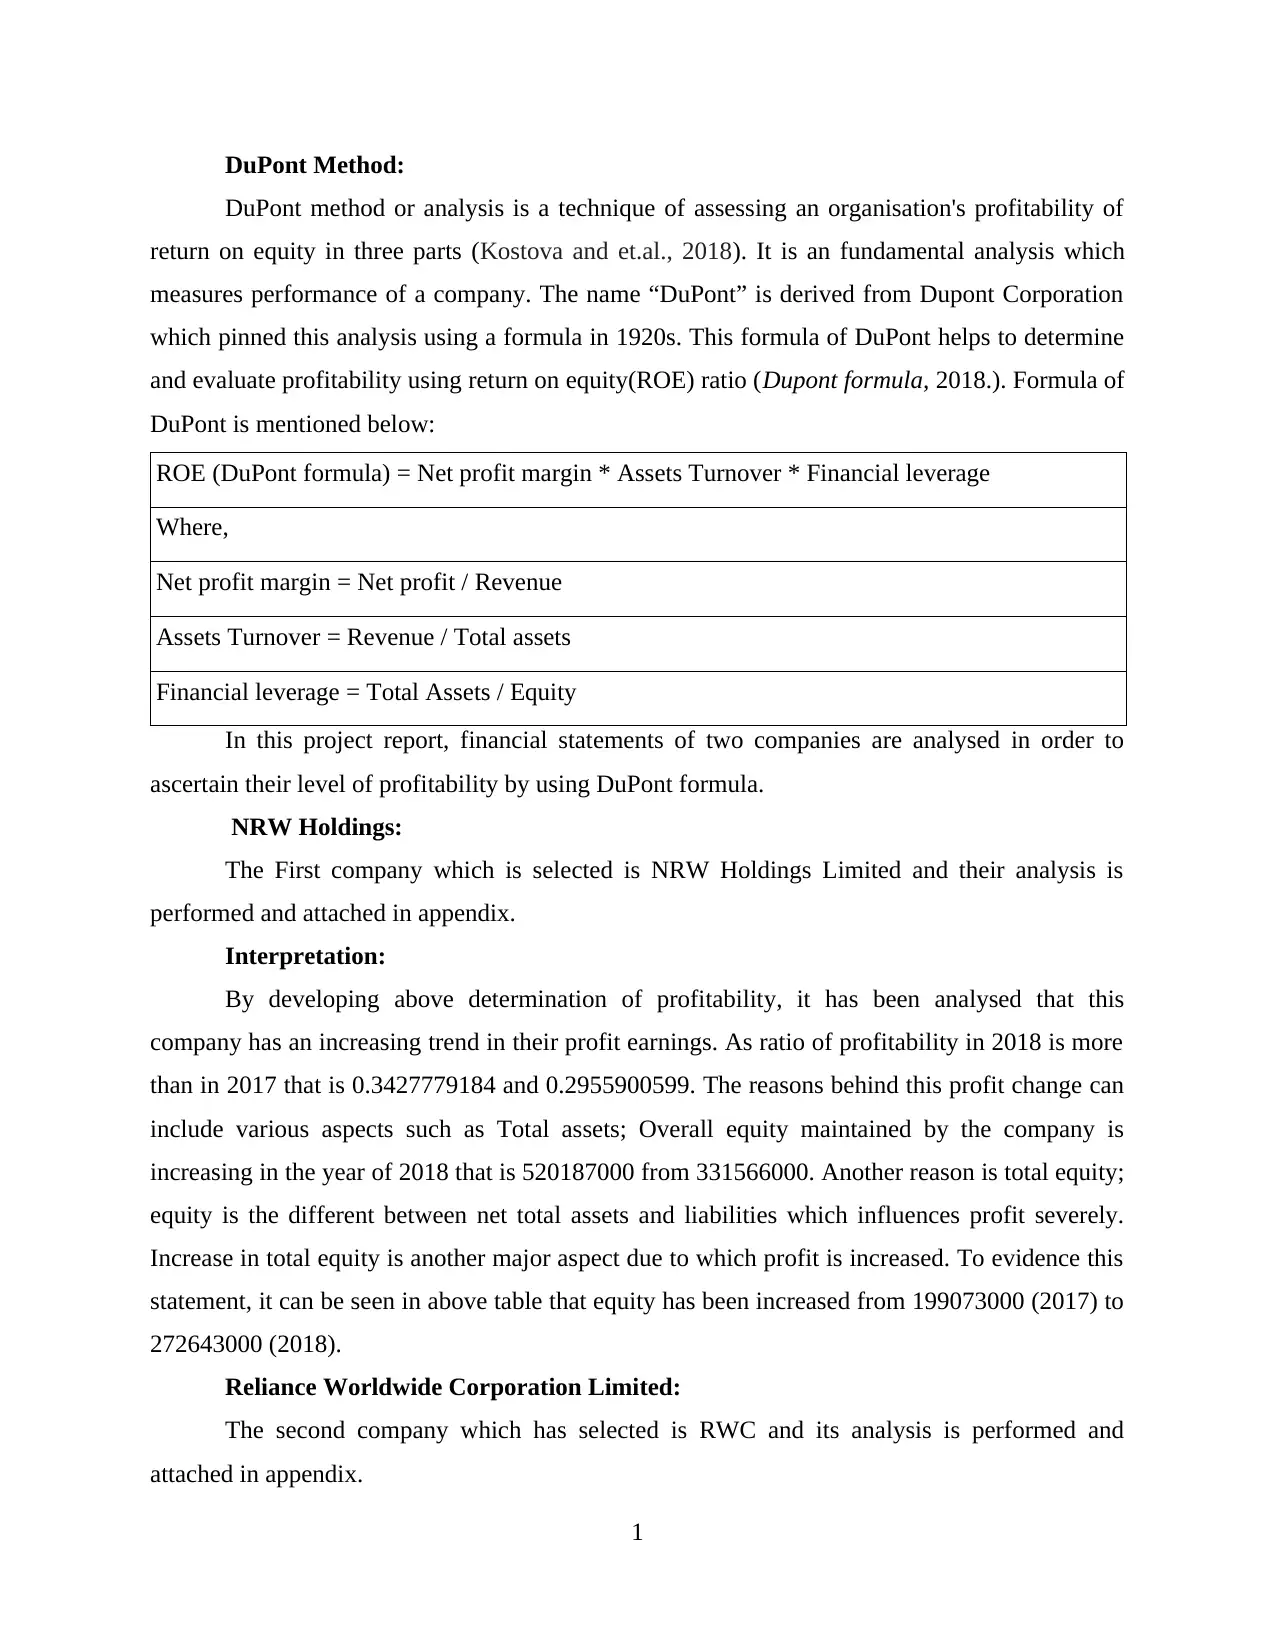
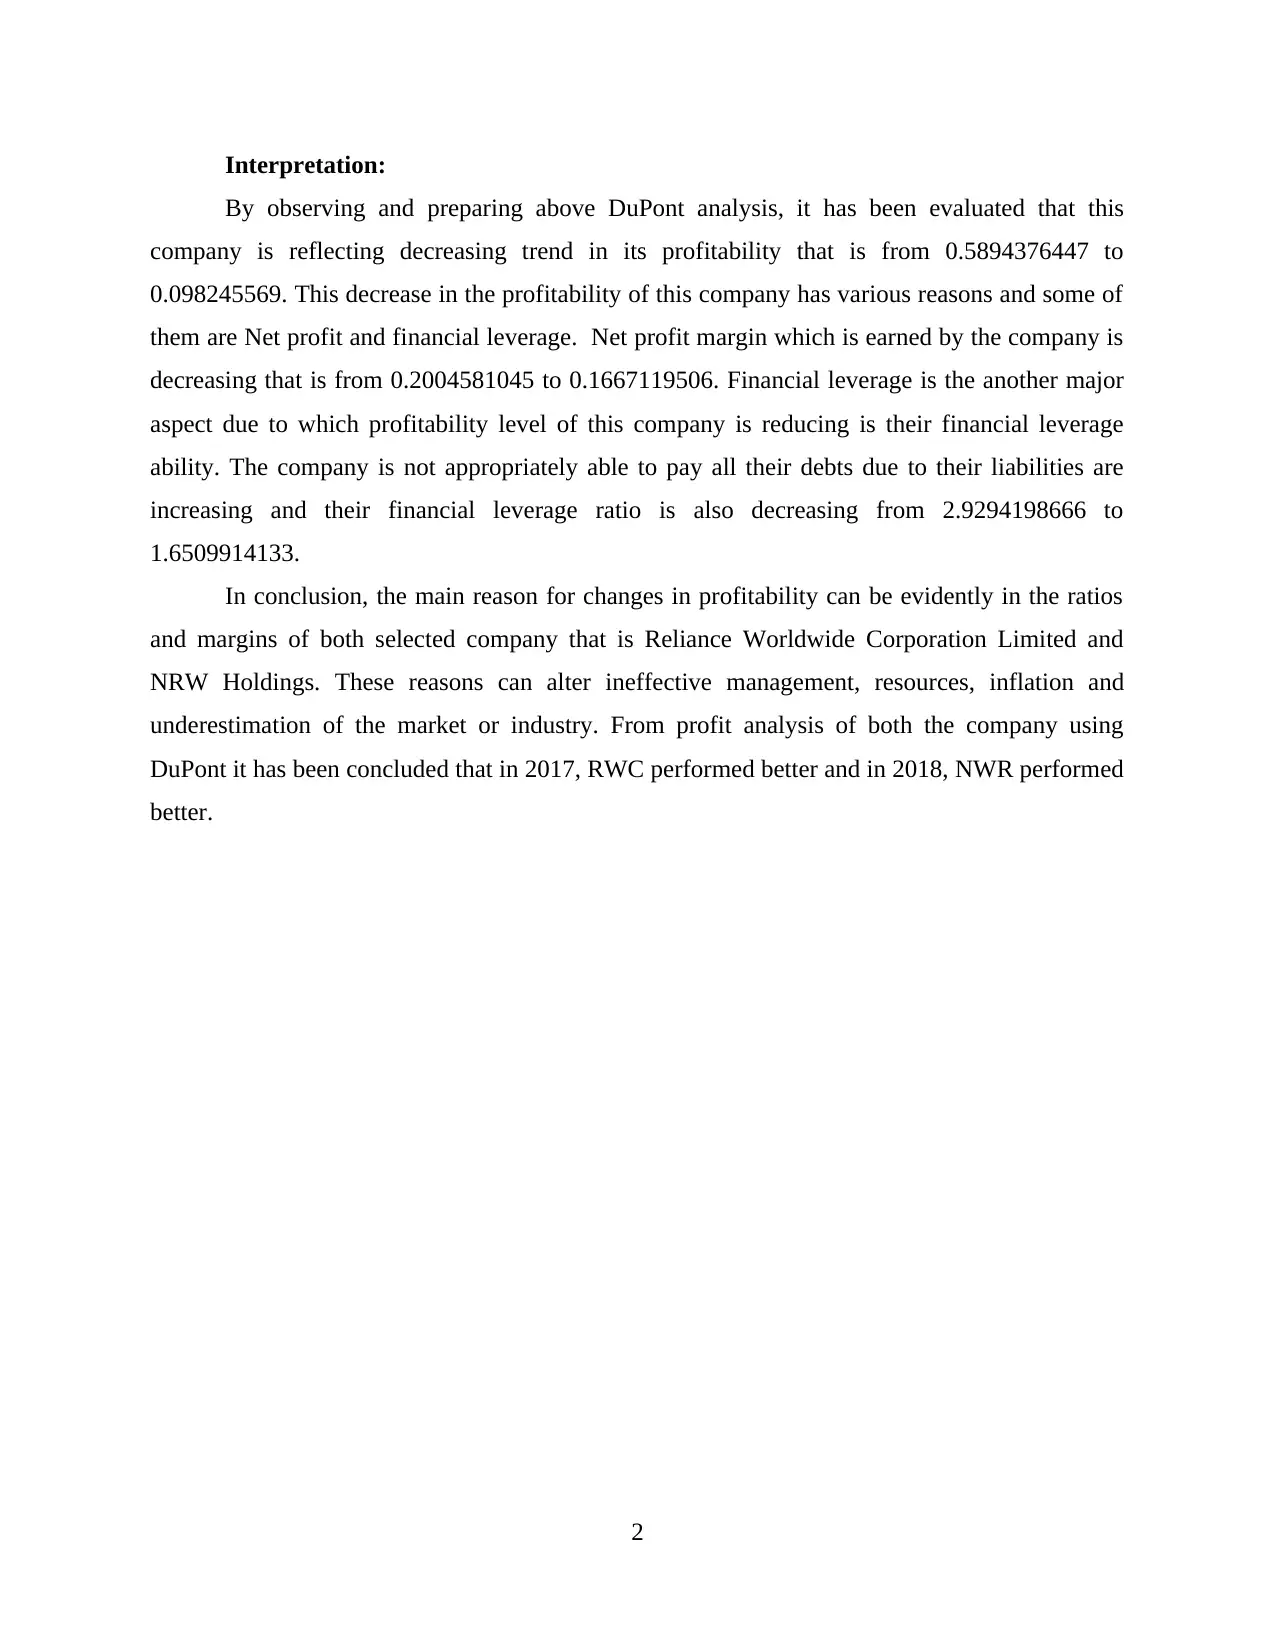
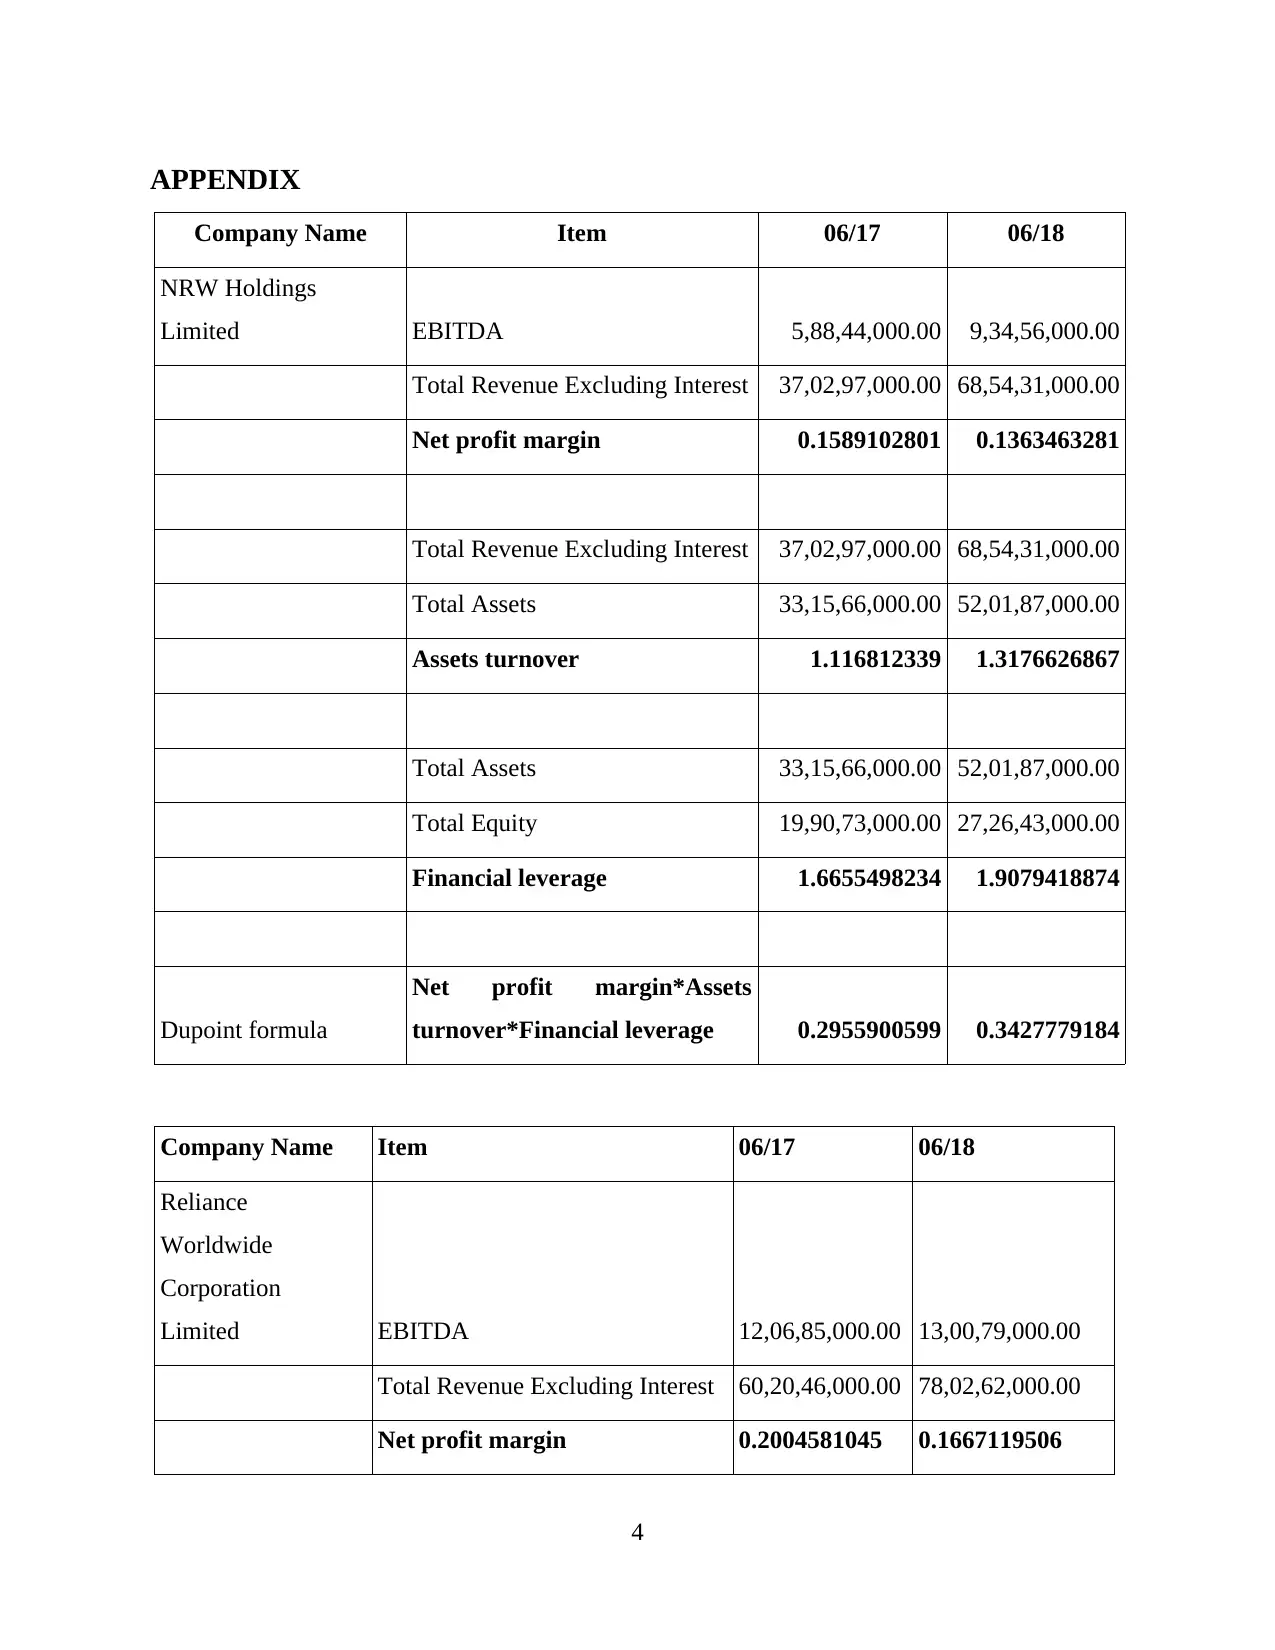
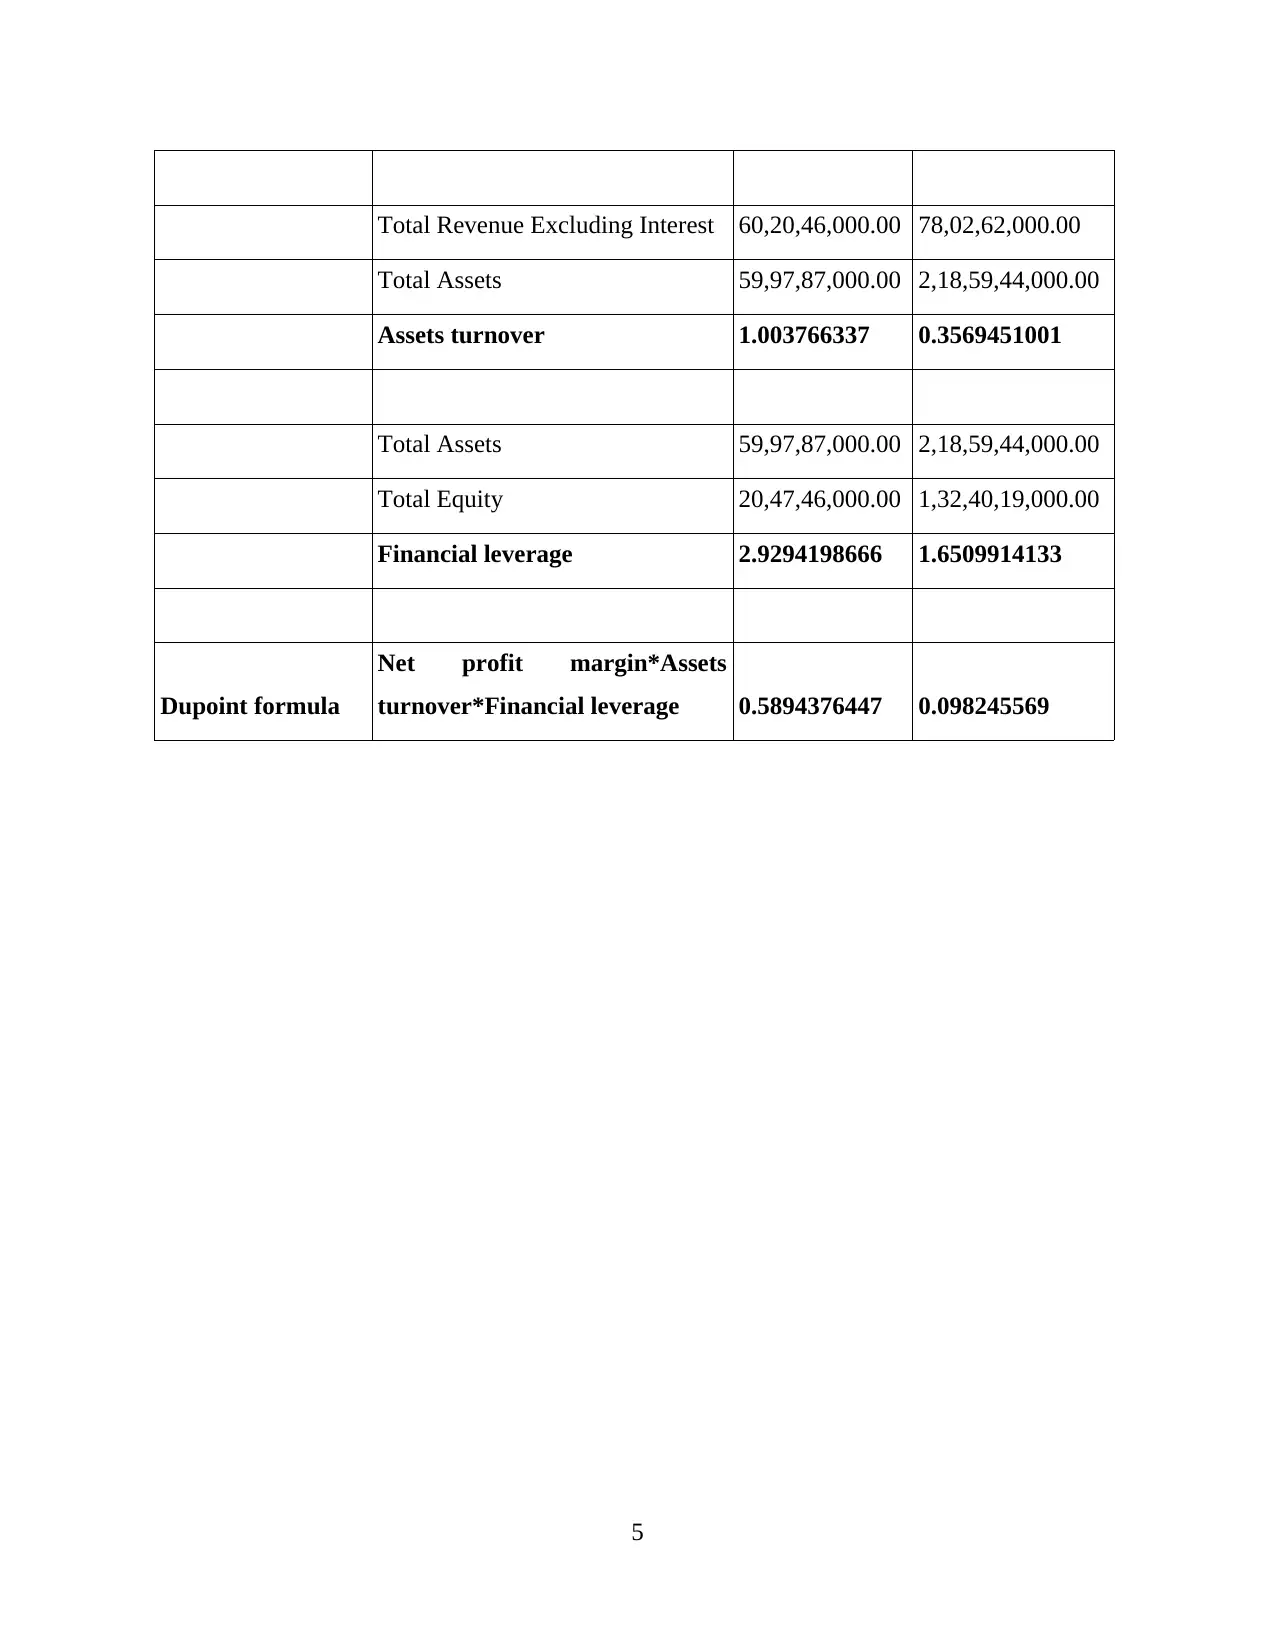
This report presents a financial analysis using the DuPont method, a technique for assessing a company's profitability, specifically return on equity (ROE). The analysis is applied to two companies: NRW Holdings and Reliance Worldwide Corporation Limited. The DuPont formula, which breaks down ROE into net profit margin, asset turnover, and financial leverage, is used to evaluate the financial performance of each company over a specified period (2017-2018). The report includes calculations and interpretations of the financial ratios for each company, highlighting trends in profitability. For NRW Holdings, the analysis reveals an increasing trend in profit earnings, attributed to increases in total assets and equity. Conversely, Reliance Worldwide Corporation demonstrates a decreasing trend in profitability, linked to declines in net profit margin and financial leverage. The conclusion emphasizes the significance of these ratios in understanding changes in profitability and highlights the better performance of RWC in 2017 and NWR in 2018. The report references relevant literature and includes an appendix with financial data used for the analysis.
tabler-icon-diamond-filled.svg

Contribute Materials

Your contribution can guide someone’s learning journey. Share your documents today.
Document Page
Financial Analysis
tabler-icon-diamond-filled.svg

Secure Best Marks with AI Grader

Need help grading? Try our AI Grader for instant feedback on your assignments.
Document Page
Document Page
DuPont Method:
DuPont method or analysis is a technique of assessing an organisation's profitability of
return on equity in three parts (Kostova and et.al., 2018). It is an fundamental analysis which
measures performance of a company. The name “DuPont” is derived from Dupont Corporation
which pinned this analysis using a formula in 1920s. This formula of DuPont helps to determine
and evaluate profitability using return on equity(ROE) ratio (Dupont formula, 2018.). Formula of
DuPont is mentioned below:
ROE (DuPont formula) = Net profit margin * Assets Turnover * Financial leverage
Where,
Net profit margin = Net profit / Revenue
Assets Turnover = Revenue / Total assets
Financial leverage = Total Assets / Equity
In this project report, financial statements of two companies are analysed in order to
ascertain their level of profitability by using DuPont formula.
NRW Holdings:
The First company which is selected is NRW Holdings Limited and their analysis is
performed and attached in appendix.
Interpretation:
By developing above determination of profitability, it has been analysed that this
company has an increasing trend in their profit earnings. As ratio of profitability in 2018 is more
than in 2017 that is 0.3427779184 and 0.2955900599. The reasons behind this profit change can
include various aspects such as Total assets; Overall equity maintained by the company is
increasing in the year of 2018 that is 520187000 from 331566000. Another reason is total equity;
equity is the different between net total assets and liabilities which influences profit severely.
Increase in total equity is another major aspect due to which profit is increased. To evidence this
statement, it can be seen in above table that equity has been increased from 199073000 (2017) to
272643000 (2018).
Reliance Worldwide Corporation Limited:
The second company which has selected is RWC and its analysis is performed and
attached in appendix.
1
Document Page
Interpretation:
By observing and preparing above DuPont analysis, it has been evaluated that this
company is reflecting decreasing trend in its profitability that is from 0.5894376447 to
0.098245569. This decrease in the profitability of this company has various reasons and some of
them are Net profit and financial leverage. Net profit margin which is earned by the company is
decreasing that is from 0.2004581045 to 0.1667119506. Financial leverage is the another major
aspect due to which profitability level of this company is reducing is their financial leverage
ability. The company is not appropriately able to pay all their debts due to their liabilities are
increasing and their financial leverage ratio is also decreasing from 2.9294198666 to
1.6509914133.
In conclusion, the main reason for changes in profitability can be evidently in the ratios
and margins of both selected company that is Reliance Worldwide Corporation Limited and
NRW Holdings. These reasons can alter ineffective management, resources, inflation and
underestimation of the market or industry. From profit analysis of both the company using
DuPont it has been concluded that in 2017, RWC performed better and in 2018, NWR performed
better.
2
tabler-icon-diamond-filled.svg

Secure Best Marks with AI Grader

Need help grading? Try our AI Grader for instant feedback on your assignments.
Document Page
REFERENCES
Books and Journals:
Kostova, N., and et.al., 2018. The role of the financial analysis for management of the working
capital, receivables and creditworthiness of the company. Monographic library"
Knowledge and business" Varna.
Online:
Dupont formula. 2018. [Online]. Available through:
<https://www.readyratios.com/reference/profitability/dupont_formula.html>
3
Document Page
APPENDIX
Company Name Item 06/17 06/18
NRW Holdings
Limited EBITDA 5,88,44,000.00 9,34,56,000.00
Total Revenue Excluding Interest 37,02,97,000.00 68,54,31,000.00
Net profit margin 0.1589102801 0.1363463281
Total Revenue Excluding Interest 37,02,97,000.00 68,54,31,000.00
Total Assets 33,15,66,000.00 52,01,87,000.00
Assets turnover 1.116812339 1.3176626867
Total Assets 33,15,66,000.00 52,01,87,000.00
Total Equity 19,90,73,000.00 27,26,43,000.00
Financial leverage 1.6655498234 1.9079418874
Dupoint formula
Net profit margin*Assets
turnover*Financial leverage 0.2955900599 0.3427779184
Company Name Item 06/17 06/18
Reliance
Worldwide
Corporation
Limited EBITDA 12,06,85,000.00 13,00,79,000.00
Total Revenue Excluding Interest 60,20,46,000.00 78,02,62,000.00
Net profit margin 0.2004581045 0.1667119506
4
Document Page
Total Revenue Excluding Interest 60,20,46,000.00 78,02,62,000.00
Total Assets 59,97,87,000.00 2,18,59,44,000.00
Assets turnover 1.003766337 0.3569451001
Total Assets 59,97,87,000.00 2,18,59,44,000.00
Total Equity 20,47,46,000.00 1,32,40,19,000.00
Financial leverage 2.9294198666 1.6509914133
Dupoint formula
Net profit margin*Assets
turnover*Financial leverage 0.5894376447 0.098245569
5
chevron_up_icon
1 out of 7
circle_padding
hide_on_mobile
zoom_out_icon
logo.png

Your All-in-One AI-Powered Toolkit for Academic Success.

Available 24*7 on WhatsApp / Email

[object Object]