Report on Duque Papetiers Gros: Financial Analysis & Expansion Plan
VerifiedAdded on 2024/06/25
|16
|2577
|306
Report
AI Summary
This report provides a detailed analysis of Duque Papetiers Gros, utilizing MS Excel to evaluate the company's performance and potential for expansion. The analysis includes an overview of the wholesale stationers market in Germany, annual spending on writing and drawing materials, and a review of Duque's sales data from 2015 to 2017. It assesses the feasibility of expanding to Germany, considering international standards, costs of a new building, mean order value, and customer satisfaction. Correlation coefficients are used to forecast future sales, and calculations for mortgage repayment are performed using simple interest and APR methods. The report also emphasizes the importance of customer satisfaction and suggests implementing surveys to gather feedback and improve services.
Report for Duque Papetiers Gros
Date:
Date:
Paraphrase This Document
Need a fresh take? Get an instant paraphrase of this document with our AI Paraphraser
Contents
Introduction:................................................................................................................................................3
2. Analysis of Issues for Duque Papetiers Gros.......................................................................................4
2.1 An Overview of the Wholesale Stationers Market in Germany...................................................4
2.2 Annual Spending on Writing/Drawing Materials per Capita.......................................................5
2.3 Analysis of Duque’s last three financial years of sales data (2015-2017)....................................6
2.4 Feasibility of Expanding to Germany & International Standards.....................................................10
2.5 Costs of a New Building..................................................................................................................11
2.6 Mean Value of Orders.....................................................................................................................12
2.7 Customer Satisfaction......................................................................................................................14
3. Conclusions...........................................................................................................................................15
Reference list:............................................................................................................................................16
Introduction:
This report presents the analysis of Duque Papetiers Gros. For the purpose of analysis, MS Excel
of MS Office has been utilized. The analysis was done on the basis of actions of Duque Papetiers
Gros and the calculations are estimated by using the statistics. This analysis was done in order to
help the organization in better decision making and the outputs of the analysis will help Duque
Papetiers Gros to understand what needs to be done in order to improve market capture. The
analysis covered the calculation of gross sale of the years 2015 to 2017 and this analysis of gross
sales was used to predict the upcoming sales possibility in year 2018 and 2019. With the use of
simple interest analysis and APR method the repayment of the mortgage sum by the organisation
was calculated.
⊘ This is a preview!⊘
Do you want full access?
Subscribe today to unlock all pages.
Trusted by 1+ million students worldwide
2. Analysis of Issues for Duque Papetiers Gros
2.1 An Overview of the Wholesale Stationers Market in Germany
The stationary wholesale market of Germany is the strongest market which is made up of
chains of demands and supply that are well maintained by keeping the balance of both
demand and supply. The total earning which is also called the gross turnover of the
organization is around €14.8 B Per year. Germany is second on the list of costs of
Europe. Even after the presence of different brands in the market, the total sales of the
company has boosted up to 3.5% in the year 2015. The demand for the products of
Germany was increased by 5% in the international market and it also increased by 2.5%
in Germany itself.
The brand quality and customer services of the Germany products make it more preferable in the
countries. The products from Germany market are a complete package itself. They are the
best at fulfilling all the demands and requirements of the customers on a global scale.
Even after the better product quality and services, the market for stationery products has
been decreasing rapidly. The organization is also facing the tough competition from the
digital evolution in the current world.
The statistics data that concludes that there are more than 2500 brands that are present in the
market for stationery products which are also leading in terms of capital earning. This
organization sells every type of stationary products like a pen, paper, notebooks, pencils,
etc. the problem is not with the quality maintenance but the customer service of providing
them their required products and failure in this will cause company sales to decrease.
Paraphrase This Document
Need a fresh take? Get an instant paraphrase of this document with our AI Paraphraser

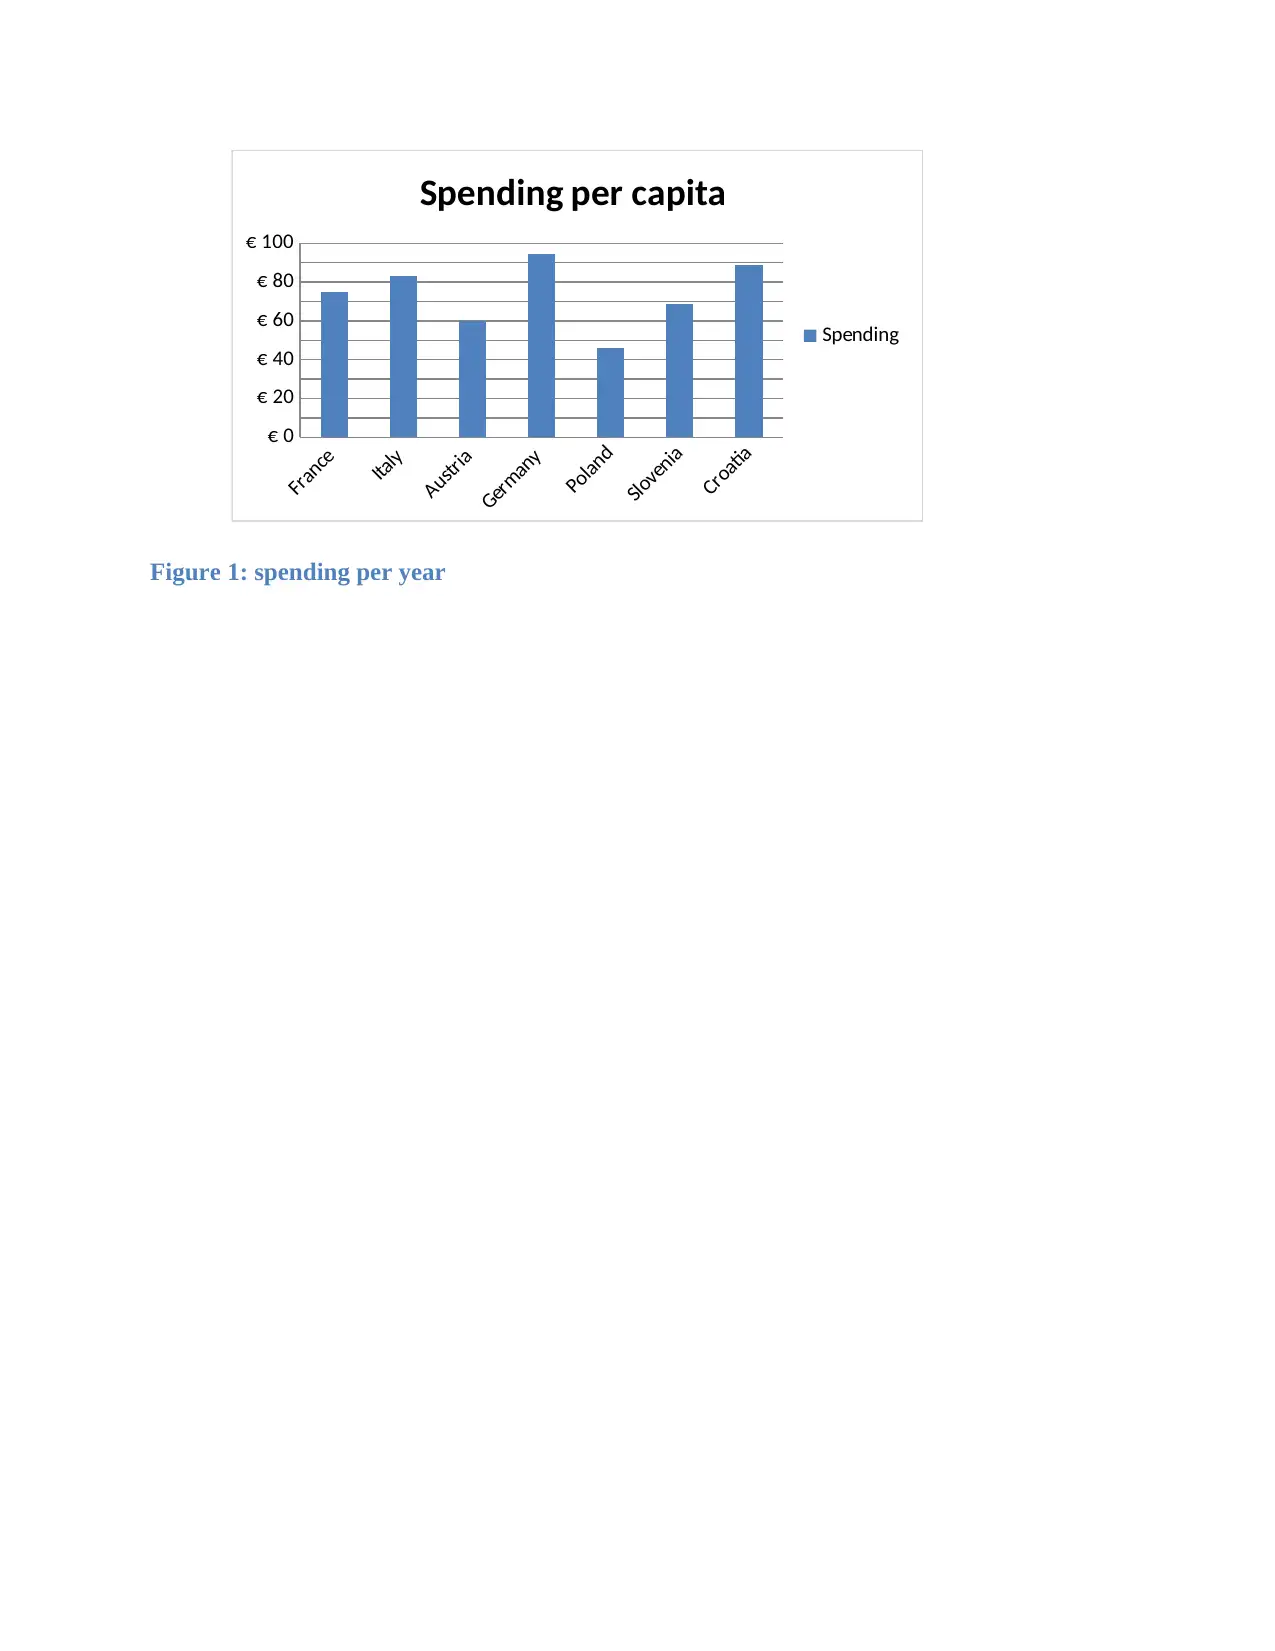
2.2 Annual Spending on Writing/Drawing Materials per Capita
There are a lot of brands in this business of stationery products that re also ruling in the
market. The market capture of the European brands is also very large in the field of
stationery business. They are having a high amount of capital in the sales of stationery
products.
The following table shows the list of countries that are having a great share of the market
in the field of selling stationery products:
Table 1: annual spending
Countries Spending
France € 75
Italy € 83.40
Austria € 59.80
Germany € 94.55
Poland € 45.76
Slovenia € 68.88
Croatia € 89
The table above shows the amount of spending on the stationary material per capita, this
table is describing the spending of 7 different countries with Croatia having the highest
spending amount of € 89 and Austria having the spending of € 59.80 only. The chart
shown below represents the change in annual spending.
France
Italy
Austria
Germany
Poland
Slovenia
Croatia
€ 0
€ 20
€ 40
€ 60
€ 80
€ 100
Spending per capita
Spending
Figure 1: spending per year
Italy
Austria
Germany
Poland
Slovenia
Croatia
€ 0
€ 20
€ 40
€ 60
€ 80
€ 100
Spending per capita
Spending
Figure 1: spending per year
⊘ This is a preview!⊘
Do you want full access?
Subscribe today to unlock all pages.
Trusted by 1+ million students worldwide
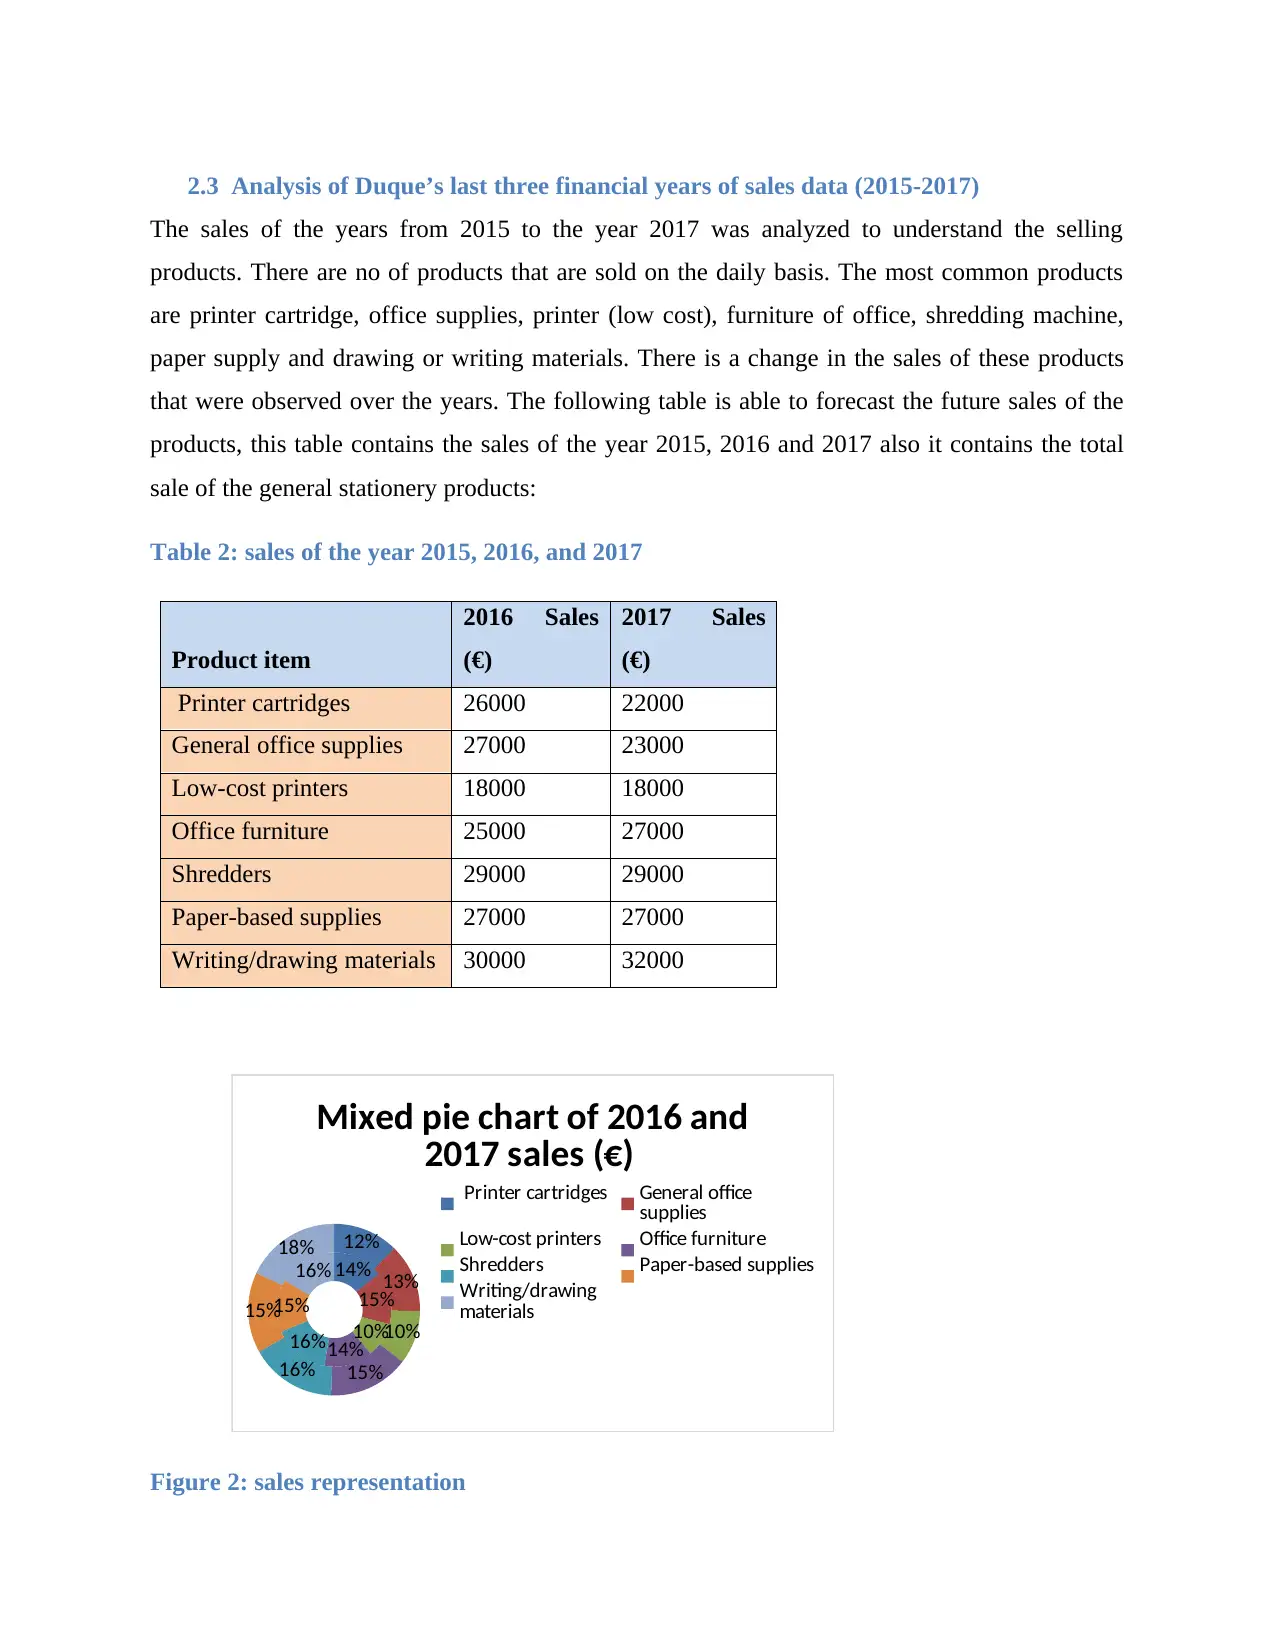
2.3 Analysis of Duque’s last three financial years of sales data (2015-2017)
The sales of the years from 2015 to the year 2017 was analyzed to understand the selling
products. There are no of products that are sold on the daily basis. The most common products
are printer cartridge, office supplies, printer (low cost), furniture of office, shredding machine,
paper supply and drawing or writing materials. There is a change in the sales of these products
that were observed over the years. The following table is able to forecast the future sales of the
products, this table contains the sales of the year 2015, 2016 and 2017 also it contains the total
sale of the general stationery products:
Table 2: sales of the year 2015, 2016, and 2017
Product item
2016 Sales
(€)
2017 Sales
(€)
Printer cartridges 26000 22000
General office supplies 27000 23000
Low-cost printers 18000 18000
Office furniture 25000 27000
Shredders 29000 29000
Paper-based supplies 27000 27000
Writing/drawing materials 30000 32000
14%
15%
10%
14%16%
15%
16%
12%
13%
10%
15%16%
15%
18%
Mixed pie chart of 2016 and
2017 sales (€)
Printer cartridges General office
supplies
Low-cost printers Office furniture
Shredders Paper-based supplies
Writing/drawing
materials
Figure 2: sales representation
Paraphrase This Document
Need a fresh take? Get an instant paraphrase of this document with our AI Paraphraser
The total sales for the year 2016 and 2017 are shown using the above pie chart.
Total sales for the products are:
Table 3: total sales product wise
Product item Total Sales (€)
printer cartridges 73000
general office supplies 75000
low-cost printers 51000
office furniture 77000
Shredders 83000
paper-based supplies 79000
writing/drawing
materials 87000
Total Sales (€)
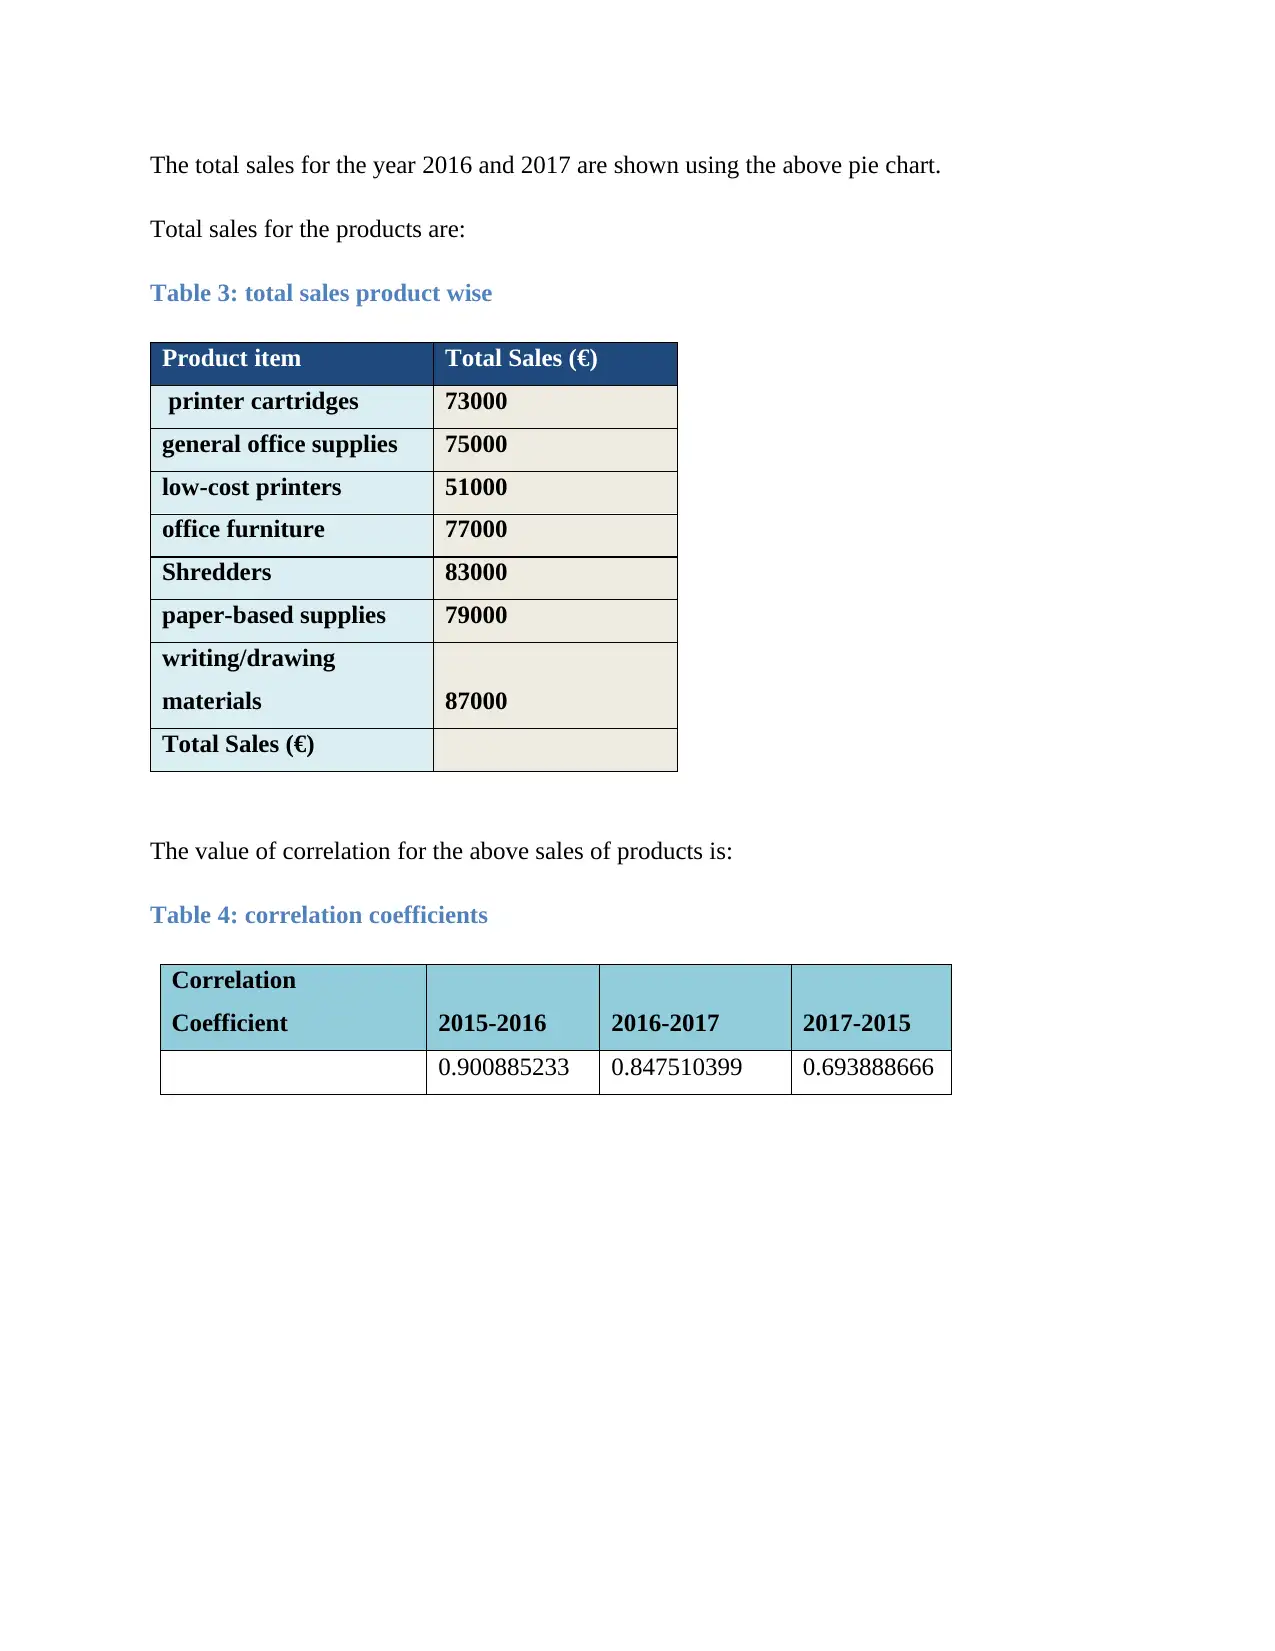
The value of correlation for the above sales of products is:
Table 4: correlation coefficients
Correlation
Coefficient 2015-2016 2016-2017 2017-2015
0.900885233 0.847510399 0.693888666
Total sales for the products are:
Table 3: total sales product wise
Product item Total Sales (€)
printer cartridges 73000
general office supplies 75000
low-cost printers 51000
office furniture 77000
Shredders 83000
paper-based supplies 79000
writing/drawing
materials 87000
Total Sales (€)
The value of correlation for the above sales of products is:
Table 4: correlation coefficients
Correlation
Coefficient 2015-2016 2016-2017 2017-2015
0.900885233 0.847510399 0.693888666
2015-2016 2016-2017 2017-2015
0
0.1
0.2
0.3
0.4
0.5
0.6
0.7
0.8
0.9
1
Series1
Figure 3: correlation representation
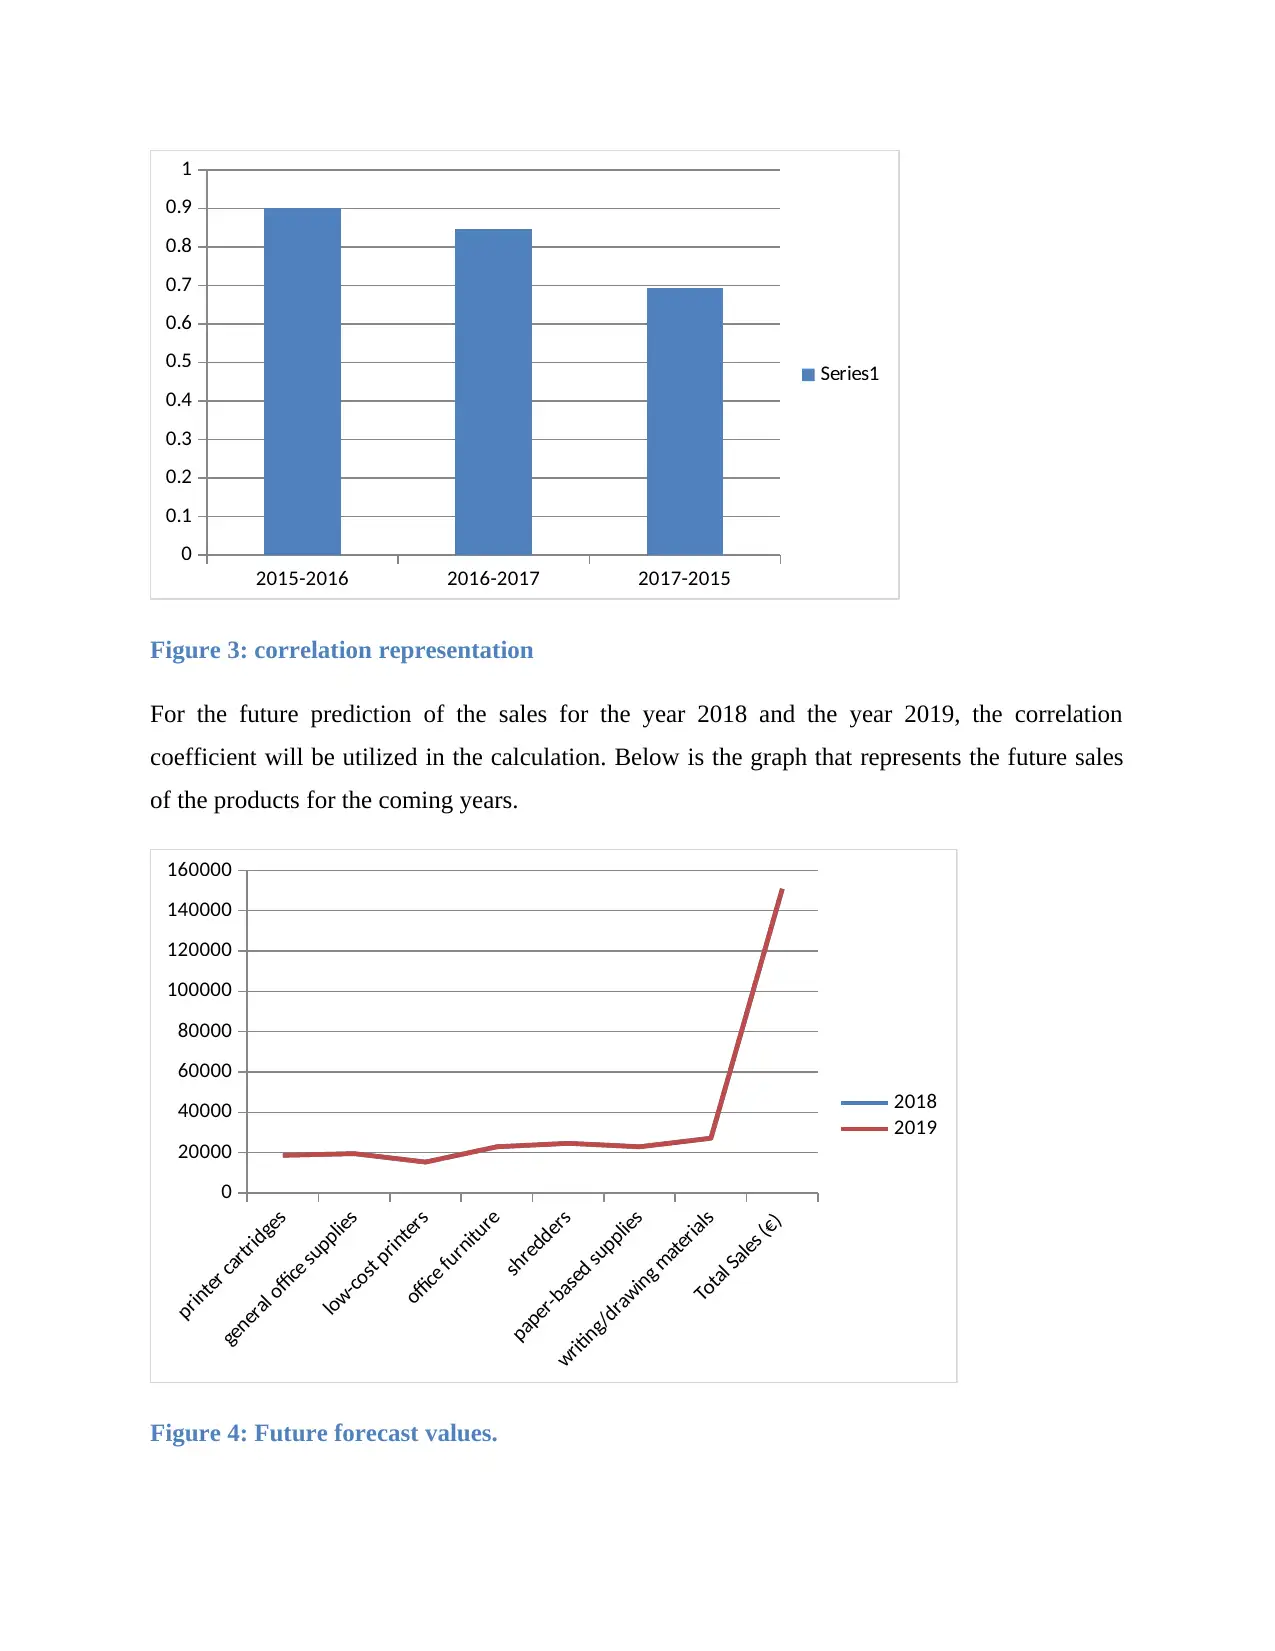
For the future prediction of the sales for the year 2018 and the year 2019, the correlation
coefficient will be utilized in the calculation. Below is the graph that represents the future sales
of the products for the coming years.
printer cartridges
general office supplies
low-cost printers
office furniture
shredders
paper-based supplies
writing/drawing materials
Total Sales (€)
0
20000
40000
60000
80000
100000
120000
140000
160000
2018
2019
Figure 4: Future forecast values.
0
0.1
0.2
0.3
0.4
0.5
0.6
0.7
0.8
0.9
1
Series1
Figure 3: correlation representation
For the future prediction of the sales for the year 2018 and the year 2019, the correlation
coefficient will be utilized in the calculation. Below is the graph that represents the future sales
of the products for the coming years.
printer cartridges
general office supplies
low-cost printers
office furniture
shredders
paper-based supplies
writing/drawing materials
Total Sales (€)
0
20000
40000
60000
80000
100000
120000
140000
160000
2018
2019
Figure 4: Future forecast values.
⊘ This is a preview!⊘
Do you want full access?
Subscribe today to unlock all pages.
Trusted by 1+ million students worldwide
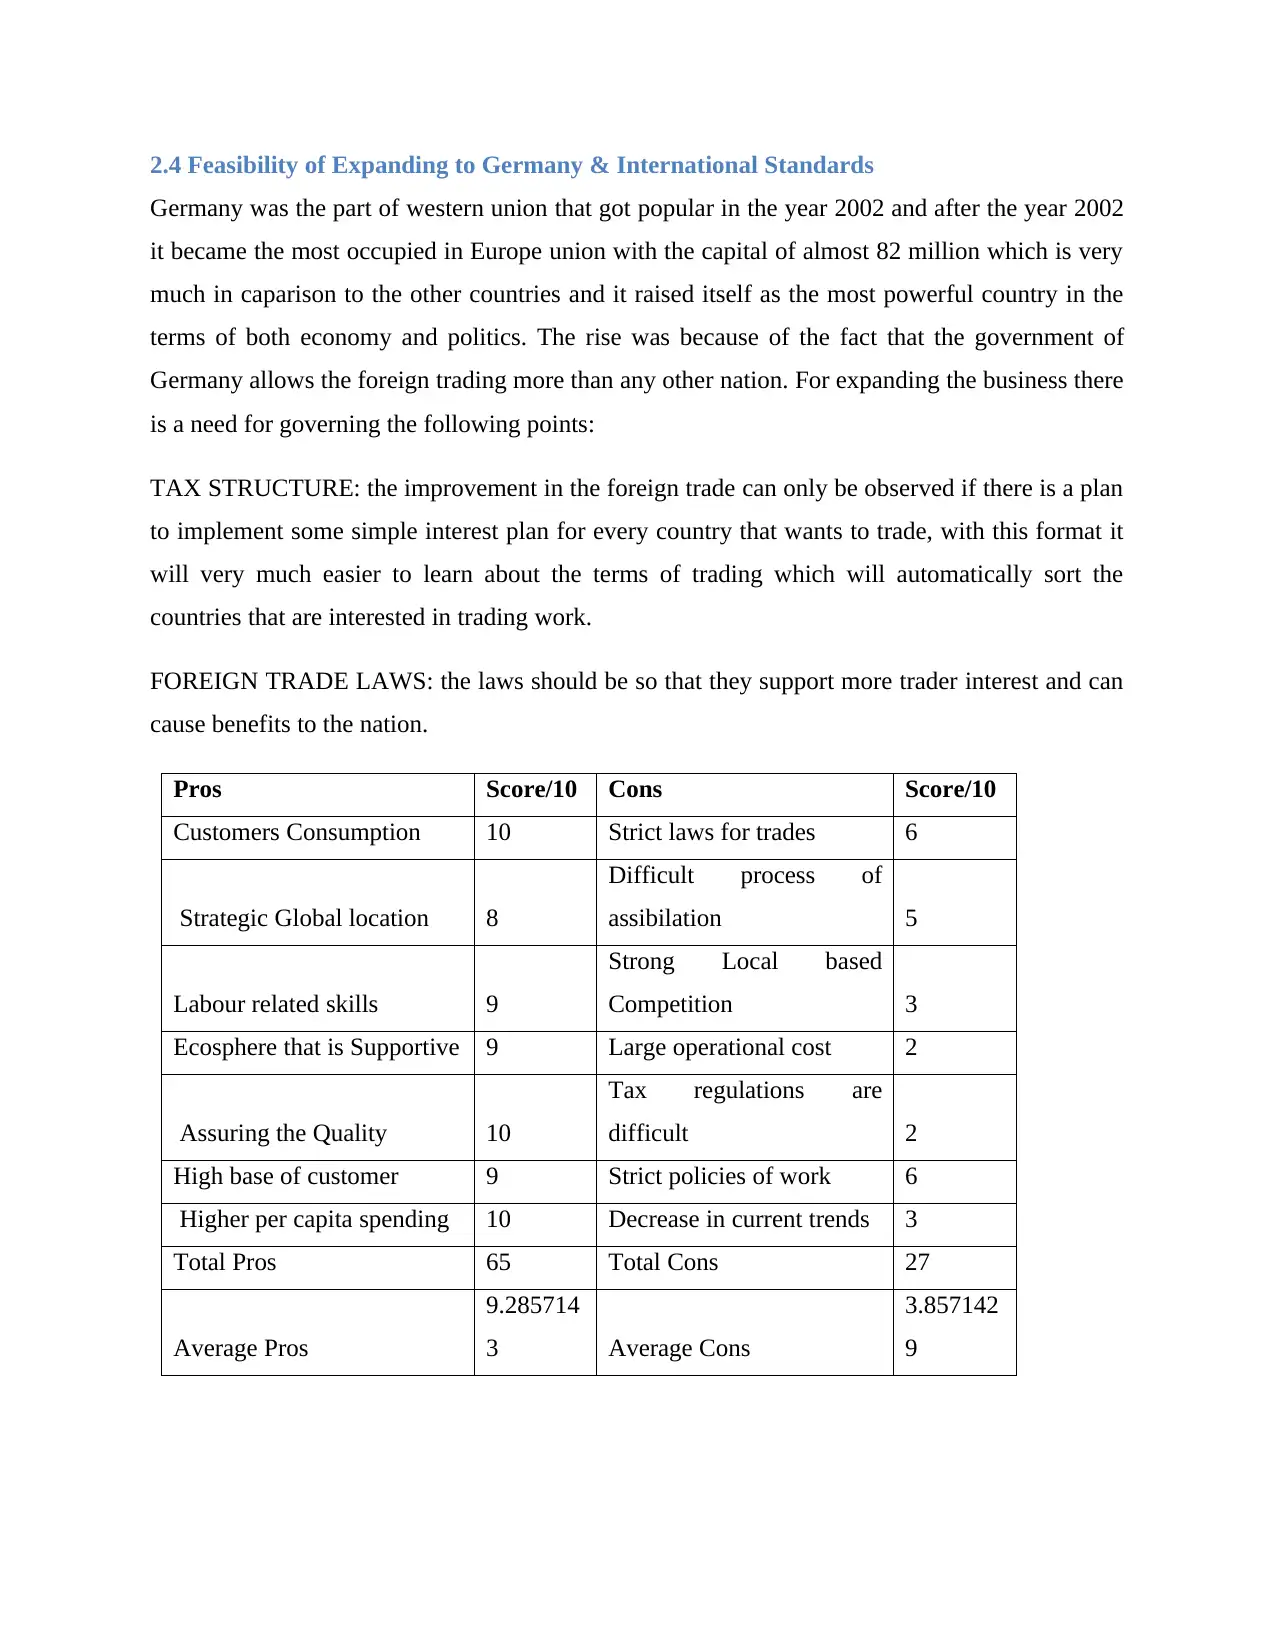
2.4 Feasibility of Expanding to Germany & International Standards
Germany was the part of western union that got popular in the year 2002 and after the year 2002
it became the most occupied in Europe union with the capital of almost 82 million which is very
much in caparison to the other countries and it raised itself as the most powerful country in the
terms of both economy and politics. The rise was because of the fact that the government of
Germany allows the foreign trading more than any other nation. For expanding the business there
is a need for governing the following points:
TAX STRUCTURE: the improvement in the foreign trade can only be observed if there is a plan
to implement some simple interest plan for every country that wants to trade, with this format it
will very much easier to learn about the terms of trading which will automatically sort the
countries that are interested in trading work.
FOREIGN TRADE LAWS: the laws should be so that they support more trader interest and can
cause benefits to the nation.
Pros Score/10 Cons Score/10
Customers Consumption 10 Strict laws for trades 6
Strategic Global location 8
Difficult process of
assibilation 5
Labour related skills 9
Strong Local based
Competition 3
Ecosphere that is Supportive 9 Large operational cost 2
Assuring the Quality 10
Tax regulations are
difficult 2
High base of customer 9 Strict policies of work 6
Higher per capita spending 10 Decrease in current trends 3
Total Pros 65 Total Cons 27
Average Pros
9.285714
3 Average Cons
3.857142
9
Paraphrase This Document
Need a fresh take? Get an instant paraphrase of this document with our AI Paraphraser
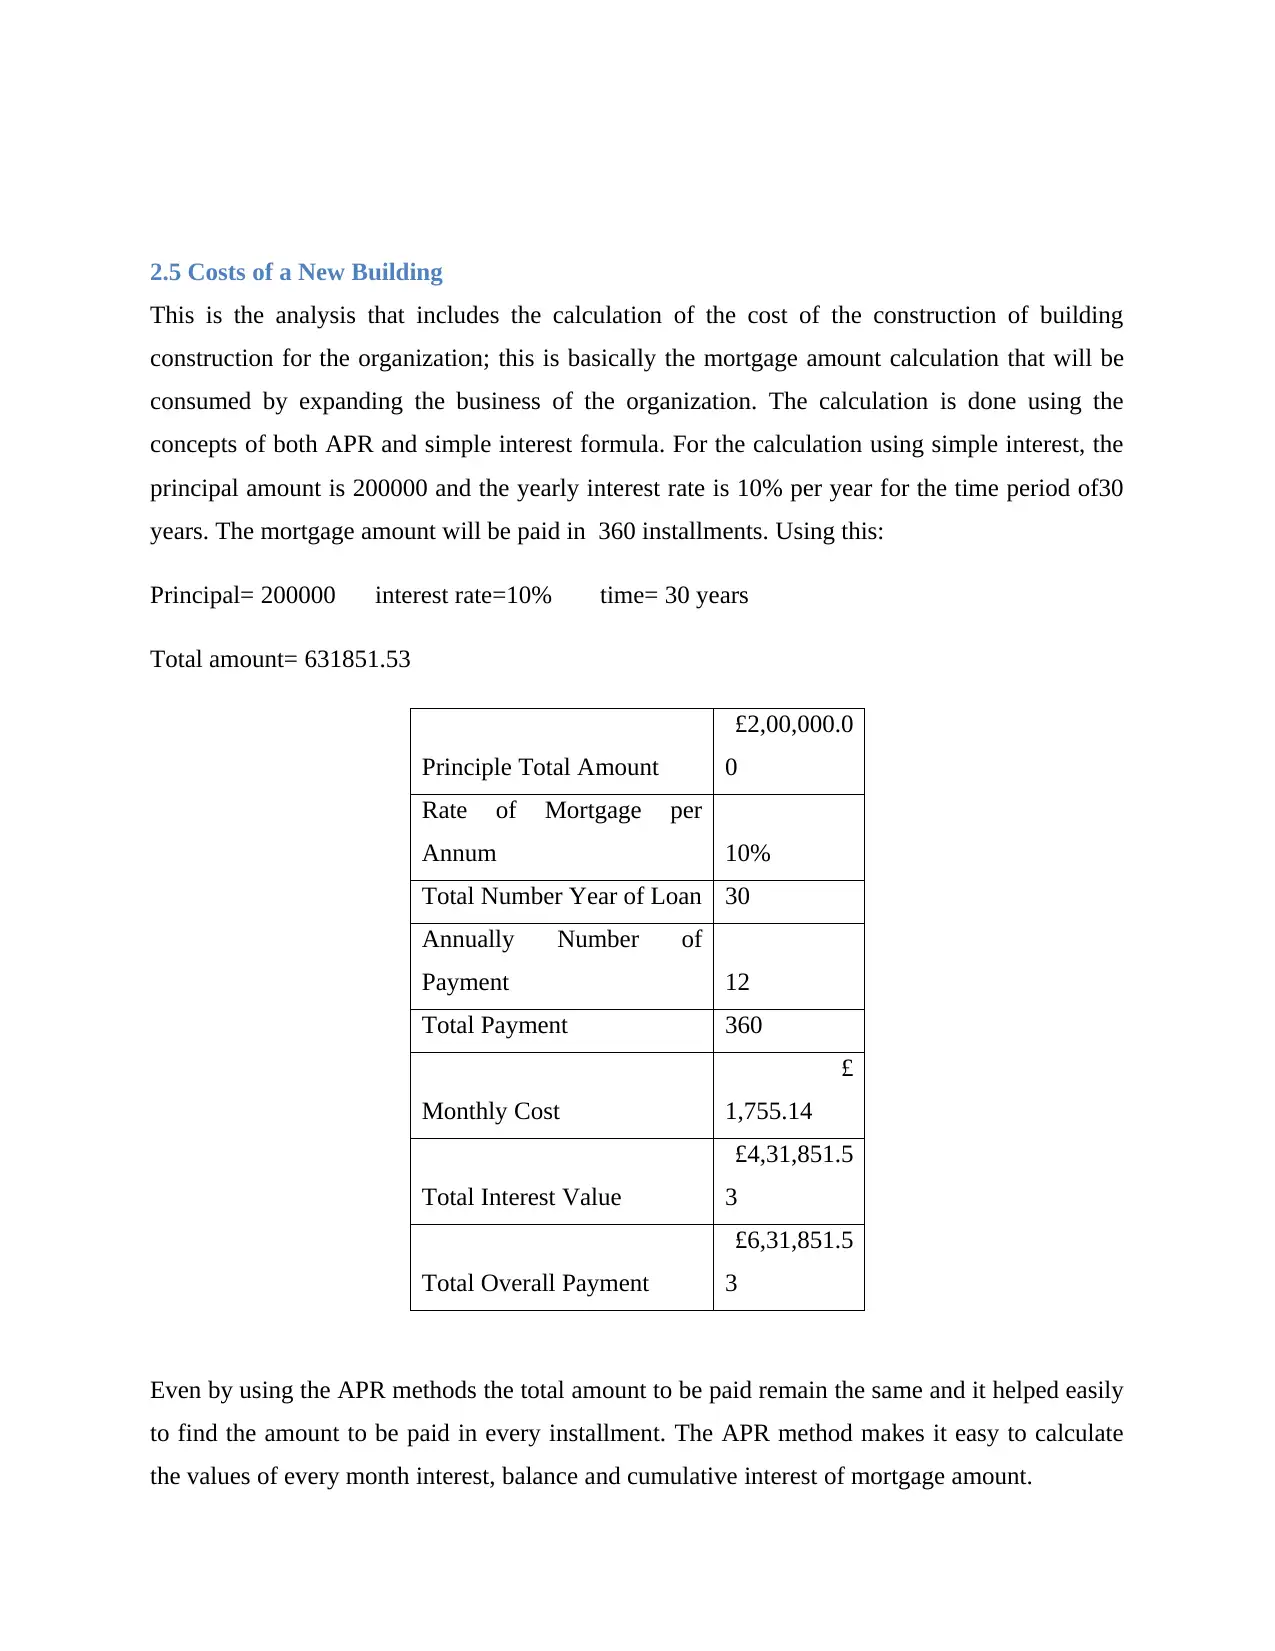
2.5 Costs of a New Building
This is the analysis that includes the calculation of the cost of the construction of building
construction for the organization; this is basically the mortgage amount calculation that will be
consumed by expanding the business of the organization. The calculation is done using the
concepts of both APR and simple interest formula. For the calculation using simple interest, the
principal amount is 200000 and the yearly interest rate is 10% per year for the time period of30
years. The mortgage amount will be paid in 360 installments. Using this:
Principal= 200000 interest rate=10% time= 30 years
Total amount= 631851.53
Principle Total Amount
£2,00,000.0
0
Rate of Mortgage per
Annum 10%
Total Number Year of Loan 30
Annually Number of
Payment 12
Total Payment 360
Monthly Cost
£
1,755.14
Total Interest Value
£4,31,851.5
3
Total Overall Payment
£6,31,851.5
3
Even by using the APR methods the total amount to be paid remain the same and it helped easily
to find the amount to be paid in every installment. The APR method makes it easy to calculate
the values of every month interest, balance and cumulative interest of mortgage amount.
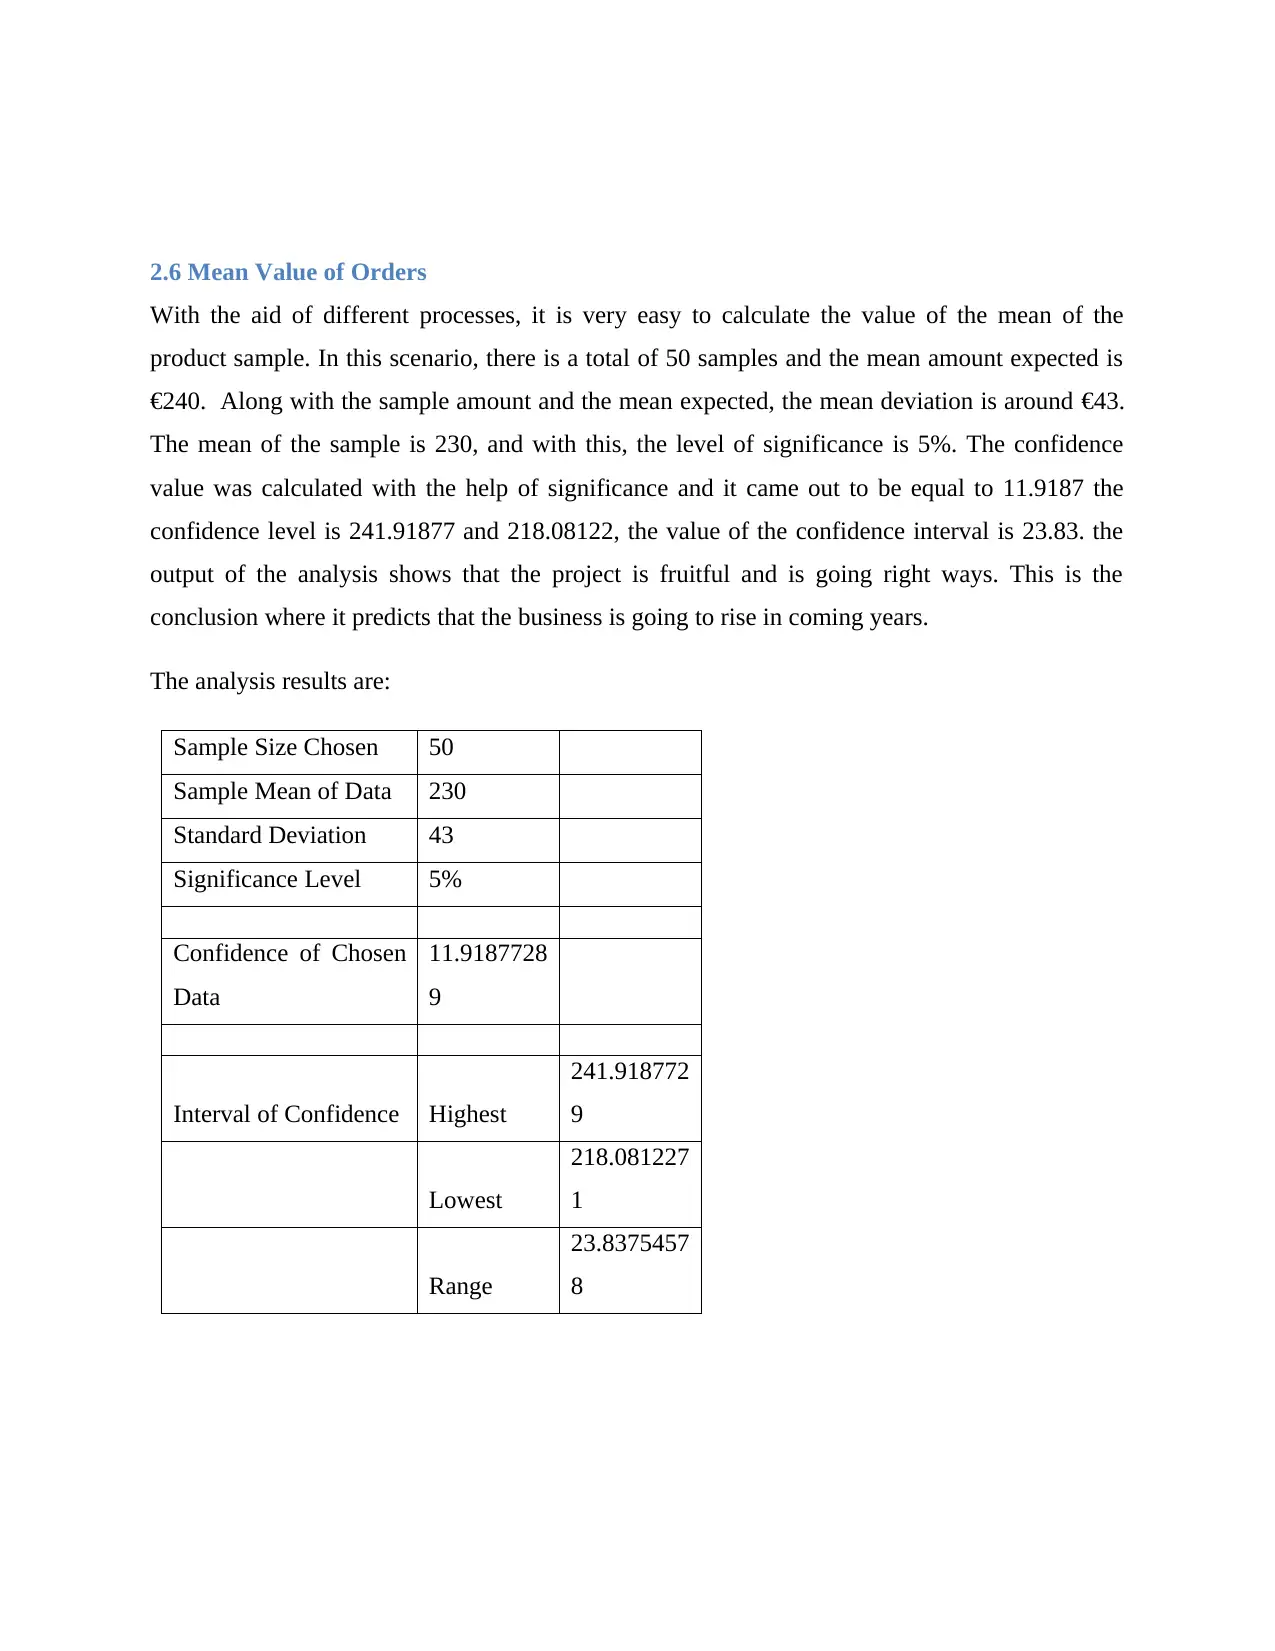
2.6 Mean Value of Orders
With the aid of different processes, it is very easy to calculate the value of the mean of the
product sample. In this scenario, there is a total of 50 samples and the mean amount expected is
€240. Along with the sample amount and the mean expected, the mean deviation is around €43.
The mean of the sample is 230, and with this, the level of significance is 5%. The confidence
value was calculated with the help of significance and it came out to be equal to 11.9187 the
confidence level is 241.91877 and 218.08122, the value of the confidence interval is 23.83. the
output of the analysis shows that the project is fruitful and is going right ways. This is the
conclusion where it predicts that the business is going to rise in coming years.
The analysis results are:
Sample Size Chosen 50
Sample Mean of Data 230
Standard Deviation 43
Significance Level 5%
Confidence of Chosen
Data
11.9187728
9
Interval of Confidence Highest
241.918772
9
Lowest
218.081227
1
Range
23.8375457
8
⊘ This is a preview!⊘
Do you want full access?
Subscribe today to unlock all pages.
Trusted by 1+ million students worldwide
1 out of 16
Related Documents


Your All-in-One AI-Powered Toolkit for Academic Success.
+13062052269
info@desklib.com
Available 24*7 on WhatsApp / Email
![[object Object]](/_next/static/media/star-bottom.7253800d.svg)
Unlock your academic potential
Copyright © 2020–2026 A2Z Services. All Rights Reserved. Developed and managed by ZUCOL.