Duque Papetiers Gros: German Market Analysis and Feasibility
VerifiedAdded on 2023/05/28
|17
|3450
|193
Report
AI Summary
This report assesses the German stationery market for Duque Papetiers Gros, aiming to aid Donald Duque in international expansion. It analyzes historical sales data, market trends, and potential challenges and benefits of expanding into Germany. The report includes an overview of the wholesale stationers market, annual spending on writing and drawing materials, and an analysis of Duque’s financial performance from 2015-2017, including total sales, pie charts, scatter diagrams, and sales forecasts for 2018 and 2019. It also evaluates the feasibility of expanding to Germany, considering internal standards, costs of a new building using mortgage calculations, mean value of orders, and customer satisfaction, providing a comprehensive analysis to inform Duque's decision-making process. The report also touches upon ISO standards applicable to Duque's activities.
Report for Duque Papetiers Gros
Date:
Date:
Paraphrase This Document
Need a fresh take? Get an instant paraphrase of this document with our AI Paraphraser

Report for Duque Papetiers Gros 2018
1. Introduction
The assessment aims in evaluating the overall stationery market in Germany, which could
help Donald Duque to expand his overall business internationally. The report directly helps in
evaluating the current sales of the stationery market by analyzing historical sales of the
companies operating in the industry. The study provides Donald Duque the adequate
information regarding the current limitations and benefits which could be experienced with
the expansion plans. Moreover, relevant information regarding the standard deviation and
other hypothesis is relatively presented to allow the organization analyses the current
operational condition and make adequate decisions regarding the expansion plan.
2. Analysis of Issues for Duque Papetiers Gros
2.1 An Overview of the Wholesale Stationers Market in Germany
According to the annual spending for writing and drawing materials, Germany is considered
second only to Switzerland as per the data of MGCC. Germany's overall turnover in writing
and drawing materials is relatively at the level 148 Billion, which directly represents the
strong brands that are currently present in the country, which can proximately generate
highest scenes in future. The domestic demand has relatively increased by 2.5 % in the year
2015, which is detected in MGCC report. Hence, it would be understood that the stationery
branded companies operating in Germany is consider a brand image around the world, which
is a relatively allowed wholesale company of 2,200 to spur in the country. German stationery
brand has a relatively improved their market share, as compared to other private labels,
where the companies currently have a net turnover of not less than 500,000 on yearly basis.
This relatively indicates that the overall progress of the stationary industry has relatively
boosted in Germany, which helped in accumulating 5,500 specialist retailers in the region. The
stationery industry has a relatively boosted SC due to the alterations in the current purchasing
habits of the customers. The inclusion of online presence has relatively allowed companies in
the stationary industry to target potential customers and deliver the product at the door
steps. This method has relatively opened new grounds for the stationery industry, which
allows them to generate higher revenues.
1

Report for Duque Papetiers Gros 2018
2.2 Annual Spending on Writing/Drawing Materials per Capita
Switzerland
Germany
Austria
France
Slovenia
Italy
Slovakia
Hungary
Spain
Poland
Croatia
Czech Republic
£-
£5.00
£10.00
£15.00
£20.00
£25.00
£30.00
£35.00
£40.00
£35.50 £35.20 £35.00
£28.30
£20.40
£18.60
£9.80 £9.60 £8.90 £8.50 £7.90 £7.60
Country Value
Switzerland £ 35.50
Germany £ 35.20
Austria £ 35.00
France £ 28.30
Slovenia £ 20.40
Italy £ 18.60
Slovakia £ 9.80
Hungary £ 9.60
Spain £ 8.90
Poland £ 8.50
Croatia £ 7.90
Czech
Republic
£ 7.60
The bar graph and table relatively represent the overall spending of the European
countries in drawing and writing material. The major spender from the overall European
countries Is Switzerland, while the least spender is Czech Republic. France and Germany are
also listed in the above graph, which indicates the level of spending that has been conducted
by both the countries. This information can be utilized by the organization for adequately
improving their decision-making capability to raise their revenue generation capability.
2
⊘ This is a preview!⊘
Do you want full access?
Subscribe today to unlock all pages.
Trusted by 1+ million students worldwide

Report for Duque Papetiers Gros 2018
3
3
Paraphrase This Document
Need a fresh take? Get an instant paraphrase of this document with our AI Paraphraser

Report for Duque Papetiers Gros 2018
2.3 Analysis of Duque’s last three financial years of sales data (2015-2017)
a) Providing Total sales for 2015, 2016 and 2047:
Product item 2015 Sales
(€)
2016 Sales
(€)
2017 Sales (€)
printer cartridges 25000 26000 22000
general office supplies 25000 27000 23000
low-cost printers 15000 18000 18000
office furniture 25000 25000 27000
shredders 25000 29000 29000
paper-based supplies 25000 27000 27000
writing/drawing materials 25000 30000 32000
Total Sales 165000 182000 178000
The use of [SUM()] function in excel is mainly used for calculating the overall total
sales for each year. This function has relevantly helped in calculating the total sales for 2015,
2016 and 2017.
b) Providing appropriate mixed pie chart for 2016 and 2017:
printer cartridges
14%
general office supplies
15%
low-cost printers
10%
office furniture
14%
shredders
16%
paper-based supplies
15%
writing/drawing
materials
16%
2016 Sales (€)
4
Report for Duque Papetiers Gros 2018
printer cartridges
12%
general office supplies
13%
low-cost printers
10%
office furniture
15%
shredders
16%
paper-based supplies
15%
writing/drawing
materials
18%
2017 Sales (€)
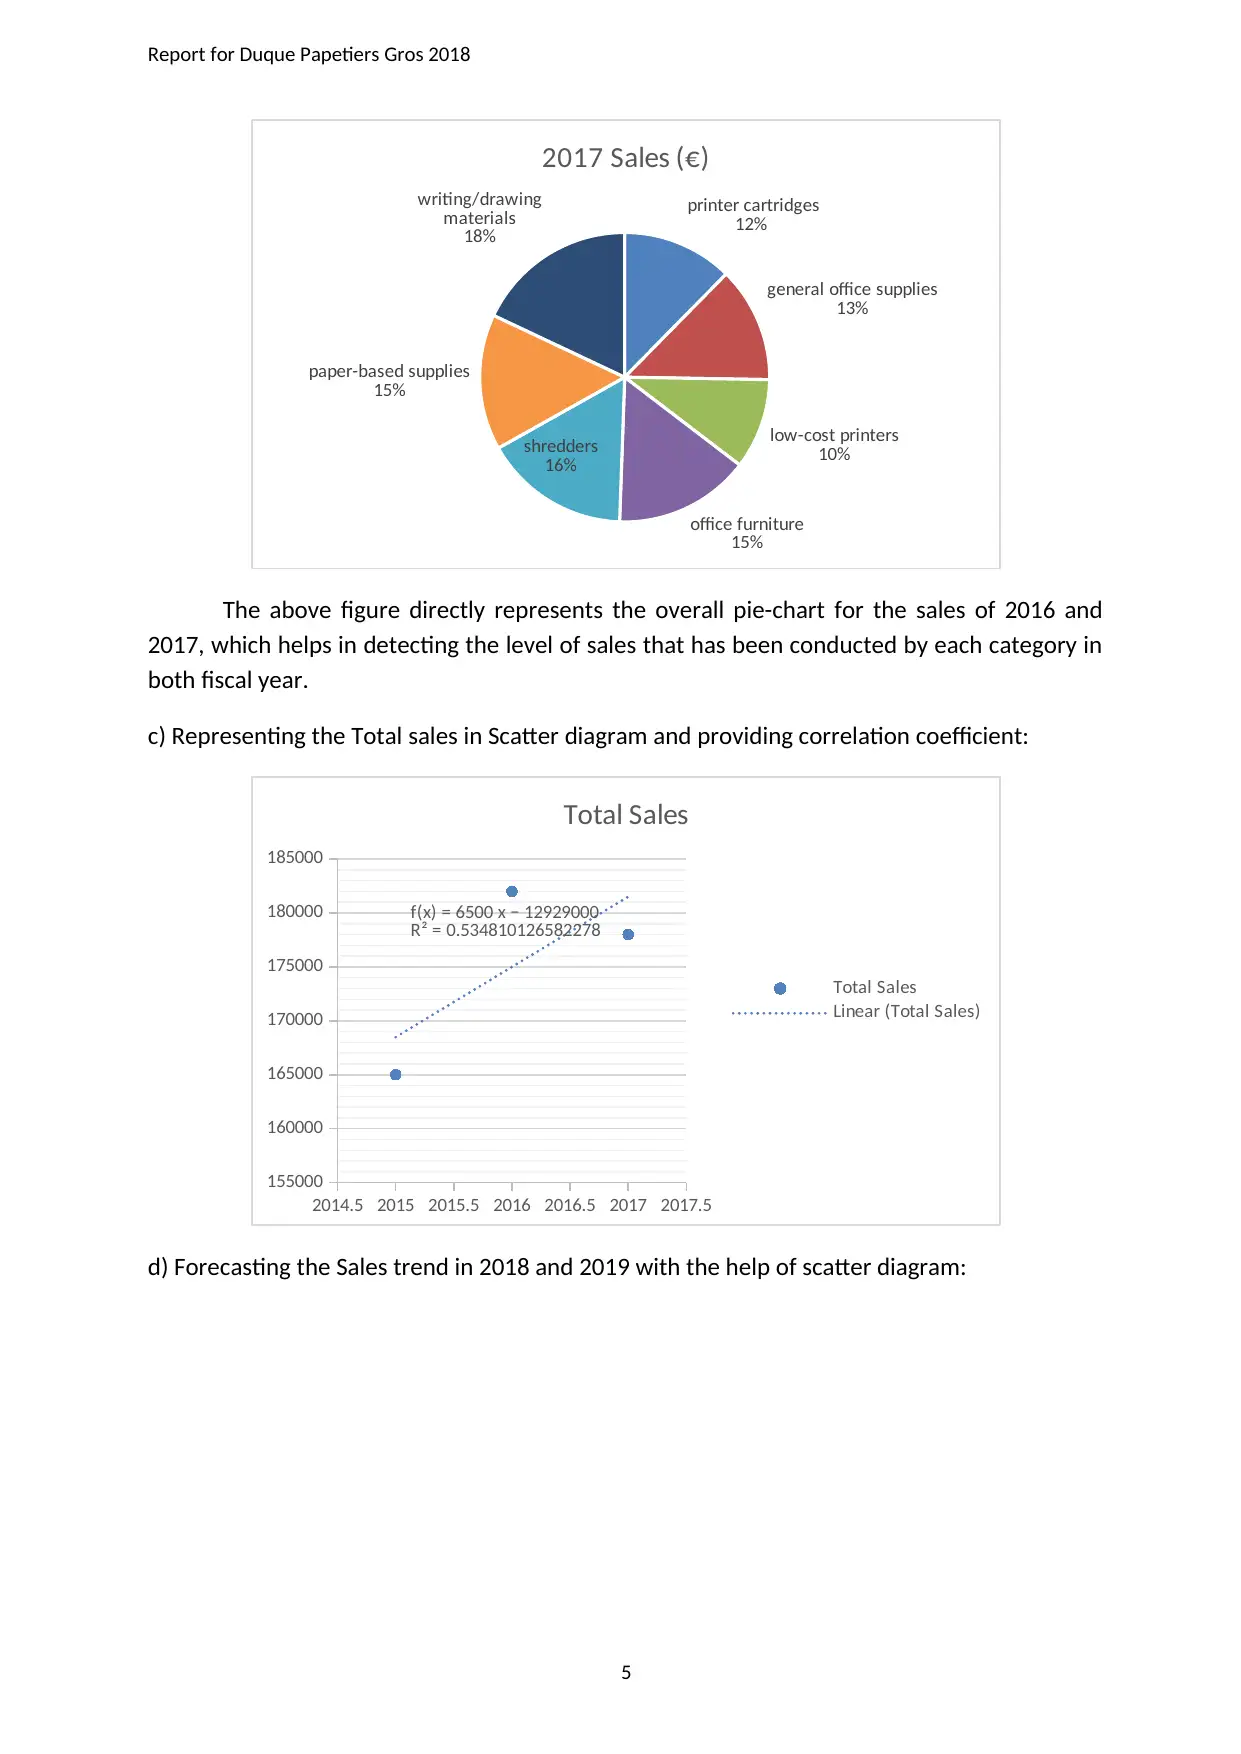
The above figure directly represents the overall pie-chart for the sales of 2016 and
2017, which helps in detecting the level of sales that has been conducted by each category in
both fiscal year.
c) Representing the Total sales in Scatter diagram and providing correlation coefficient:
2014.5 2015 2015.5 2016 2016.5 2017 2017.5
155000
160000
165000
170000
175000
180000
185000
f(x) = 6500 x − 12929000
R² = 0.534810126582278
Total Sales
Total Sales
Linear (Total Sales)
d) Forecasting the Sales trend in 2018 and 2019 with the help of scatter diagram:
5
printer cartridges
12%
general office supplies
13%
low-cost printers
10%
office furniture
15%
shredders
16%
paper-based supplies
15%
writing/drawing
materials
18%
2017 Sales (€)
The above figure directly represents the overall pie-chart for the sales of 2016 and
2017, which helps in detecting the level of sales that has been conducted by each category in
both fiscal year.
c) Representing the Total sales in Scatter diagram and providing correlation coefficient:
2014.5 2015 2015.5 2016 2016.5 2017 2017.5
155000
160000
165000
170000
175000
180000
185000
f(x) = 6500 x − 12929000
R² = 0.534810126582278
Total Sales
Total Sales
Linear (Total Sales)
d) Forecasting the Sales trend in 2018 and 2019 with the help of scatter diagram:
5
⊘ This is a preview!⊘
Do you want full access?
Subscribe today to unlock all pages.
Trusted by 1+ million students worldwide

Report for Duque Papetiers Gros 2018
2014.5 2015 2015.5 2016 2016.5 2017 2017.5
155000
160000
165000
170000
175000
180000
185000
f(x) = 6500 x − 12929000
R² = 0.534810126582278
Total Sales Forecast
Total Sales
Linear (Total Sales)
Axis Title
Axis Title
Particulars 2018 2019
X (A) 6500 6500
Forecasting year (B) 2018 2019
Intercept (C) -1E+07 -1E+07
Forecasted Total sales (D=C+A*B) 188,00
0
194,500
The figure represents the trend line for the total sales hat has been achieved by the
company over the period of three fiscal year. The above table and figure relevantly help in
detecting the level of forecasted sales for the company on continuous sales trend basis. Based
on the trend analysis the overall forecasted sales value of the company for 2018 is mainly at
the levels of 188,000 and 194,500. The calculation is mainly conducted with the help of the
trend line equation [y=6500x – 1E+07], where x is the year in which the amount is calculated.
2.4 Feasibility of Expanding to Germany & International Standards
a) Completing the Table:
Should I expand my business to Belgium & Germany?
Pros Score/10 Cons Score/10
The expansion process would
eventually help in improving the
customer base and raise the level
of revenues that can be generated
from operations.
10
The major problem is detected
from the geographical locations,
which can be a major problem
for the organisation.
4
The workforce in both Germany
and Belgium is relevantly high, as
both the countries support the
stationary market.
8
The presence of alternative
language and might influence
the communication condition of
the organisation in both
Germany and Belgium
5
The investment would eventually
raise the exposure level of the
company in foreign land and
4 Th problems in foreign exchange
can also negatively affect the
revenues of the company
7
6
Paraphrase This Document
Need a fresh take? Get an instant paraphrase of this document with our AI Paraphraser
Report for Duque Papetiers Gros 2018
generate high level of income
from investment
The relevant diversification can be
conducted when expanding the
business to Belgium and Germany,
as the countries provide higher
growth prospects in the long run.
3
The competition in the internal
market is relevantly high, which
can negative impact the
company current operations
condition.
4
Improvising the operational level
in different countries would
eventually raise the goodwill of
the organisation
7
There is a possibility of high
initial cost, which can raise the
level of expense and reduce cash
position of the company.
4
The organisation could smoothly
increase the required finance for
the expansion process, as
Germany is considered one of the
largest markets for stationary
industry
9
There is a special challenge of
the continuous innovation and
diversification, which needs to
be maintained by the company.
3
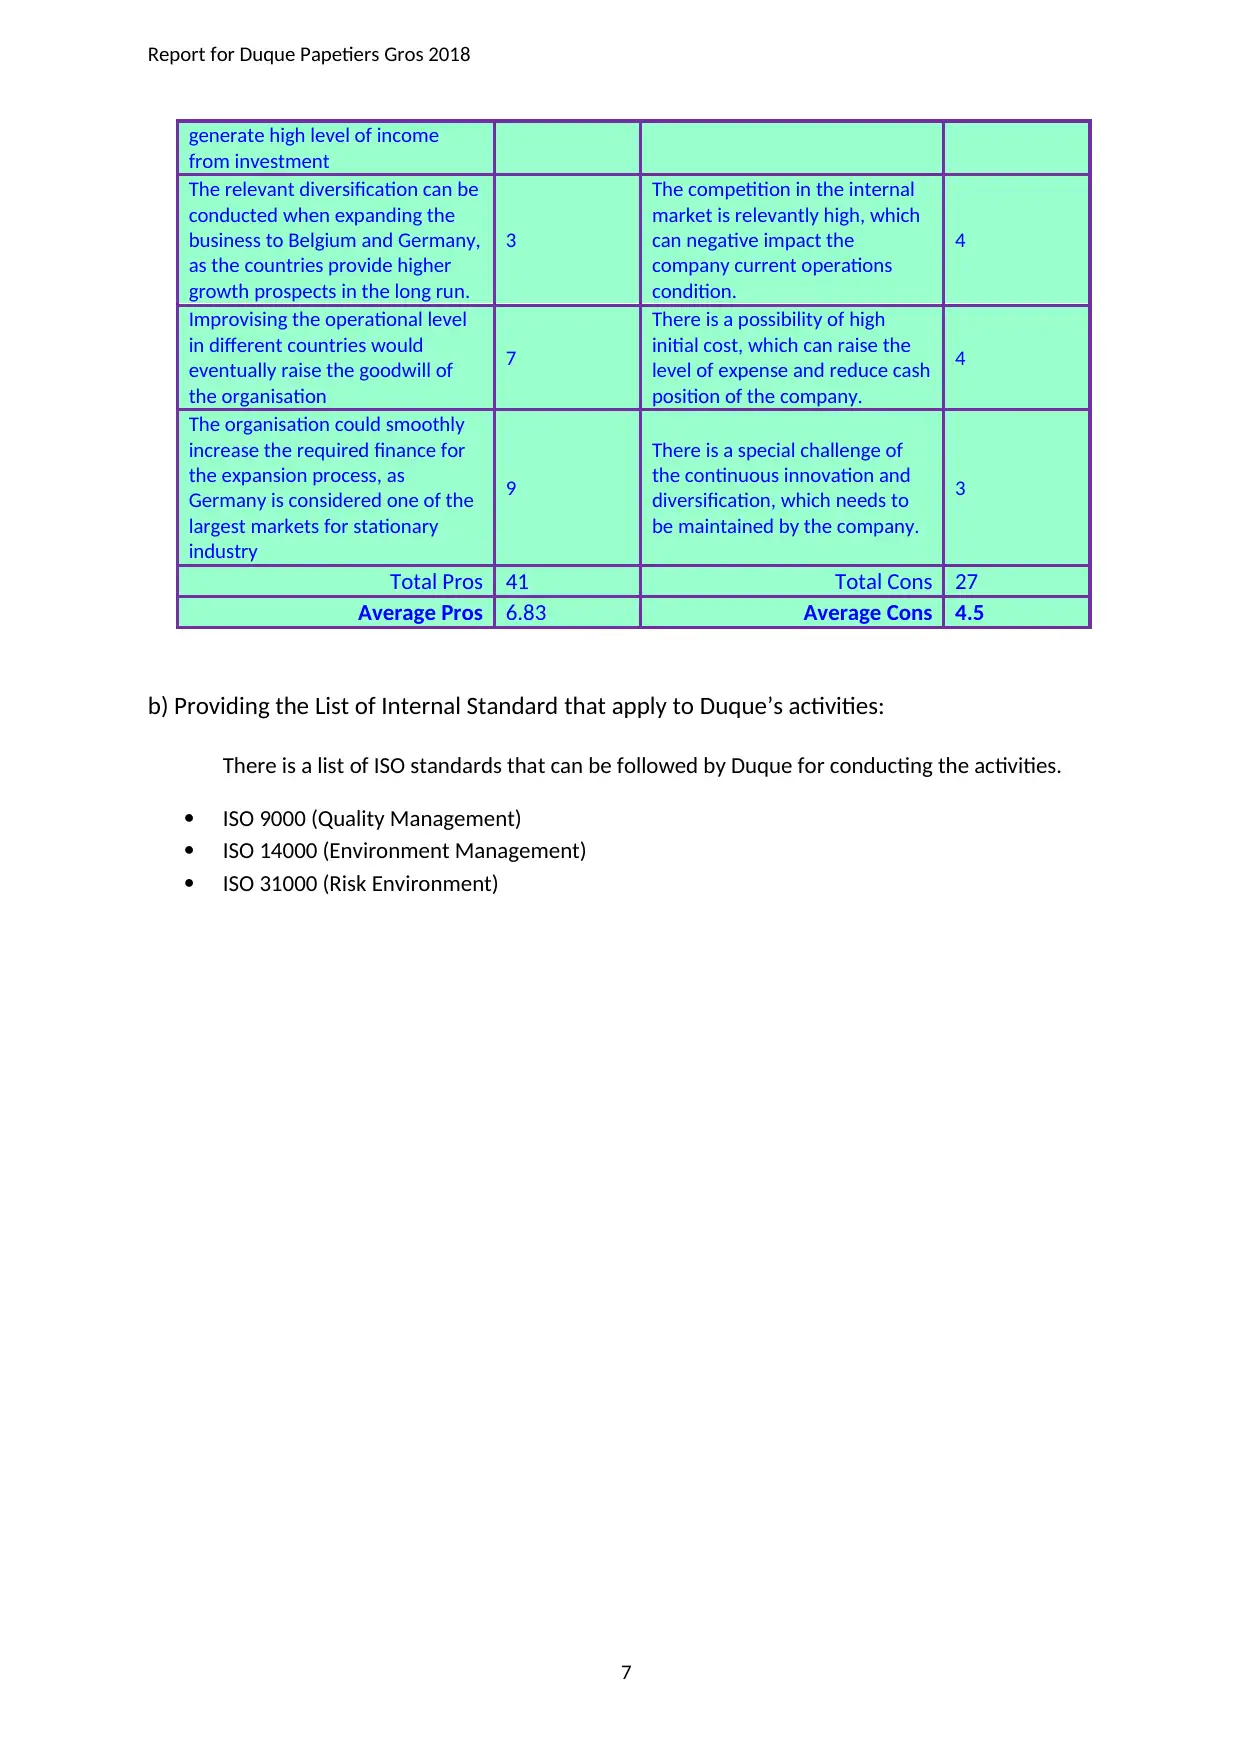
Total Pros 41 Total Cons 27
Average Pros 6.83 Average Cons 4.5
b) Providing the List of Internal Standard that apply to Duque’s activities:
There is a list of ISO standards that can be followed by Duque for conducting the activities.
ISO 9000 (Quality Management)
ISO 14000 (Environment Management)
ISO 31000 (Risk Environment)
7
generate high level of income
from investment
The relevant diversification can be
conducted when expanding the
business to Belgium and Germany,
as the countries provide higher
growth prospects in the long run.
3
The competition in the internal
market is relevantly high, which
can negative impact the
company current operations
condition.
4
Improvising the operational level
in different countries would
eventually raise the goodwill of
the organisation
7
There is a possibility of high
initial cost, which can raise the
level of expense and reduce cash
position of the company.
4
The organisation could smoothly
increase the required finance for
the expansion process, as
Germany is considered one of the
largest markets for stationary
industry
9
There is a special challenge of
the continuous innovation and
diversification, which needs to
be maintained by the company.
3
Total Pros 41 Total Cons 27
Average Pros 6.83 Average Cons 4.5
b) Providing the List of Internal Standard that apply to Duque’s activities:
There is a list of ISO standards that can be followed by Duque for conducting the activities.
ISO 9000 (Quality Management)
ISO 14000 (Environment Management)
ISO 31000 (Risk Environment)
7

Report for Duque Papetiers Gros 2018
2.5 Costs of a New Building
a) Calculating the monthly cost of 30- year mortgage:
A(1+ r)n −12∗x∗
[ (1+ r)n −1
( 1+r ) −1 ] =0
Where, A = Amount of Mortgage
r = Annual rate of interest expressed in decimal
n = Repayment term in years
x = Monthly repayment
200,000(1+0.10)30−12 × x × [ (1+0.10)30−1
( 1+0.10 )−1 ]=0
200,000(1.10)30−12 × x × [ (1.10)30−1
( 1.10 )−1 ]=0
200,000(17.45)−12 × x × [ 16.45
( 0.10 ) ]=0
3,489,880.45−12 × x ×164.49=0
3,489,880.45−x 1973.93=0
3,489,880.45=x 1973.93
3,489,880.45
1973.93 =x
1767.77=x
The above table relevantly depicts the overall calculation for the monthly cost of 30-year
mortgage, which can be conducted by the company. The monthly payment on the basis of 10%
interest rate would eventually lead to $1,768. This calculation is mainly based on the monthly
mortgage repayment formula, which is depicted in the above table.
b) Re-calculating the monthly cost of with interest rate of APR:
Particulars Value
Rate 10%
Fees to pay 5,000
APR 10.30%
8
⊘ This is a preview!⊘
Do you want full access?
Subscribe today to unlock all pages.
Trusted by 1+ million students worldwide
Report for Duque Papetiers Gros 2018
A(1+r)n −12∗x∗
[ (1+r)n −1
( 1+r ) −1 ]=0
Where, A = Amount of Mortgage
r = Annual rate of interest expressed in decimal
n = Repayment term in years
x = Monthly repayment
200,000(1+0.1030)30−12 × x × [ (1+0.1030)30−1
( 1+0.1030 ) −1 ]=0
200,000(1.1030)30−12 × x × [ (1.1030)30−1
( 1.1030 ) −1 ] =0
200,000(18.95)−12 × x × [ 17.95
( 0.1030 ) ]=0
3,790,503.90−12 × x ×174.24=0
3,790,503.90−x 2090.87=0
3,790,503.90=x 2090.87
3,790,503.90
2090.87 =x
1813=x
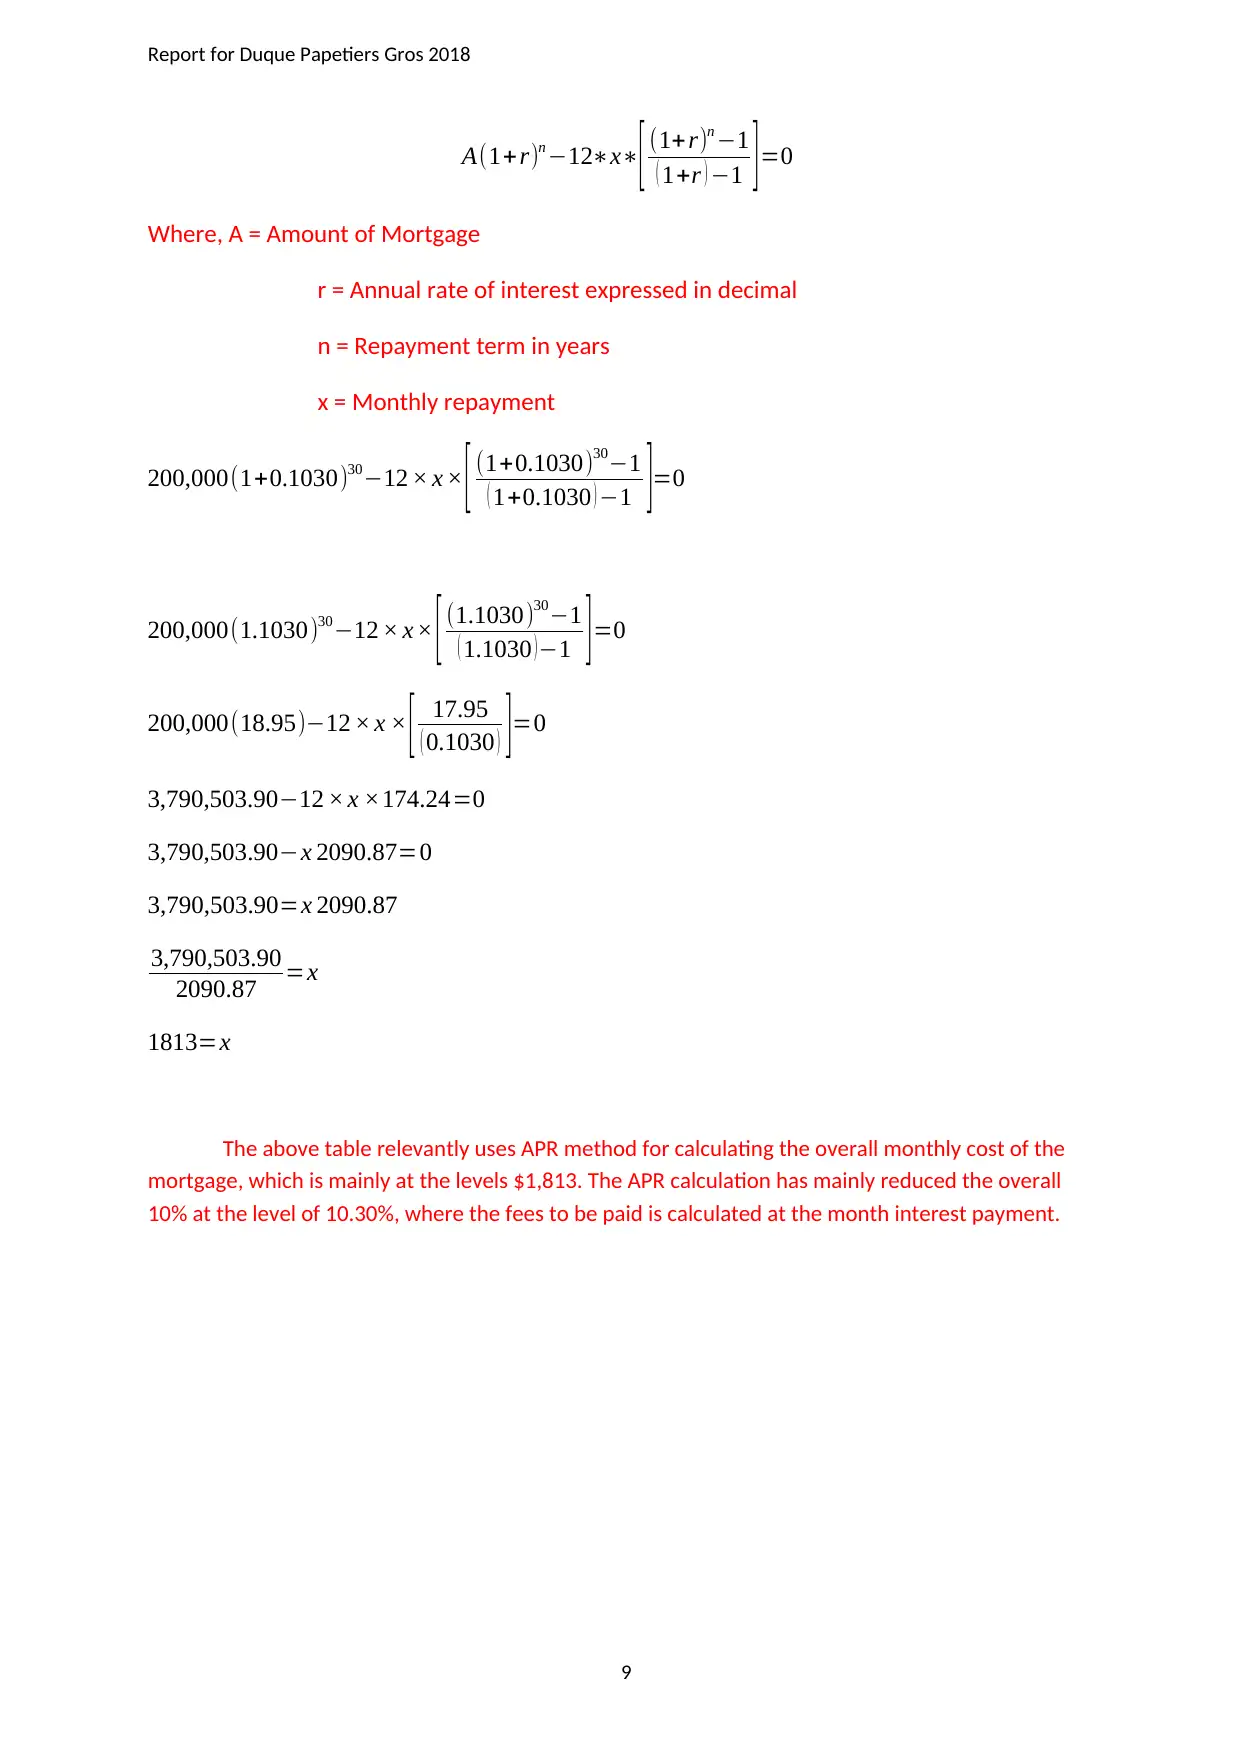
The above table relevantly uses APR method for calculating the overall monthly cost of the
mortgage, which is mainly at the levels $1,813. The APR calculation has mainly reduced the overall
10% at the level of 10.30%, where the fees to be paid is calculated at the month interest payment.
9
A(1+r)n −12∗x∗
[ (1+r)n −1
( 1+r ) −1 ]=0
Where, A = Amount of Mortgage
r = Annual rate of interest expressed in decimal
n = Repayment term in years
x = Monthly repayment
200,000(1+0.1030)30−12 × x × [ (1+0.1030)30−1
( 1+0.1030 ) −1 ]=0
200,000(1.1030)30−12 × x × [ (1.1030)30−1
( 1.1030 ) −1 ] =0
200,000(18.95)−12 × x × [ 17.95
( 0.1030 ) ]=0
3,790,503.90−12 × x ×174.24=0
3,790,503.90−x 2090.87=0
3,790,503.90=x 2090.87
3,790,503.90
2090.87 =x
1813=x
The above table relevantly uses APR method for calculating the overall monthly cost of the
mortgage, which is mainly at the levels $1,813. The APR calculation has mainly reduced the overall
10% at the level of 10.30%, where the fees to be paid is calculated at the month interest payment.
9
Paraphrase This Document
Need a fresh take? Get an instant paraphrase of this document with our AI Paraphraser

Report for Duque Papetiers Gros 2018
2.6 Mean Value of Orders
The null hypothesis indicate that mean value is the orders received by his firm €240 ,
and the alternative hypothesis is that the mean is not equal to €240.
So this can be written as :
H0 : μ = €240
H1 : μ ≠€240
μ stands for the mean
The significance level is at 5%.
The standard deviation is at the levels of s = €43.
The sample of 50 has been considered for calculating the standard error (SE) using the
formula:
SE = std deviation / √𝑛 ( standard deviation of Sample divide by square
root of n )
= 43 / √50
= 43 / 7.0711
= 6.08 = 6 (to nearest €)
We then work out the acceptance interval as [ μ – 2SE , μ + 2SE ]
= [ 240 -2(6.08) , 240 + 2(6.08) ]
= [ 228 , 252 ]
Now we will be using the sample mean of €230, which lies inside this interval level of
(228,252).
Hence, we can reasonably expect that 95% of randomly-sampled means would lie within the
intervals of (228,252).
So we ACCEPT H0 and therefore REJECT H1, meaning that the mean amount of orders are at
the levels of €240. Thus, the evidence supports the belief.
10
Report for Duque Papetiers Gros 2018
2.7 Customer Satisfaction
a) Providing relevant advice to the current situation:
Feedback is considered to be one the major component of companies, which help them
survey the overall market and customise their products in accordance with the needs of the end
consumer. The current questioner is relevantly appropriate, as it lacks qualitative questions, while
maximum number of the questions have options from which the client can choose. This would
eventually help in gathering the required level of data that can be used for completing the task.
Moreover, improvement in the questioner can be conducted by providing only option type questions,
which can eventually help in reducing the lead time in completing the questioner. However, the
popularity of the questioner can be improved by providing relevant offers and extra benefits that can
be used by the customers. These offers would eventually lure in customers that will take time to
complete the questioner and provide the company with the adequate level of data, which can be used
for detecting customer satisfaction. Furthermore, the organisation can make adequate data base for
customers who are regular and provide them with the questioner, which can help the organisation to
determine the customer satisfaction level.
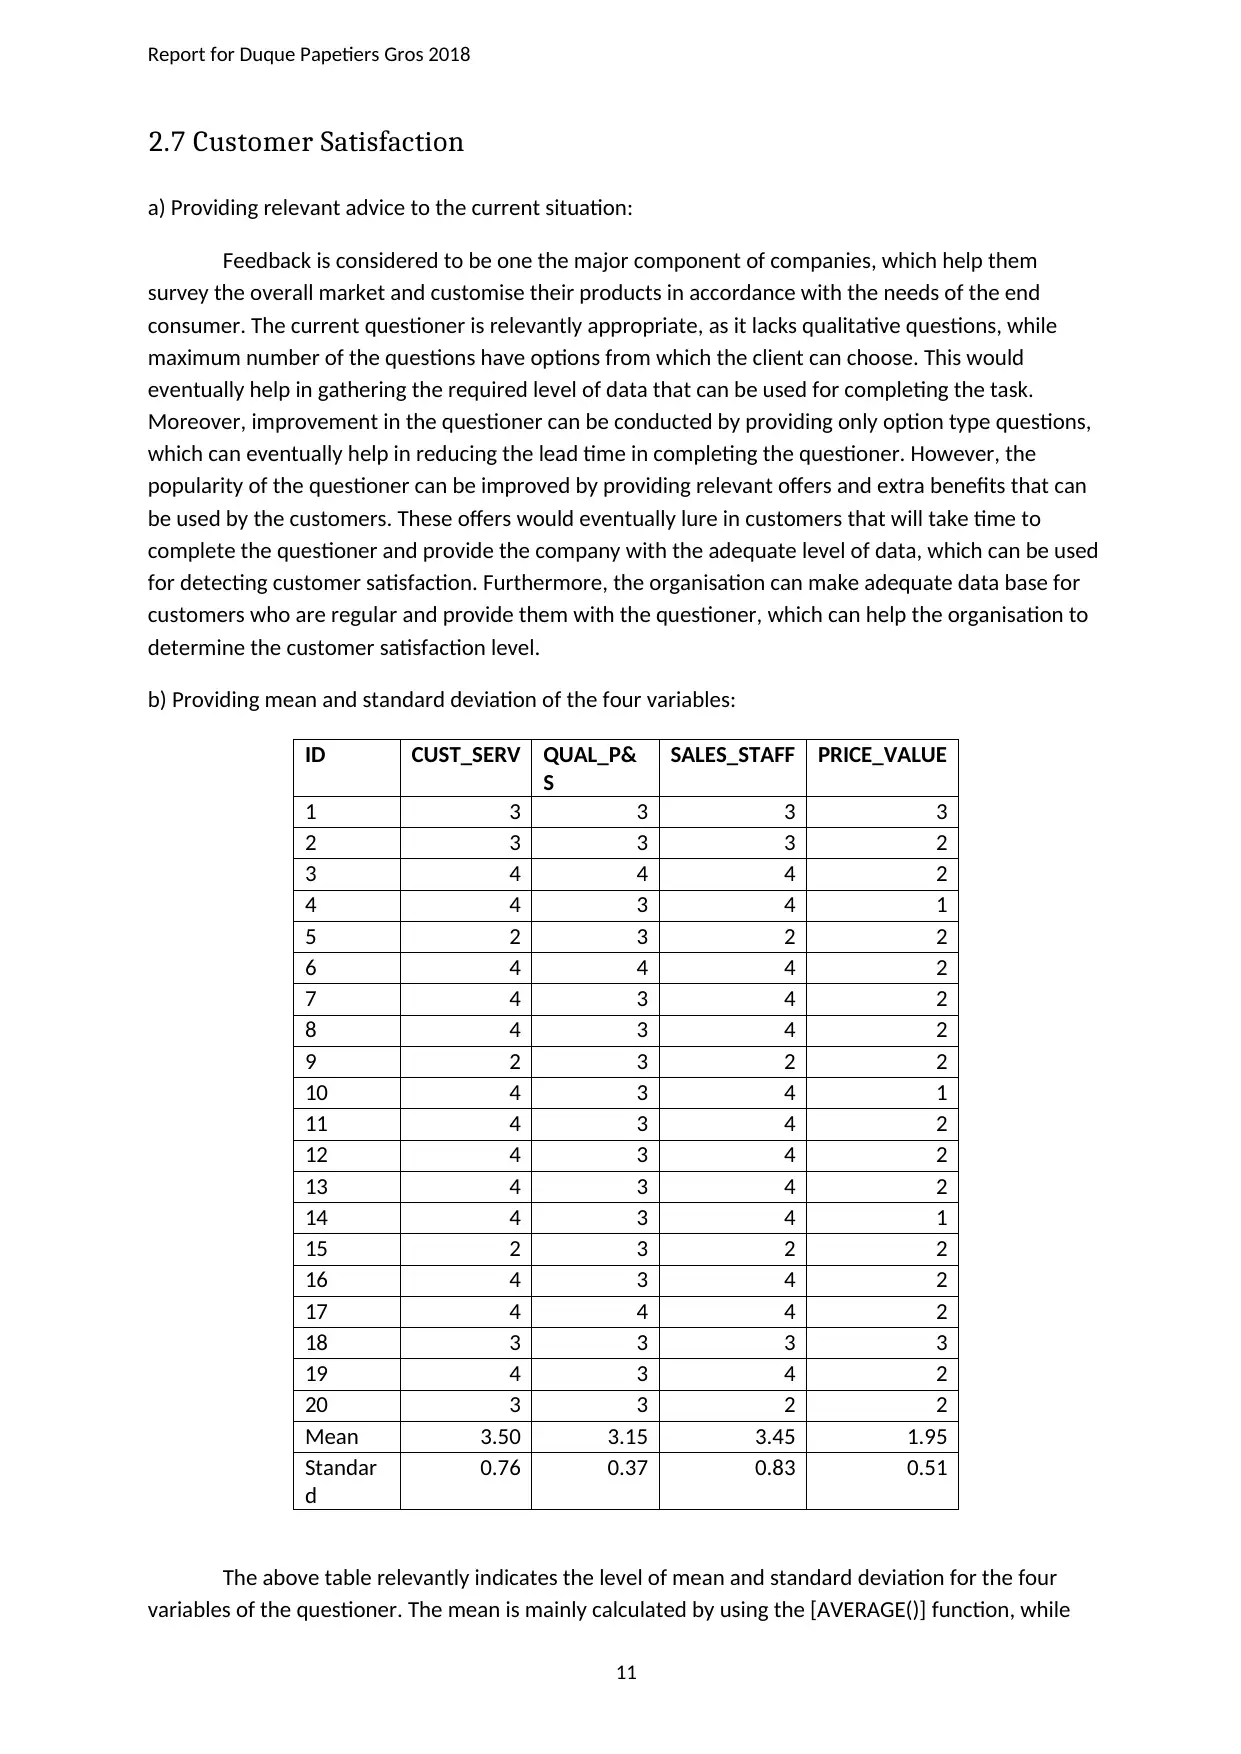
b) Providing mean and standard deviation of the four variables:
ID CUST_SERV QUAL_P&
S
SALES_STAFF PRICE_VALUE
1 3 3 3 3
2 3 3 3 2
3 4 4 4 2
4 4 3 4 1
5 2 3 2 2
6 4 4 4 2
7 4 3 4 2
8 4 3 4 2
9 2 3 2 2
10 4 3 4 1
11 4 3 4 2
12 4 3 4 2
13 4 3 4 2
14 4 3 4 1
15 2 3 2 2
16 4 3 4 2
17 4 4 4 2
18 3 3 3 3
19 4 3 4 2
20 3 3 2 2
Mean 3.50 3.15 3.45 1.95
Standar
d
0.76 0.37 0.83 0.51
The above table relevantly indicates the level of mean and standard deviation for the four
variables of the questioner. The mean is mainly calculated by using the [AVERAGE()] function, while
11
2.7 Customer Satisfaction
a) Providing relevant advice to the current situation:
Feedback is considered to be one the major component of companies, which help them
survey the overall market and customise their products in accordance with the needs of the end
consumer. The current questioner is relevantly appropriate, as it lacks qualitative questions, while
maximum number of the questions have options from which the client can choose. This would
eventually help in gathering the required level of data that can be used for completing the task.
Moreover, improvement in the questioner can be conducted by providing only option type questions,
which can eventually help in reducing the lead time in completing the questioner. However, the
popularity of the questioner can be improved by providing relevant offers and extra benefits that can
be used by the customers. These offers would eventually lure in customers that will take time to
complete the questioner and provide the company with the adequate level of data, which can be used
for detecting customer satisfaction. Furthermore, the organisation can make adequate data base for
customers who are regular and provide them with the questioner, which can help the organisation to
determine the customer satisfaction level.
b) Providing mean and standard deviation of the four variables:
ID CUST_SERV QUAL_P&
S
SALES_STAFF PRICE_VALUE
1 3 3 3 3
2 3 3 3 2
3 4 4 4 2
4 4 3 4 1
5 2 3 2 2
6 4 4 4 2
7 4 3 4 2
8 4 3 4 2
9 2 3 2 2
10 4 3 4 1
11 4 3 4 2
12 4 3 4 2
13 4 3 4 2
14 4 3 4 1
15 2 3 2 2
16 4 3 4 2
17 4 4 4 2
18 3 3 3 3
19 4 3 4 2
20 3 3 2 2
Mean 3.50 3.15 3.45 1.95
Standar
d
0.76 0.37 0.83 0.51
The above table relevantly indicates the level of mean and standard deviation for the four
variables of the questioner. The mean is mainly calculated by using the [AVERAGE()] function, while
11
⊘ This is a preview!⊘
Do you want full access?
Subscribe today to unlock all pages.
Trusted by 1+ million students worldwide
1 out of 17

Your All-in-One AI-Powered Toolkit for Academic Success.
+13062052269
info@desklib.com
Available 24*7 on WhatsApp / Email
![[object Object]](/_next/static/media/star-bottom.7253800d.svg)
Unlock your academic potential
Copyright © 2020–2026 A2Z Services. All Rights Reserved. Developed and managed by ZUCOL.