North South University: Time Series Analysis of DBBL (Fin 464)
VerifiedAdded on 2022/11/21
|32
|6069
|301
Project
AI Summary
This project provides a comprehensive time series analysis of Dutch Bangla Bank Limited (DBBL), examining its financial performance from 2017 to 2021. The analysis focuses on key financial ratios across several categories, including liquidity, profitability, efficiency, financial risk, and market position. The methodology employed involves the calculation and interpretation of various ratios using data extracted from DBBL's annual reports and other sources. The report details the trends and fluctuations observed in these ratios over the five-year period, including the impact of the COVID-19 pandemic. Findings include insights into DBBL's cash position, liquid securities, capacity ratio, hot money ratio, and asset utilization, along with an overview of the bank's operations, mission, and vision. The project also acknowledges limitations, such as data availability and the influence of external factors. This project was conducted for a Bank Management course (Fin 464) at North South University.
1 | P a g e
Group Assignment: Time series analysis of “Dutch Bangla
Bank Limited”
Course: Bank Management
Course Code: Fin 464
Section: 3
Prepared By:
Name ID
Syeda Numaira Shehrin 2022400630
Tahmid Shahriyar 1931791630
Mayesha Nuzhat Khandkar 1911465630
Submitted To:
Mr. Mokhdum Morshed [MdM]
Senior Lecturer
Department of Accounting & Finance
School of Business & Economics
North South University
Date of Submission: 2nd September, 2022
Paraphrase This Document
Need a fresh take? Get an instant paraphrase of this document with our AI Paraphraser
2 | P a g e
Acknowledgment:
We are grateful to our respected faculty member and course instructor, Mr. Mokhdum Morshed
sir, for providing us with the opportunity to work as a group and complete this project with a
united effort and utmost efficiency, as well as for his guidance, sustained interest, constant
encouragement, motivating inspiration, directions, valuable suggestions, and advice. We are
grateful to North South University's Department of Accounting and Finance for providing such
a well-designed course and facilities, which greatly aided us in completing our project
methodically. Finally, we would like to express our gratitude to everyone who assisted us,
directly or indirectly, in the smooth execution and completion of this report.
3 | P a g e
Executive Summary:
For this following project, we conducted a performance analysis on our given bank which is
Dutch Bangla Bank Limited. We primarily conducted ratio analysis for this bank. For ratio
analysis, we used the historical data for the last five years, 2017-2021. We used time series
analysis and for ratio analysis, we focused on profitability, liquidity, efficiency, financial
risk, and market positions. Lastly, the following report contains two segments: excel and
word documents. The excel segment contains all the necessary assigned calculations
centering on the project and the word contains the written body of the report which will be
shown in the table of contents below which will further shed light on components we worked
with for the completion of our report.
⊘ This is a preview!⊘
Do you want full access?
Subscribe today to unlock all pages.
Trusted by 1+ million students worldwide
4 | P a g e
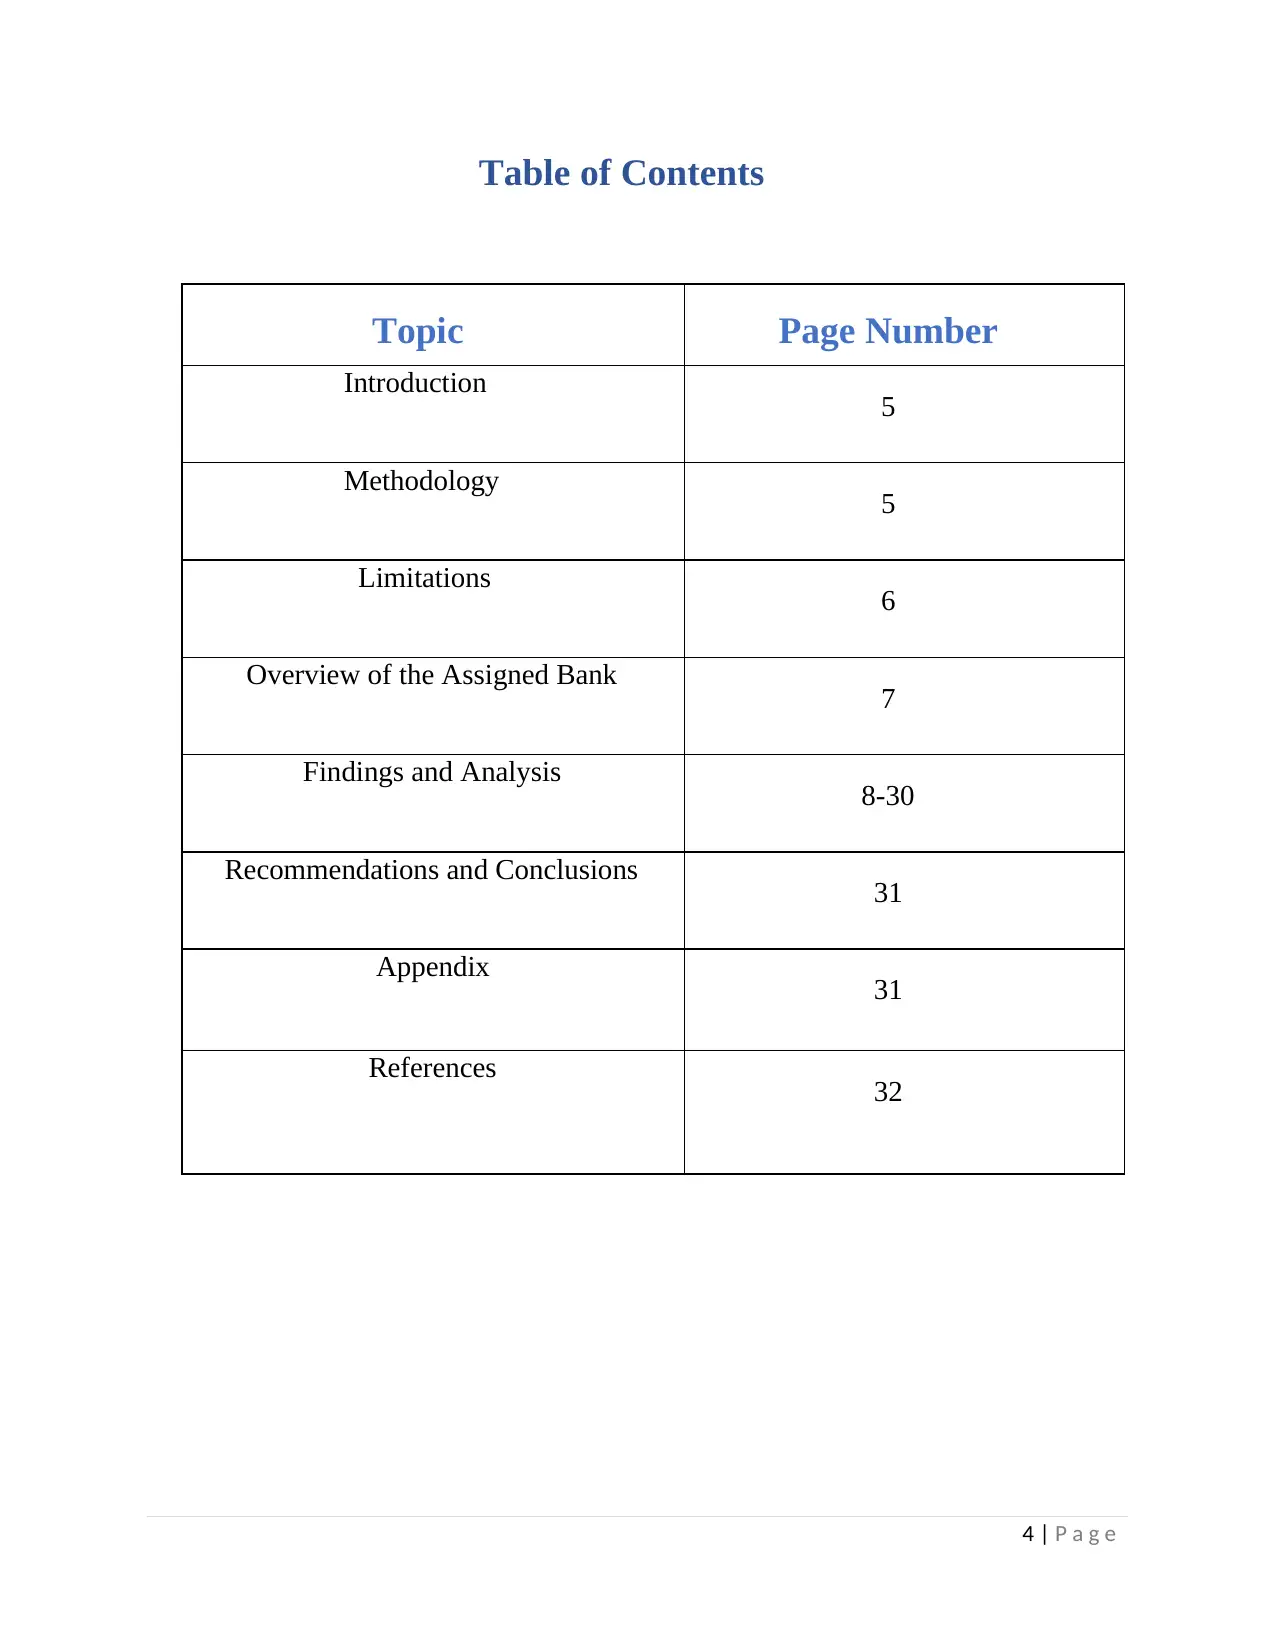
Table of Contents
Topic Page Number
Introduction 5
Methodology 5
Limitations 6
Overview of the Assigned Bank 7
Findings and Analysis 8-30
Recommendations and Conclusions 31
Appendix 31
References 32
Table of Contents
Topic Page Number
Introduction 5
Methodology 5
Limitations 6
Overview of the Assigned Bank 7
Findings and Analysis 8-30
Recommendations and Conclusions 31
Appendix 31
References 32
Paraphrase This Document
Need a fresh take? Get an instant paraphrase of this document with our AI Paraphraser
5 | P a g e
Introduction:
In today’s world, banks are the heart of the economic system. If the banking industry fails, the
economy will collapse, demonstrating the importance of this industry in comparison to others.
Commercial banks play an important role in the development of the economy's financial structure
by making large investments in markets to bridge the gap between surplus and deficit units. Banks
are heavily regulated by the government because they deal with public deposits. Furthermore, as
banks control the circulation of money, a country's economic development is heavily reliant on
them. Thus, a bank's performance must be well organized because a strong banking sector is
critical for growth, job creation, wealth creation, poverty eradication, entrepreneurial activity, and
GDP growth. As a result, our course instructor assigned us the task of analyzing the performance
of Dutch Bangla Bank Limited. We will be using historical data from the last five years (2017-
2021). For these, we will primarily use ratio analysis to understand the liquidity position,
efficiency, financial risk, profitability, and market position.
Methodology:
For this report analyzing the profitability, risk exposure, liquidity position, and market analysis for
Dutch Bangla Bank Ltd we used Ratios as our main tool for analysis. We used Liquidity Indicator
Ratios, Profitability Ratios, Efficiency Ratios, and Market Ratios to analyze the different aspects
of this commercial bank. We did a time series analysis using the ratios we calculated. A time series
analysis is the comparison of different values of the same company for a selected period. The time
period provided to us is the last five years starting from 2017 to 2021. This includes the year when
covid-19 began and thus lets us find out the effects of the economic changes on the commercial
banks due to an ongoing pandemic. To calculate these ratios, we needed data about the bank. For
this, we went for the secondary source of data; which is their annual reports. Using their annual
reports for the past five years that we collected from their official website we calculated the ratios.
Along with that, any additional information that was needed for example the closing stock prices
of DBBL each year was obtained from another website called “amarstock.com”.
6 | P a g e
Limitations:
One of the major issues we faced while conducting this research was obtaining accurate values
from the bank’s financial statements. Some ratios like the Hot Money Ratio and the Expense
Control Efficiency Ratio were difficult to collect. We had to email the bank and call them multiple
times to gather the information we needed but most of our attempts were unsuccessful. However,
we eventually found the accurate values we had been looking for. Moreover, the time frame from
which we had to derive our analysis and interpretation was subject to the Coronavirus Pandemic
and its aftermath. Hence, the outcome or pattern of majority of our analysis involved the
assumption of the pandemic causing an unexpected change in the usual pattern of the ratios. This
is especially problematic as this does not give the true overview or analysis of the bank but gives
the values for when an adverse situation or anomaly is present. This data might not be a useful tool
for forecasting or comparison with future or past conditions, as there is a good chance that another
outbreak is not going to happen for another generation or even a century.
⊘ This is a preview!⊘
Do you want full access?
Subscribe today to unlock all pages.
Trusted by 1+ million students worldwide
7 | P a g e
Overview of the Assigned Bank:
Dutch Bangla Bank Limited (DBBL):
M Sahabuddin Ahmed (Founder & Chairman) and the Dutch company FMO launched Dutch-
Bangla Bank as Bangladesh's first joint venture private commercial bank. In Bangladesh, DBBL
was founded under the Bank Companies Act of 1991 and incorporated as a public limited company
under the Companies Act of 1994. Its formal operations began on June 3, 1996.
The bank's initial focus was on financing high-growth manufacturing industries in Bangladesh.
The reasoning is that the manufacturing sector exports Bangladeshi goods all over the world. By
financing and concentrating on this sector, Bangladesh can achieve the desired growth. Another
area of emphasis for Dutch Bangla Bank is Corporate Social Responsibility (CSR). Dutch Bangla
Bank has become one of Bangladesh's largest bank donors as a result of its investment in this
sector. Because of its unique approach as a socially conscious bank, the bank has received
numerous international awards.
Dutch Bangla Bank was Bangladesh's first fully automated bank. It is also known as the "most
innovative and technologically advanced bank in Bangladesh." The Electronic-Banking Division
was founded in 2002 with the goal of rapid automation and the introduction of modern banking
services into this field. In 2003, full automation was completed, introducing plastic money to the
Bangladeshi people. Dutch Bangla Bank also operates the nation's largest ATM fleet, cutting
consumer costs and fees by 80% in the process. Furthermore, the decision by Dutch Bangla Bank
to pursue a low-profitability strategy in this sector has surprised many critics. Because of this
mindset, the majority of local banks have joined the Dutch Bangla Bank banking infrastructure
rather than developing their own.
Mission: With a commitment to social responsibility, Dutch-Bangla Bank fosters enterprise and
creativity in business and industry. Profits are not the primary focus of the bank's operations
because "man does not live by bread and butter alone."
Vision: The Dutch-Bangla Bank envisions a better Bangladesh, where the arts and letters, sports
and athletics, music and entertainment, science and education, health and hygiene, a clean and
pollution-free environment, and, most importantly, a society based on morality and ethics make
all of our lives worthwhile. The essence and ethos of Dutch-Bangla Bank are based on a cosmos
of creativity and the marvel-magic of a charmed life that abounds with the spirit of life and
adventures that contribute to human development.
Paraphrase This Document
Need a fresh take? Get an instant paraphrase of this document with our AI Paraphraser
8 | P a g e
Findings and Analysis:
Liquidity Indicator Ratios
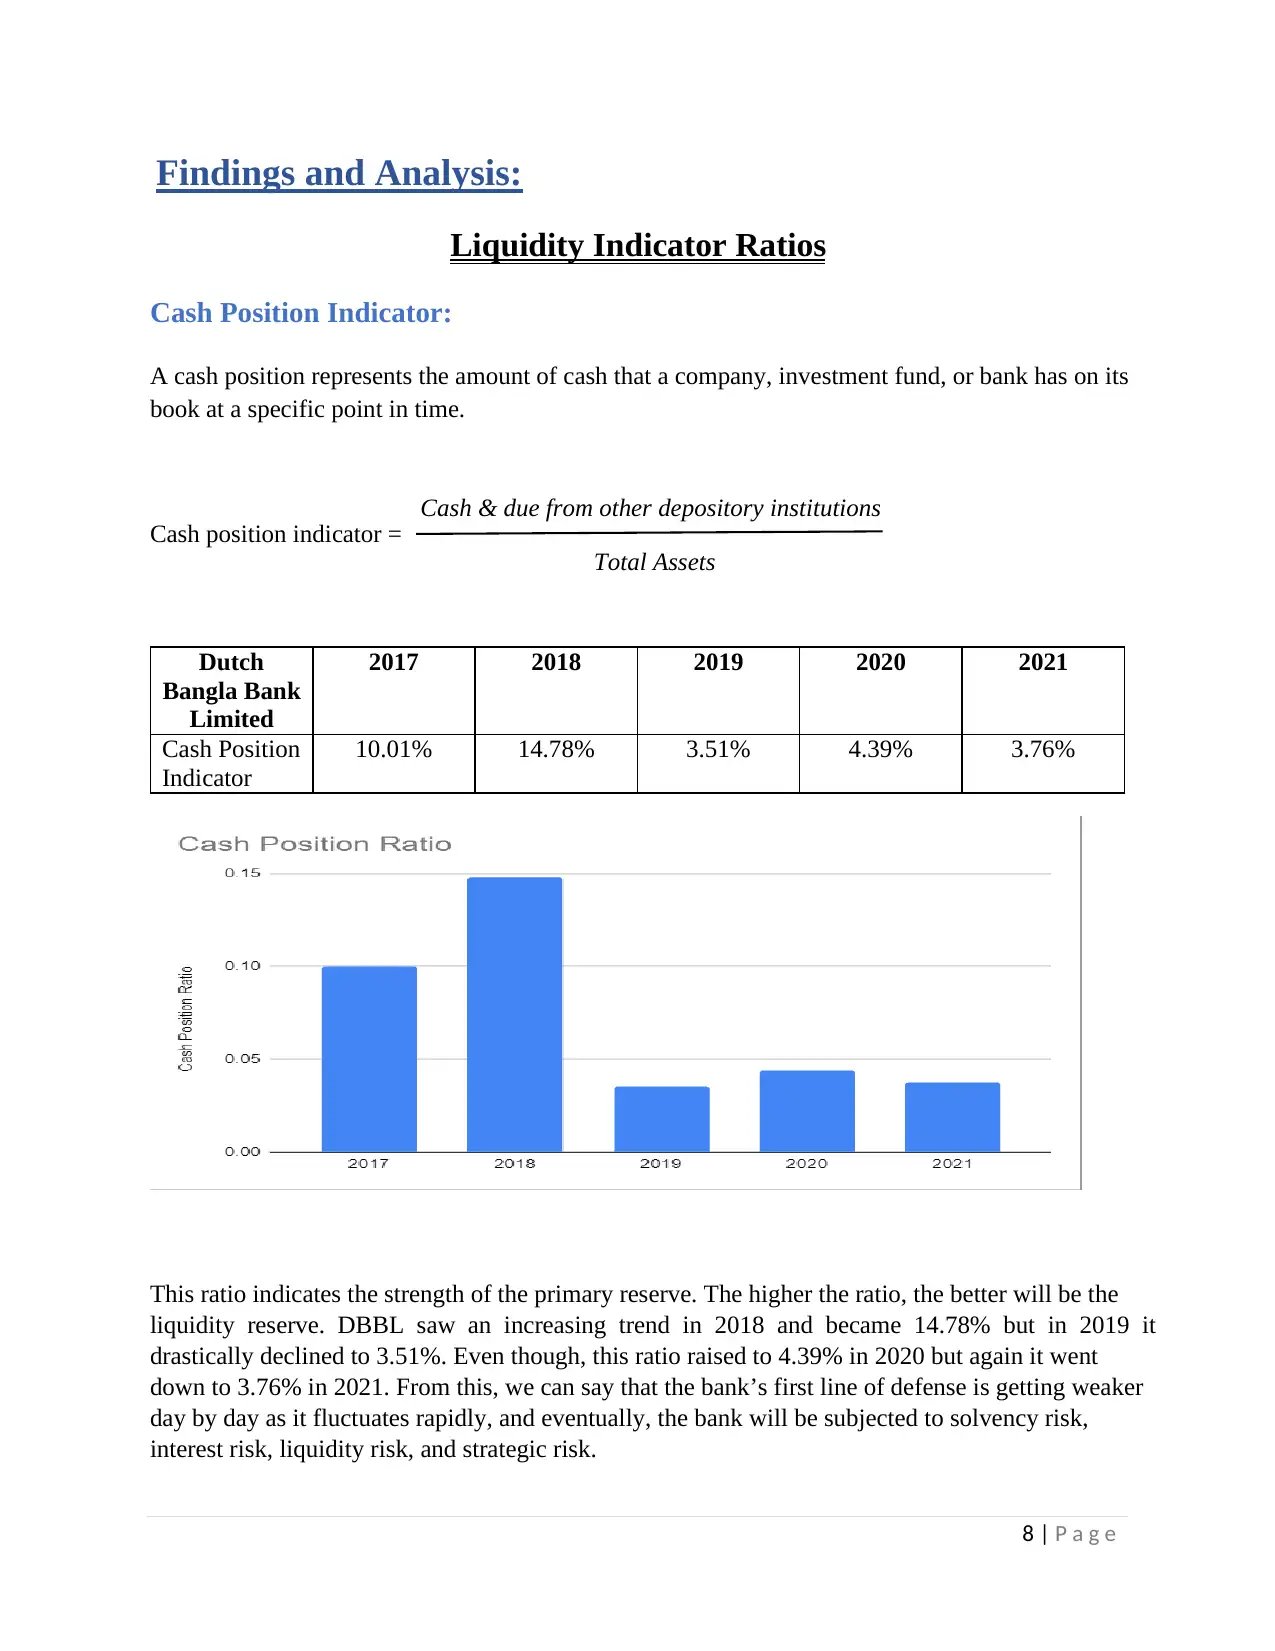
Cash Position Indicator:
A cash position represents the amount of cash that a company, investment fund, or bank has on its
book at a specific point in time.
Cash position indicator =
Dutch
Bangla Bank
Limited
2017 2018 2019 2020 2021
Cash Position
Indicator
10.01% 14.78% 3.51% 4.39% 3.76%
This ratio indicates the strength of the primary reserve. The higher the ratio, the better will be the
liquidity reserve. DBBL saw an increasing trend in 2018 and became 14.78% but in 2019 it
drastically declined to 3.51%. Even though, this ratio raised to 4.39% in 2020 but again it went
down to 3.76% in 2021. From this, we can say that the bank’s first line of defense is getting weaker
day by day as it fluctuates rapidly, and eventually, the bank will be subjected to solvency risk,
interest risk, liquidity risk, and strategic risk.
Cash & due from other depository institutions
Total Assets
Findings and Analysis:
Liquidity Indicator Ratios
Cash Position Indicator:
A cash position represents the amount of cash that a company, investment fund, or bank has on its
book at a specific point in time.
Cash position indicator =
Dutch
Bangla Bank
Limited
2017 2018 2019 2020 2021
Cash Position
Indicator
10.01% 14.78% 3.51% 4.39% 3.76%
This ratio indicates the strength of the primary reserve. The higher the ratio, the better will be the
liquidity reserve. DBBL saw an increasing trend in 2018 and became 14.78% but in 2019 it
drastically declined to 3.51%. Even though, this ratio raised to 4.39% in 2020 but again it went
down to 3.76% in 2021. From this, we can say that the bank’s first line of defense is getting weaker
day by day as it fluctuates rapidly, and eventually, the bank will be subjected to solvency risk,
interest risk, liquidity risk, and strategic risk.
Cash & due from other depository institutions
Total Assets
9 | P a g e
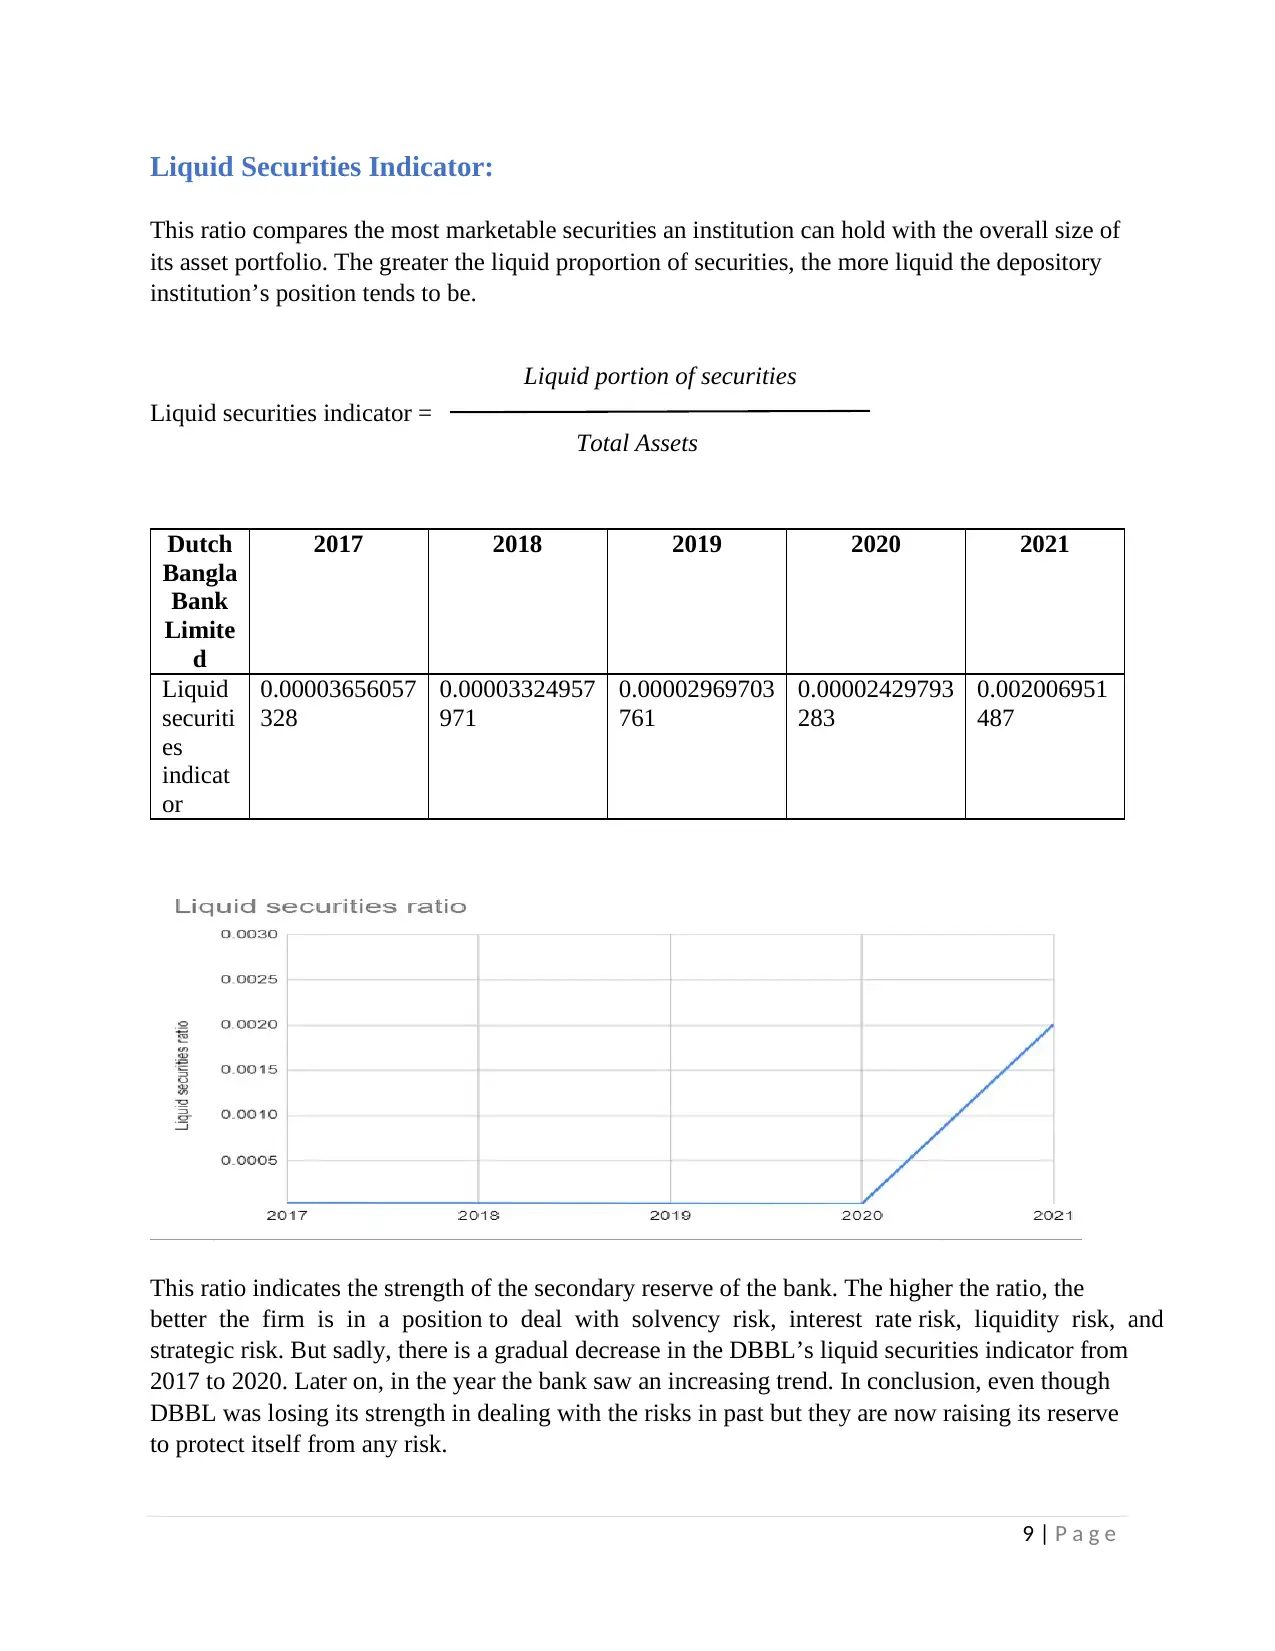
Liquid Securities Indicator:
This ratio compares the most marketable securities an institution can hold with the overall size of
its asset portfolio. The greater the liquid proportion of securities, the more liquid the depository
institution’s position tends to be.
Liquid securities indicator =
This ratio indicates the strength of the secondary reserve of the bank. The higher the ratio, the
better the firm is in a position to deal with solvency risk, interest rate risk, liquidity risk, and
strategic risk. But sadly, there is a gradual decrease in the DBBL’s liquid securities indicator from
2017 to 2020. Later on, in the year the bank saw an increasing trend. In conclusion, even though
DBBL was losing its strength in dealing with the risks in past but they are now raising its reserve
to protect itself from any risk.
Dutch
Bangla
Bank
Limite
d
2017 2018 2019 2020 2021
Liquid
securiti
es
indicat
or
0.00003656057
328
0.00003324957
971
0.00002969703
761
0.00002429793
283
0.002006951
487
Liquid portion of securities
Total Assets
⊘ This is a preview!⊘
Do you want full access?
Subscribe today to unlock all pages.
Trusted by 1+ million students worldwide
10 | P a g e
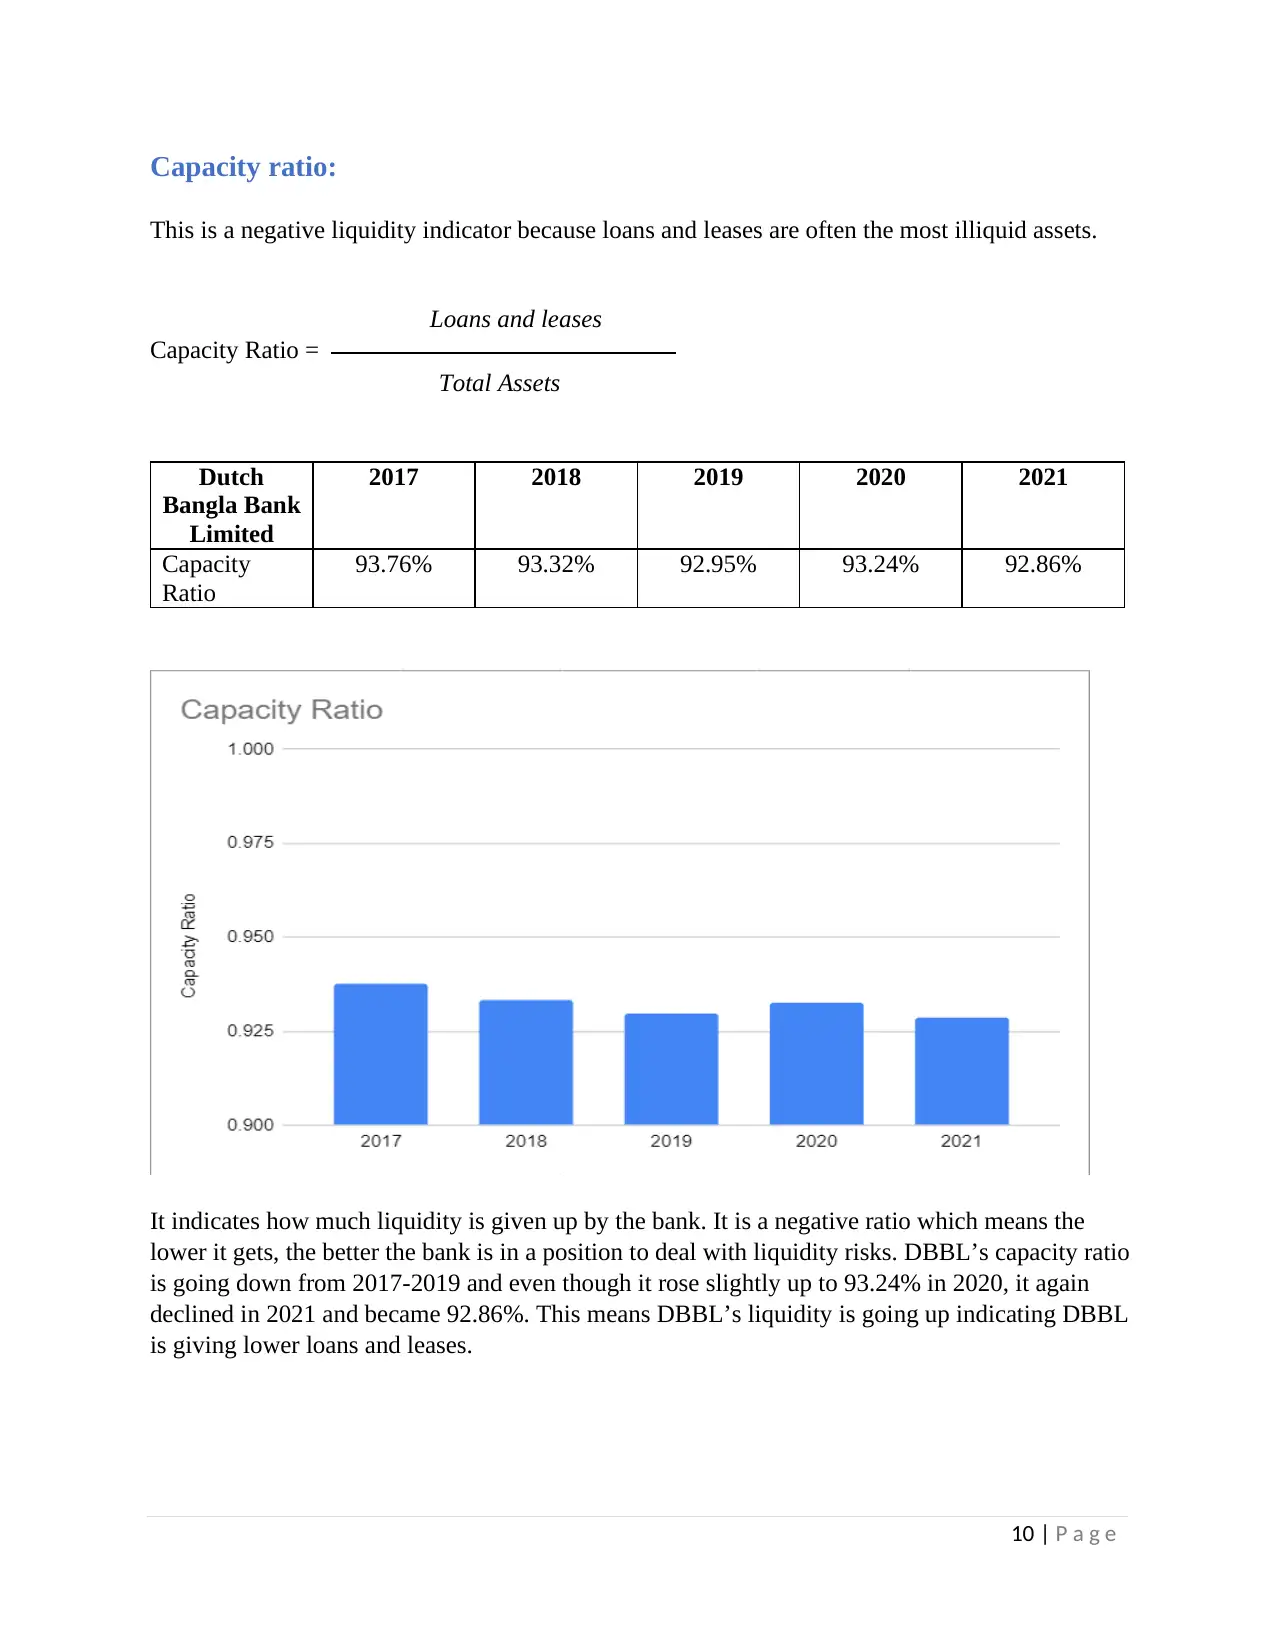
Capacity ratio:
This is a negative liquidity indicator because loans and leases are often the most illiquid assets.
Capacity Ratio =
Dutch
Bangla Bank
Limited
2017 2018 2019 2020 2021
Capacity
Ratio
93.76% 93.32% 92.95% 93.24% 92.86%
It indicates how much liquidity is given up by the bank. It is a negative ratio which means the
lower it gets, the better the bank is in a position to deal with liquidity risks. DBBL’s capacity ratio
is going down from 2017-2019 and even though it rose slightly up to 93.24% in 2020, it again
declined in 2021 and became 92.86%. This means DBBL’s liquidity is going up indicating DBBL
is giving lower loans and leases.
Total Assets
Loans and leases
Paraphrase This Document
Need a fresh take? Get an instant paraphrase of this document with our AI Paraphraser
11 | P a g e
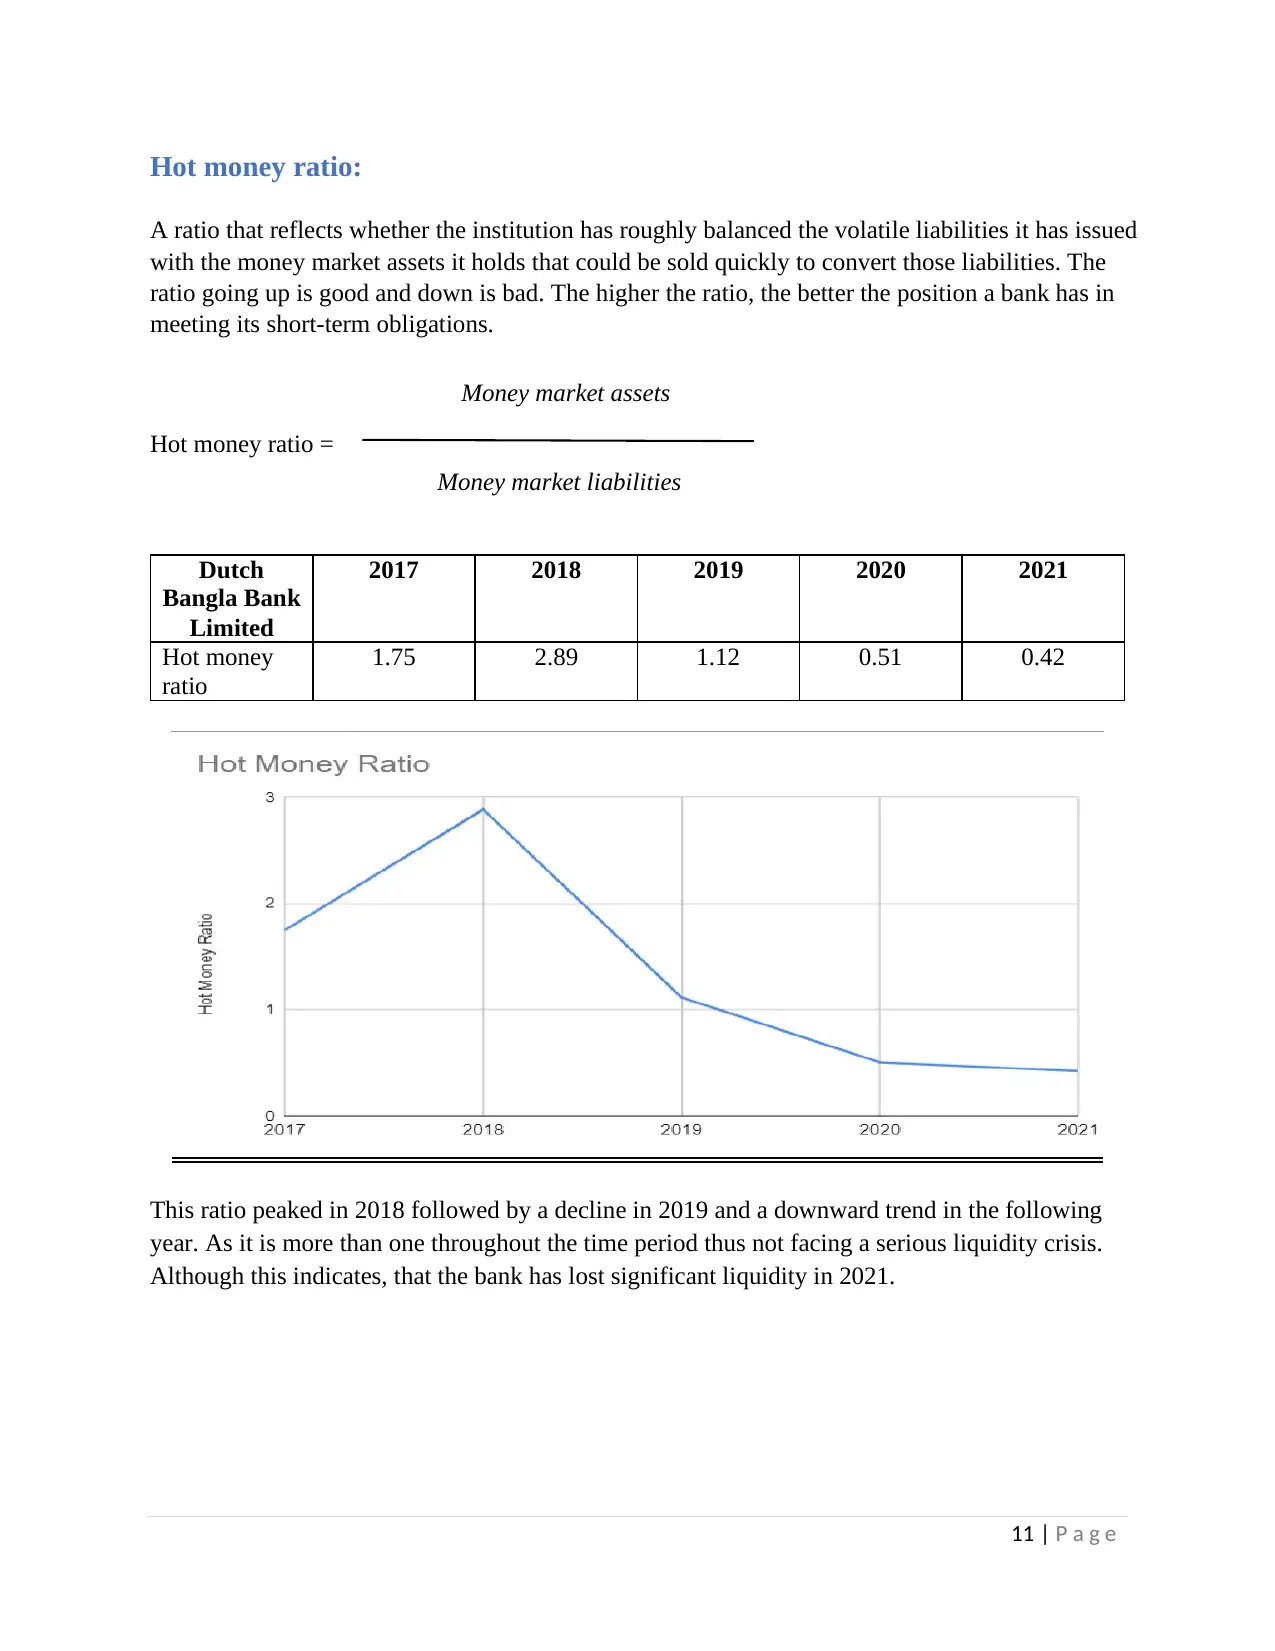
Hot money ratio:
A ratio that reflects whether the institution has roughly balanced the volatile liabilities it has issued
with the money market assets it holds that could be sold quickly to convert those liabilities. The
ratio going up is good and down is bad. The higher the ratio, the better the position a bank has in
meeting its short-term obligations.
Hot money ratio =
Dutch
Bangla Bank
Limited
2017 2018 2019 2020 2021
Hot money
ratio
1.75 2.89 1.12 0.51 0.42
This ratio peaked in 2018 followed by a decline in 2019 and a downward trend in the following
year. As it is more than one throughout the time period thus not facing a serious liquidity crisis.
Although this indicates, that the bank has lost significant liquidity in 2021.
Money market assets
Money market liabilities
12 | P a g e
Efficiency Ratios
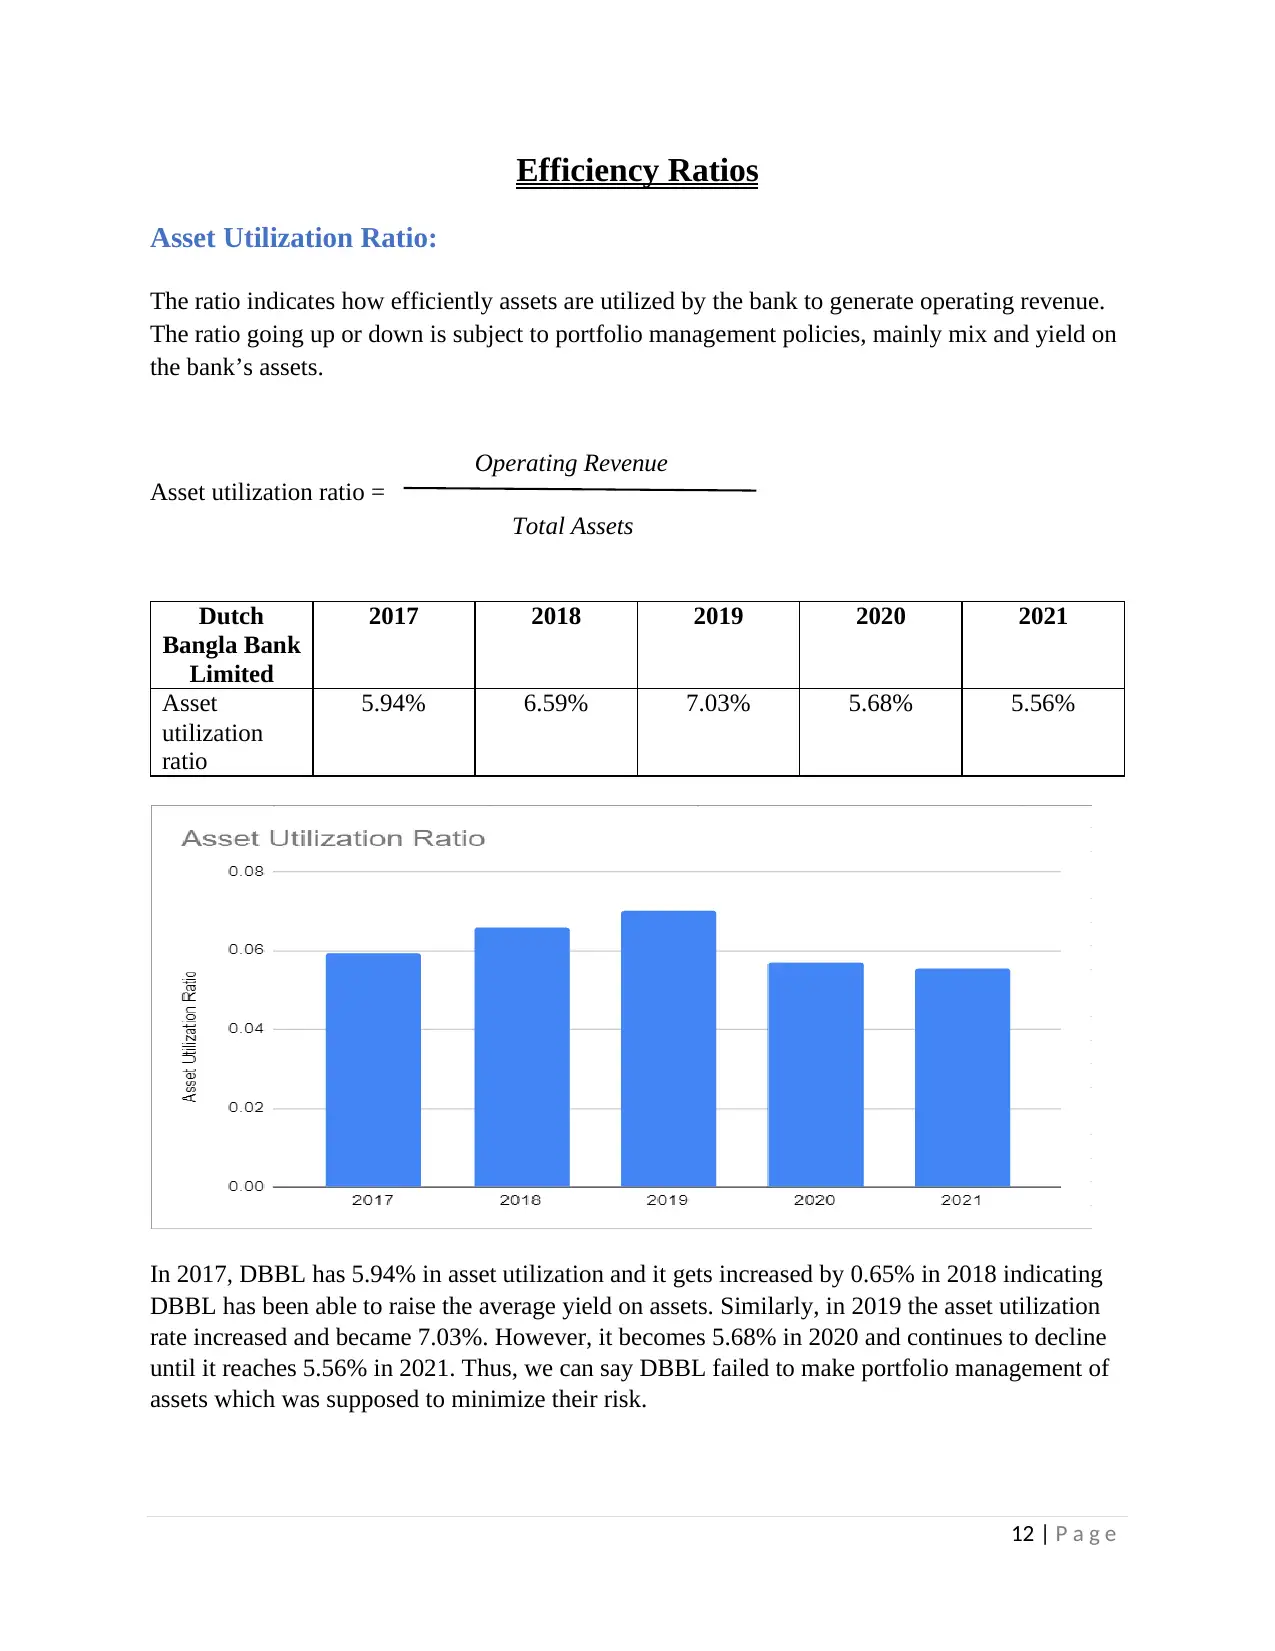
Asset Utilization Ratio:
The ratio indicates how efficiently assets are utilized by the bank to generate operating revenue.
The ratio going up or down is subject to portfolio management policies, mainly mix and yield on
the bank’s assets.
Asset utilization ratio =
Dutch
Bangla Bank
Limited
2017 2018 2019 2020 2021
Asset
utilization
ratio
5.94% 6.59% 7.03% 5.68% 5.56%
In 2017, DBBL has 5.94% in asset utilization and it gets increased by 0.65% in 2018 indicating
DBBL has been able to raise the average yield on assets. Similarly, in 2019 the asset utilization
rate increased and became 7.03%. However, it becomes 5.68% in 2020 and continues to decline
until it reaches 5.56% in 2021. Thus, we can say DBBL failed to make portfolio management of
assets which was supposed to minimize their risk.
Total Assets
Operating Revenue
Efficiency Ratios
Asset Utilization Ratio:
The ratio indicates how efficiently assets are utilized by the bank to generate operating revenue.
The ratio going up or down is subject to portfolio management policies, mainly mix and yield on
the bank’s assets.
Asset utilization ratio =
Dutch
Bangla Bank
Limited
2017 2018 2019 2020 2021
Asset
utilization
ratio
5.94% 6.59% 7.03% 5.68% 5.56%
In 2017, DBBL has 5.94% in asset utilization and it gets increased by 0.65% in 2018 indicating
DBBL has been able to raise the average yield on assets. Similarly, in 2019 the asset utilization
rate increased and became 7.03%. However, it becomes 5.68% in 2020 and continues to decline
until it reaches 5.56% in 2021. Thus, we can say DBBL failed to make portfolio management of
assets which was supposed to minimize their risk.
Total Assets
Operating Revenue
⊘ This is a preview!⊘
Do you want full access?
Subscribe today to unlock all pages.
Trusted by 1+ million students worldwide
1 out of 32


Your All-in-One AI-Powered Toolkit for Academic Success.
+13062052269
info@desklib.com
Available 24*7 on WhatsApp / Email
![[object Object]](/_next/static/media/star-bottom.7253800d.svg)
Unlock your academic potential
Copyright © 2020–2026 A2Z Services. All Rights Reserved. Developed and managed by ZUCOL.