Business Valuation Report: Duxton Broadacre Farm Ltd IPO Analysis
VerifiedAdded on 2021/06/14
|22
|5749
|33
Report
AI Summary
This business valuation report assesses the investment potential of Duxton Broadacre Farm Ltd's IPO. It begins with an executive summary outlining the purpose of the valuation, which is to determine whether the IPO presents a viable investment opportunity. The report then delves into an analysis of the company's background, industry, and competitive strategy. It examines accounting methods, earning management, and financial performance using ratio analysis and DuPont analysis. Furthermore, the report includes financial forecasting, cost of capital estimation, and the application of various equity valuation models such as the Dividend Discount Model, Residual Earning Model, Discounted Cash Flow Model, P/B Ratio, and Ohlson model. Risk analysis is also incorporated. The conclusion suggests that the IPO could be a short-term investment opportunity based on the valuation models, while acknowledging the importance of industry and market factors.
Business Valuation
Name of the Student
Name of the University
Author Note
Name of the Student
Name of the University
Author Note
Paraphrase This Document
Need a fresh take? Get an instant paraphrase of this document with our AI Paraphraser
Executive Summary
The purpose of this valuation report was to investigate whether the investor should
consider the IPO opportunity of Duxton Broadacre Farm Ltd as probable investment
option or not. In order to find out whether to invest or not, the analyst has performed a
list of analysis stating from financial performance over the last three years to valuation
of stock price basis the future projections. Additionally, the analyst has also used risk
assessment models to explain associate risk with such investment.
While, the financial performance of the organisation over the last two years has shown
a balanced performance; valuation models indicates that the investor can opt this IPO
as a short term investment opportunity.
Table of Contents
1.0 Introduction:............................................................................................................4
1.1 IPO background...................................................................................................4
1.2 Analysis of Industry............................................................................................5
1.3 Firm Competitive strategy...................................................................................6
2.0 Analysis of accounting method and earning management.......................................7
3.0 Analysis of performance using financial ratio analysis...........................................8
3.1 Ratio Analysis.....................................................................................................8
3.2 DoPont Analysis..................................................................................................9
3.3 Risk Analysis.....................................................................................................10
4.0 Financial forecasting.............................................................................................11
5.0 Estimation of cost of capital..................................................................................12
6.0 Equity valuation Model.........................................................................................12
6.1 Dividend Discount Model.................................................................................12
6.2 Residual Earning Model....................................................................................13
6.3 Discounted Cash Flow Model...........................................................................13
6.4 P/B Ratio...........................................................................................................14
6.5 Ohlson model....................................................................................................15
7.0 Conclusion............................................................................................................15
8.0 References.............................................................................................................17
Appendix.....................................................................................................................18
⊘ This is a preview!⊘
Do you want full access?
Subscribe today to unlock all pages.
Trusted by 1+ million students worldwide
1.0 Introduction:
This particular business valuation report has considered Duxton Broadacre Farm Ltd
as the case organisation, which is currently going to public through initial public
offerings (IPO). The Company tries to produce revenue and capital additions for
Investors through the activity of broadacre cultivates in Australia, that are situated to
profit by potential increment in grain costs (among other commodity costs) and
increase in land values.
The Company expects to centre on utilizing an enhanced cultivating model to augment
return on its advantages and make investor wealthy. The Company additionally means
to develop the business consistently and what's more, precisely deal with the primary
concern while responding rapidly to acquisition opportunities.
1.1 IPO background
The organisation offered 8000000 shares which can go up to 14666667 with an offer
price of $1.5 to raise minimum of $12 million and maximum of $22 million
investment (Upcomingfloats.com.au, 2018). Although, the offering date was 13
November 2017 and the Closing Date was 22 December 2017, this is still open as the
directors consulting with their lead manager extended the IPO period.
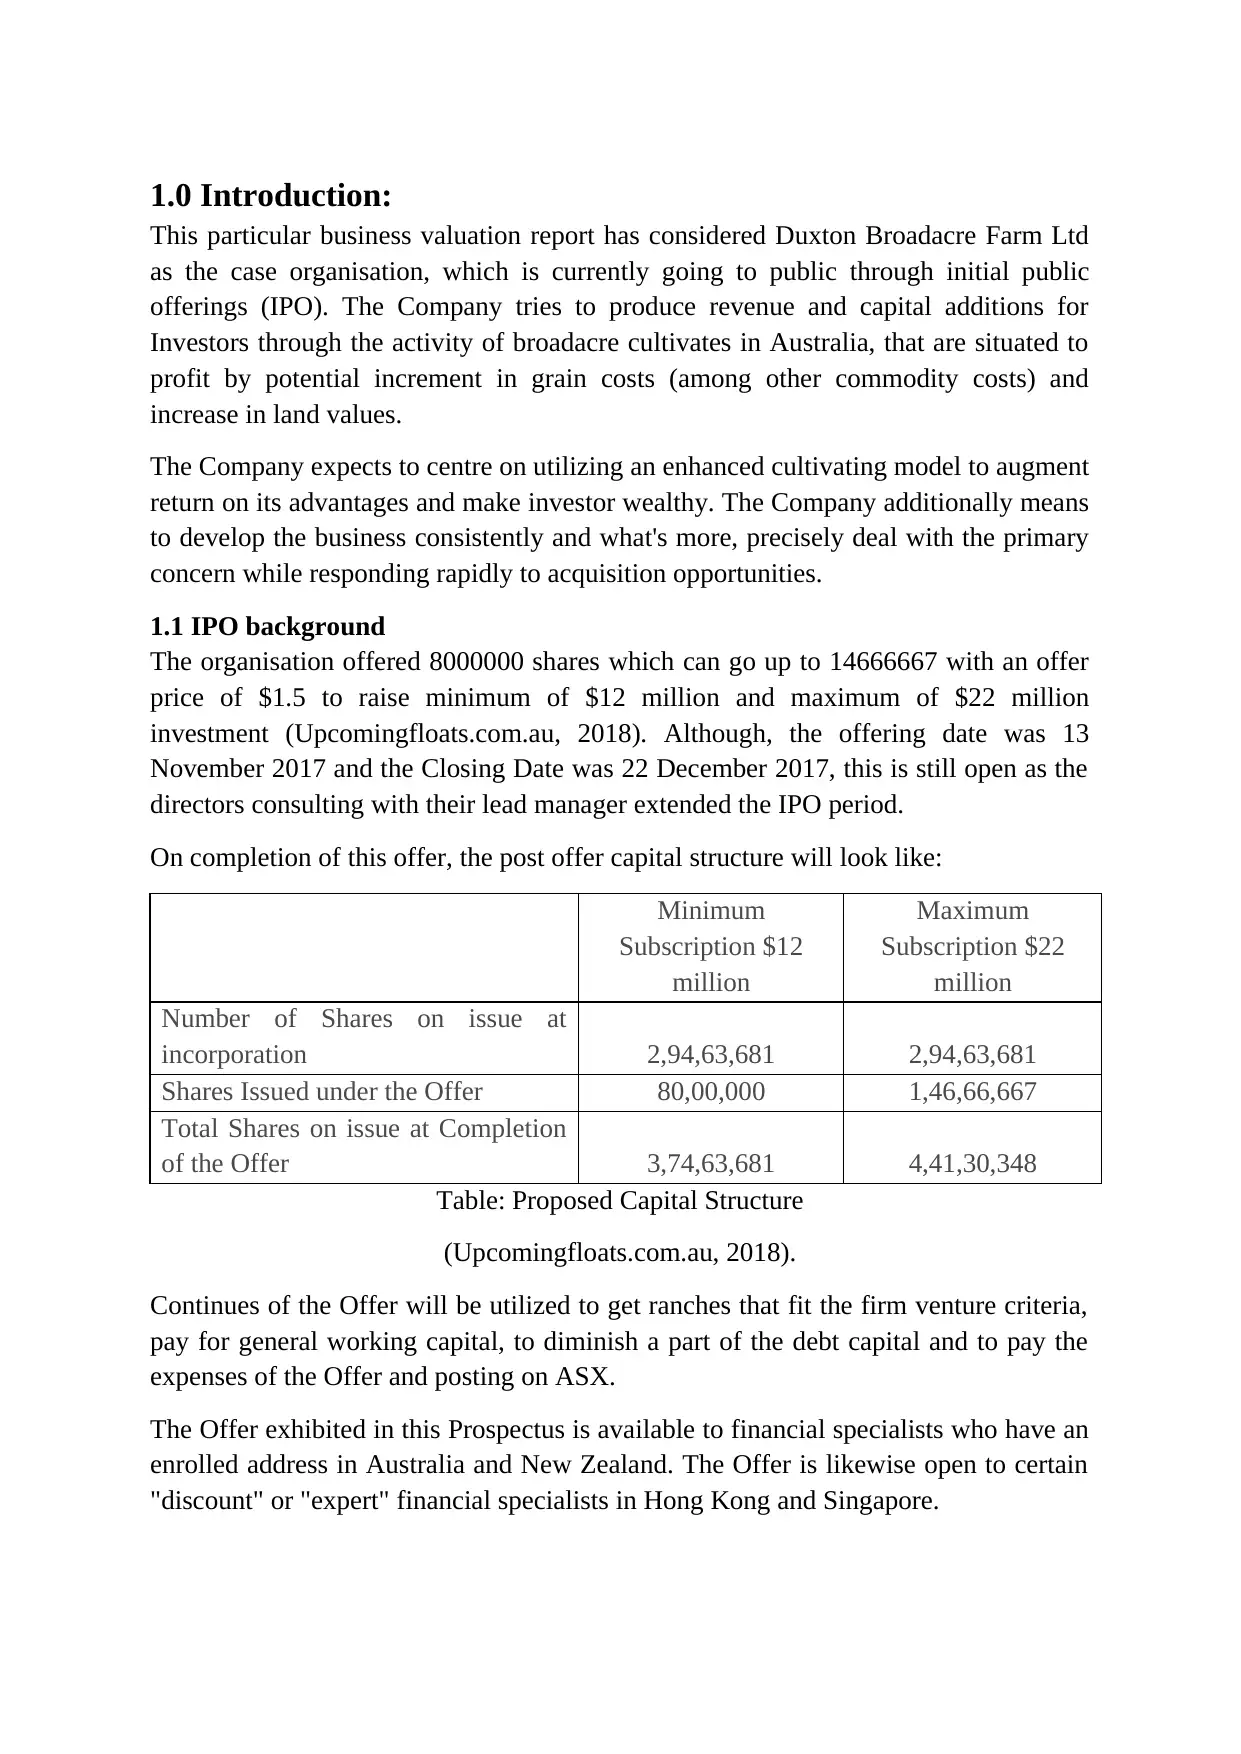
On completion of this offer, the post offer capital structure will look like:
Minimum
Subscription $12
million
Maximum
Subscription $22
million
Number of Shares on issue at
incorporation 2,94,63,681 2,94,63,681
Shares Issued under the Offer 80,00,000 1,46,66,667
Total Shares on issue at Completion
of the Offer 3,74,63,681 4,41,30,348
Table: Proposed Capital Structure
(Upcomingfloats.com.au, 2018).
Continues of the Offer will be utilized to get ranches that fit the firm venture criteria,
pay for general working capital, to diminish a part of the debt capital and to pay the
expenses of the Offer and posting on ASX.
The Offer exhibited in this Prospectus is available to financial specialists who have an
enrolled address in Australia and New Zealand. The Offer is likewise open to certain
"discount" or "expert" financial specialists in Hong Kong and Singapore.
This particular business valuation report has considered Duxton Broadacre Farm Ltd
as the case organisation, which is currently going to public through initial public
offerings (IPO). The Company tries to produce revenue and capital additions for
Investors through the activity of broadacre cultivates in Australia, that are situated to
profit by potential increment in grain costs (among other commodity costs) and
increase in land values.
The Company expects to centre on utilizing an enhanced cultivating model to augment
return on its advantages and make investor wealthy. The Company additionally means
to develop the business consistently and what's more, precisely deal with the primary
concern while responding rapidly to acquisition opportunities.
1.1 IPO background
The organisation offered 8000000 shares which can go up to 14666667 with an offer
price of $1.5 to raise minimum of $12 million and maximum of $22 million
investment (Upcomingfloats.com.au, 2018). Although, the offering date was 13
November 2017 and the Closing Date was 22 December 2017, this is still open as the
directors consulting with their lead manager extended the IPO period.
On completion of this offer, the post offer capital structure will look like:
Minimum
Subscription $12
million
Maximum
Subscription $22
million
Number of Shares on issue at
incorporation 2,94,63,681 2,94,63,681
Shares Issued under the Offer 80,00,000 1,46,66,667
Total Shares on issue at Completion
of the Offer 3,74,63,681 4,41,30,348
Table: Proposed Capital Structure
(Upcomingfloats.com.au, 2018).
Continues of the Offer will be utilized to get ranches that fit the firm venture criteria,
pay for general working capital, to diminish a part of the debt capital and to pay the
expenses of the Offer and posting on ASX.
The Offer exhibited in this Prospectus is available to financial specialists who have an
enrolled address in Australia and New Zealand. The Offer is likewise open to certain
"discount" or "expert" financial specialists in Hong Kong and Singapore.
Paraphrase This Document
Need a fresh take? Get an instant paraphrase of this document with our AI Paraphraser
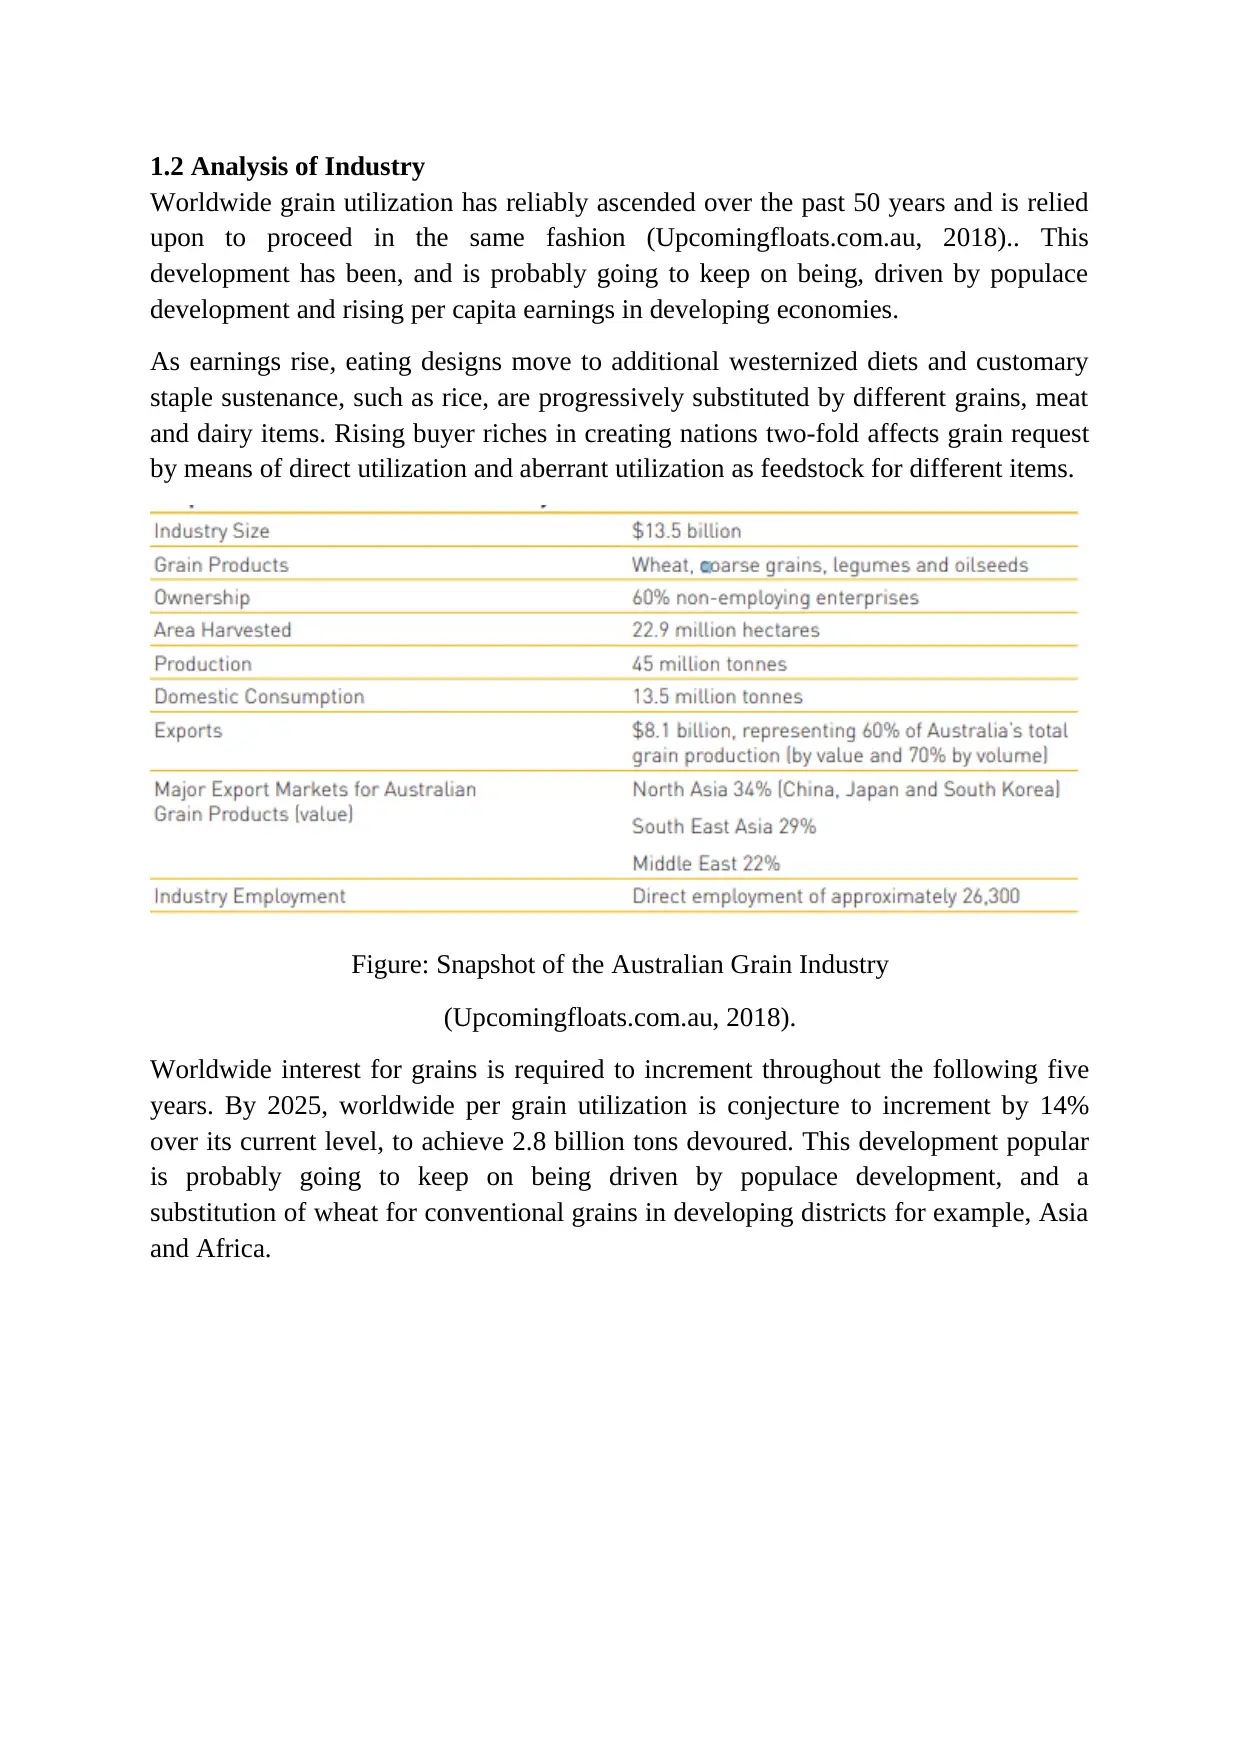
1.2 Analysis of Industry
Worldwide grain utilization has reliably ascended over the past 50 years and is relied
upon to proceed in the same fashion (Upcomingfloats.com.au, 2018).. This
development has been, and is probably going to keep on being, driven by populace
development and rising per capita earnings in developing economies.
As earnings rise, eating designs move to additional westernized diets and customary
staple sustenance, such as rice, are progressively substituted by different grains, meat
and dairy items. Rising buyer riches in creating nations two-fold affects grain request
by means of direct utilization and aberrant utilization as feedstock for different items.
Figure: Snapshot of the Australian Grain Industry
(Upcomingfloats.com.au, 2018).
Worldwide interest for grains is required to increment throughout the following five
years. By 2025, worldwide per grain utilization is conjecture to increment by 14%
over its current level, to achieve 2.8 billion tons devoured. This development popular
is probably going to keep on being driven by populace development, and a
substitution of wheat for conventional grains in developing districts for example, Asia
and Africa.
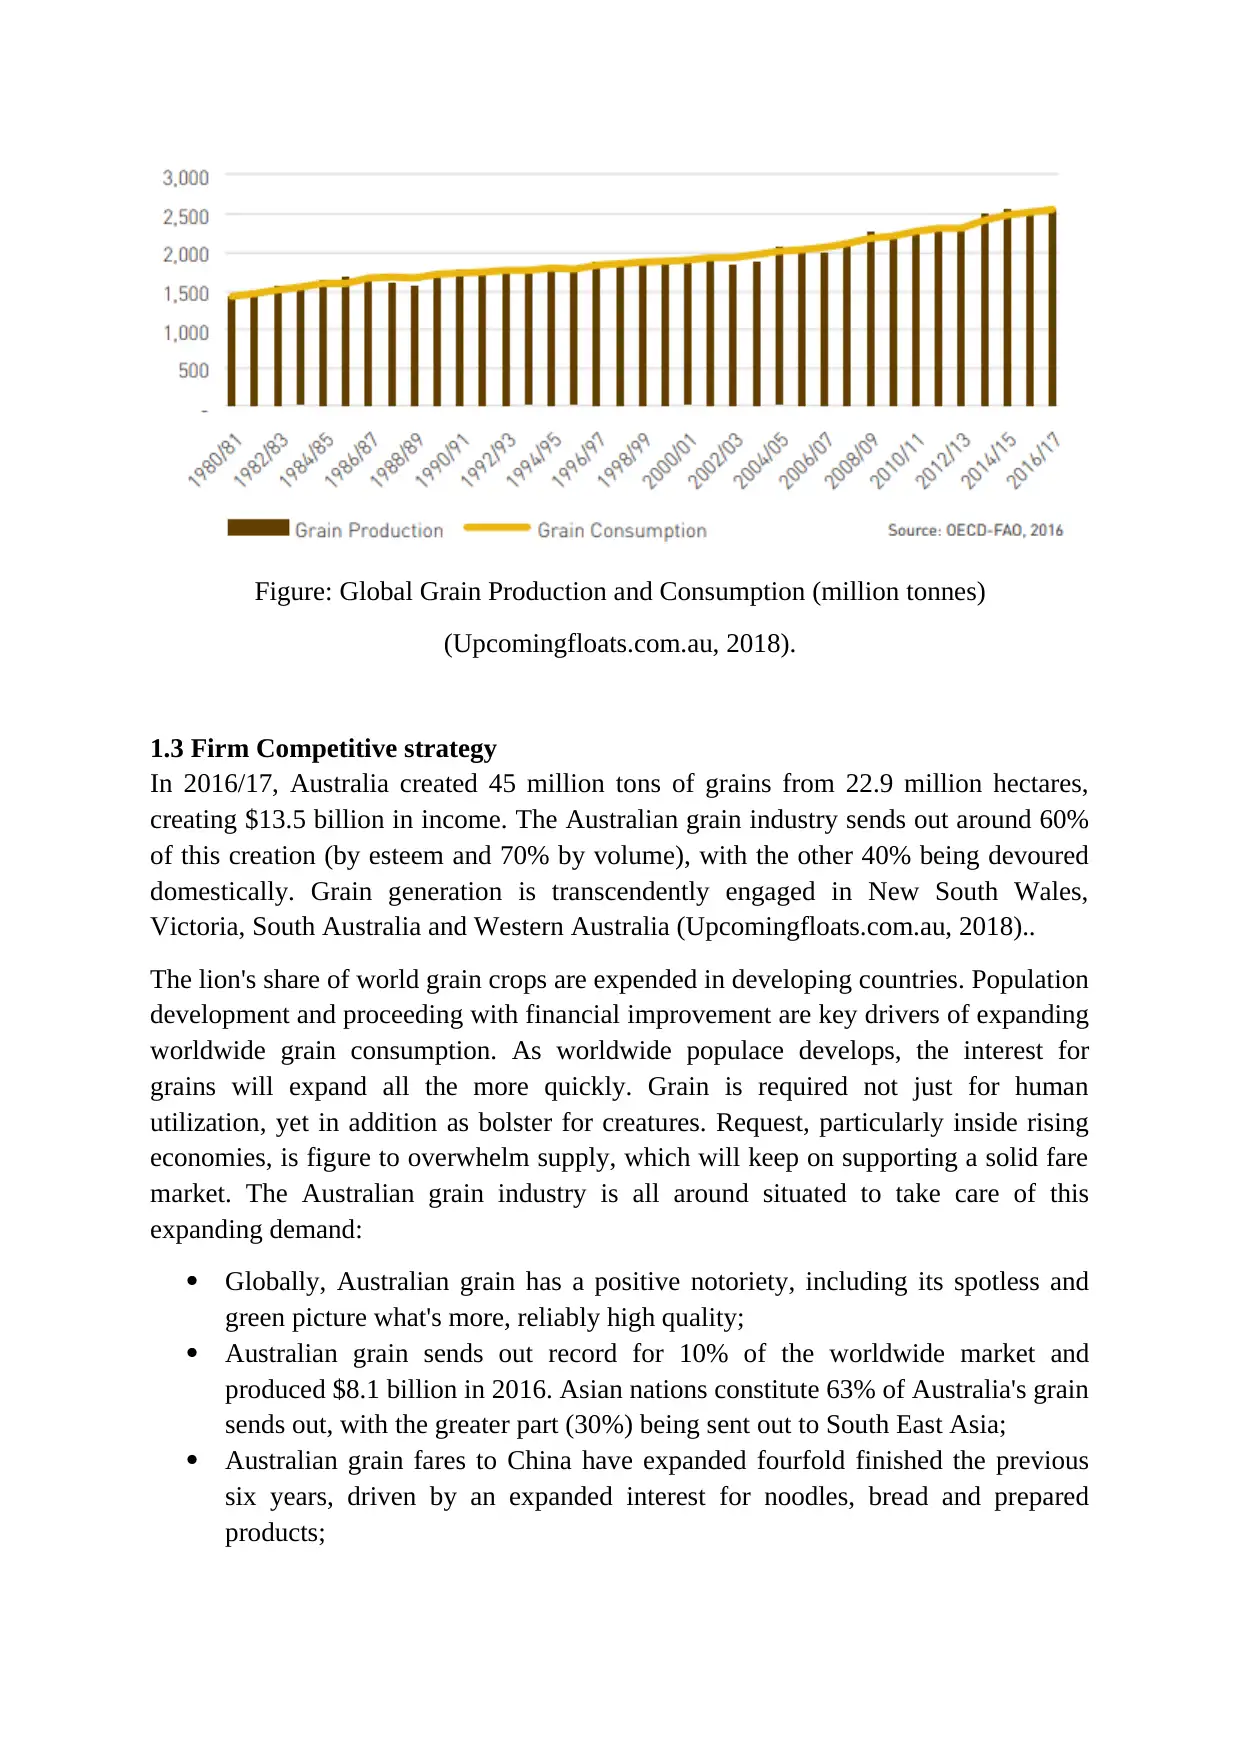
Figure: Global Grain Production and Consumption (million tonnes)
(Upcomingfloats.com.au, 2018).
1.3 Firm Competitive strategy
In 2016/17, Australia created 45 million tons of grains from 22.9 million hectares,
creating $13.5 billion in income. The Australian grain industry sends out around 60%
of this creation (by esteem and 70% by volume), with the other 40% being devoured
domestically. Grain generation is transcendently engaged in New South Wales,
Victoria, South Australia and Western Australia (Upcomingfloats.com.au, 2018)..
The lion's share of world grain crops are expended in developing countries. Population
development and proceeding with financial improvement are key drivers of expanding
worldwide grain consumption. As worldwide populace develops, the interest for
grains will expand all the more quickly. Grain is required not just for human
utilization, yet in addition as bolster for creatures. Request, particularly inside rising
economies, is figure to overwhelm supply, which will keep on supporting a solid fare
market. The Australian grain industry is all around situated to take care of this
expanding demand:
Globally, Australian grain has a positive notoriety, including its spotless and
green picture what's more, reliably high quality;
Australian grain sends out record for 10% of the worldwide market and
produced $8.1 billion in 2016. Asian nations constitute 63% of Australia's grain
sends out, with the greater part (30%) being sent out to South East Asia;
Australian grain fares to China have expanded fourfold finished the previous
six years, driven by an expanded interest for noodles, bread and prepared
products;
⊘ This is a preview!⊘
Do you want full access?
Subscribe today to unlock all pages.
Trusted by 1+ million students worldwide
Australian wheat makes up 58%, 26% and 56% of Indonesia, South Korea and
Vietnam's aggregate wheat imports, individually;
Over the previous decade, Australian grain sends out for domesticated animals
bolster and malting has more than multiplied from 3.1 Mt to 7 Mt.29 This
development in request has been driven overwhelmingly by the developing
Chinese sustenance and refreshment showcase, which expends 30% of
Australia's aggregate grain production (Upcomingfloats.com.au, 2018).
As the Asian area keeps on developing, interest for grains will keep on rise.
2.0 Analysis of accounting method and earning management
The Company is a revenue driven substance for money related detailing purposes
under Australian Accounting Standards. Material bookkeeping arrangements
embraced in the planning of these pro forma financial statements are exhibited
underneath and have been reliably connected unless expressed generally.
The money related data exhibited in the Plan is exhibited in a contracted shape
furthermore, does not contain the majority of the divulgences that are normally given
in a yearly report arranged as per the Corporations Act.
During the IPO, the organisation has made creation forecasts. However, any estimates
or forward looking explanations are expectations just and are liable to different natural
hazard variables and vulnerabilities that could make the Company's genuine outcomes
vary substantially from the outcomes communicated or foreseen in these figures or
proclamations (Reilly, 2017).
Such gauges or proclamations are not ensures of future execution and include known
and obscure dangers, vulnerabilities, presumptions what's more, other vital elements, a
large number of which are outside the ability to control of the Company, its Directors
what's more, administration (Trugman, 2016). Gauges and forward looking
articulations ought to along these lines be perused in conjunction with, and are
qualified by reference to, the discourse of the Pro Forma Historical Financial Data.
The Company presents financial specialists with the opportunity to get to the
Australian grain industry by means of an arrangement of expanded dry land and
watered broadacre ranches. Worldwide grain utilization has reliably ascended in the
course of recent years and is figure to increment 14% over its present level by 2025,
driven by populace development and rising per capita wages in developing economies
(Batkovskiy et al. 2016). As wages rise, eating designs move to more westernize eats
less, and customary staple nourishments, for example, rice, are progressively
substituted by different grains, meat and dairy items. Rising shopper riches in creating
nations twofoldly affects grain request by means of coordinate utilization and
backhanded utilization as feedstock for different items (Patel and Prajapati, 2018).
Paraphrase This Document
Need a fresh take? Get an instant paraphrase of this document with our AI Paraphraser
Request, particularly inside rising economies, is gauge to overwhelm supply, which
will keep on supporting a solid send out market. The Australian grain industry is very
much situated to take care of this expanding demand.
The Company looks to gain by the expanding interest for grain as an imperative
contribution to a range of staple sustenance items and the domesticated animals
industry (Cong, 2017). The Company's goal is to grow its current interests into an
expanded arrangement of high caliber, productive broadacre ranches. The Company
expects to accomplish this target through the procurement and collection of land rich
packages of properties that have clear degree for advancement to enhance operational
efficiencies and deliver a various scope of items (counting as an aide domesticated
animals and cotton) to diminish chance. The Company's venture postulation is driven
by long haul development in worldwide grain request meaning critical working edges
and enhanced farmland esteems after some time, furnishing investors with both
progressing yearly operational yield and longer-term capital development.
3.0 Analysis of performance using financial ratio analysis
While analysing performance of any organisation, one have keep an eye over various
financial ratios in attempting to investigate an organization's general execution. The
proportions are helpful in various circumstances when the organization's money
related condition, gainfulness, and proficiency in utilizing its benefits should be
comprehended (Chiang, 2016).
Utilizing the ratio analysis can help to reveal insight into such imperative issues as the
organization's capacity to meet its commitments, its capital structure, how well it
utilizes its assets to produce pay, and how gainful it is (Manimala and Wasdani,
2015).
At the point when utilized appropriately, the budgetary proportions can be a helpful
device in chosen business valuation (Carter, Bizequity Llc, 2014). The undeniable
advantage is that they can enable the analyst to recognize the organization's qualities
and shortcomings and contrast it with its industry peers.
Surveying very much chosen proportions can enable in valuation to work in various
ways. Maybe the most valuable territory is the choice of fitting valuation products that
provide assistance in building up the organization's financial strategy in connection to
its money related execution measures (Titman et al. 2017). Valuation products are
generally gotten from equivalent business deals, influencing contender organizations.
Thus, it is necessary that one have a factual scope of products to look over.
3.1 Ratio Analysis
Considering the IPO of Duxton Broadacre Farm Ltd, when look into the average
collection periods, it has seen that it was 22.74 days during year end June 2015. It
reduced to 17.36 days in June 2016 and increased to 51.31 days in June 2017. It has
seen that average collection period is of noteworthy significance when utilized as a
part of conjunction with liquidity proportions.
A short collection period implies provoke gathering and better administration of
receivables. A more extended collection period may contrarily influence the transient
obligation paying capacity of the business according to investigators.
Regardless of whether a collection period is great or awful, relies upon the credit
terms permitted by the organization. In this case, as the normal collection time is 50
days and the organization's credit terms are 60 days; the normal collection time of 50
days would be viewed as great (Ahmed and Dina, 2018).
Similarly, the inventory turnover ratio, indicates how soon the organisation is able to
convert its inventory amount into dollar amount. The given case has shown that
Duxton Broadacre Farm Ltd took less than 100 days to convert their inventory
amount, which is a great sign for operation efficiency.
The profitability position of the company has shown negative figure during most
recent audited time frame. However, previous two years have experienced a
significant profitability position. Even though, this negative figure is a cause of
concern, it can be said that the organisation has the sufficient capability to control this
shortcoming. The liquidity position of the organisation, over the last three years are
supporting this view. It has also seen that such negative figure is there may be because
of the review for the IPO purpose.
Now, if the solvency ratios are taken into account, then it can be said that the
organisation till date maintained a balanced capital structure and thus the solvency
aspect remained in a good position.
[Ratio analyses are shown in appendix section]
3.2 DoPont Analysis
In addition to ratio analysis, the analyst has also performed DoPont Analysis. This
model was produced to examine ROE and the impacts distinctive business execution
measures have on this proportion. So financial specialists are not searching for huge or
little yield numbers from this model. Rather, they are hoping to break down what is
causing the present ROE. For instance, the speculators will be unsatisfied with a low
ROE [shown in appendix section]]. Therefore, the administration can utilize this
equation to pinpoint the issue territory whether it is a lower overall revenue, resource
turnover, or poor money related utilizing (Herawati et al. 2017).
Once the issue zone is discovered, administration can endeavour to redress it or
address it with investors. Some typical activities bring down ROE normally and are
⊘ This is a preview!⊘
Do you want full access?
Subscribe today to unlock all pages.
Trusted by 1+ million students worldwide
not an explanation behind financial specialists to be frightened. For example,
quickened deterioration misleadingly brings down ROE in the first place time frames.
This paper passage can be called attention to with the Dupont examination and
shouldn't influence a financial specialist's sentiment of the organization.
3.3 Risk Analysis
The Altman Z Score is utilized to foresee the probability that a business will go
bankrupt inside the following two years. The equation depends on data found in the
wage explanation and monetary record of an association; thusly, it can be promptly
gotten from normally accessible data (Chiang, 2016). Given the simplicity with which
the required data can be discovered, the Z Score is a valuable metric for an outcast
who approaches an organization's budgetary explanations. In its unique frame, the Z
score recipe is as per the following:
Z = 1.2A x 1.4B x 3.3C x 0.6D x 0.99E
The letters in the recipe assign the accompanying measures:
A = Working capital/Total resources
B = Retained income/Total resources
C = Earnings before premium and duties/Total resources
D = Market estimation of value/Book estimation of aggregate liabilities
E = Sales/Total resources
A Z score of more prominent than 2.99 implies that the element being estimated is
sheltered from liquidation. A score of under 1.81 implies that a business is at
impressive danger of going into insolvency, while scores in the middle of ought to be
viewed as a warning for conceivable issues (Cong, 2017). The model has ended up
being sensibly precise in anticipating the future of elements under examination. Here,
the value of z is above 3, which indicates that there is no immediate risk involve in
operation of the organisation.
Paraphrase This Document
Need a fresh take? Get an instant paraphrase of this document with our AI Paraphraser
This scoring framework was initially intended for assembling firms having resources
of $1 at least million. Given the focused on nature of the model, it has since been
altered to be relevant to different sorts of associations.
This way to deal with assessing associations is superior to utilizing only a solitary
proportion, since it unites the impacts of numerous things - resources, benefits, and
market esteem. Accordingly, it is most regularly utilized by leasers and loan
specialists to decide the hazard related with stretching out assets to clients and
borrowers.
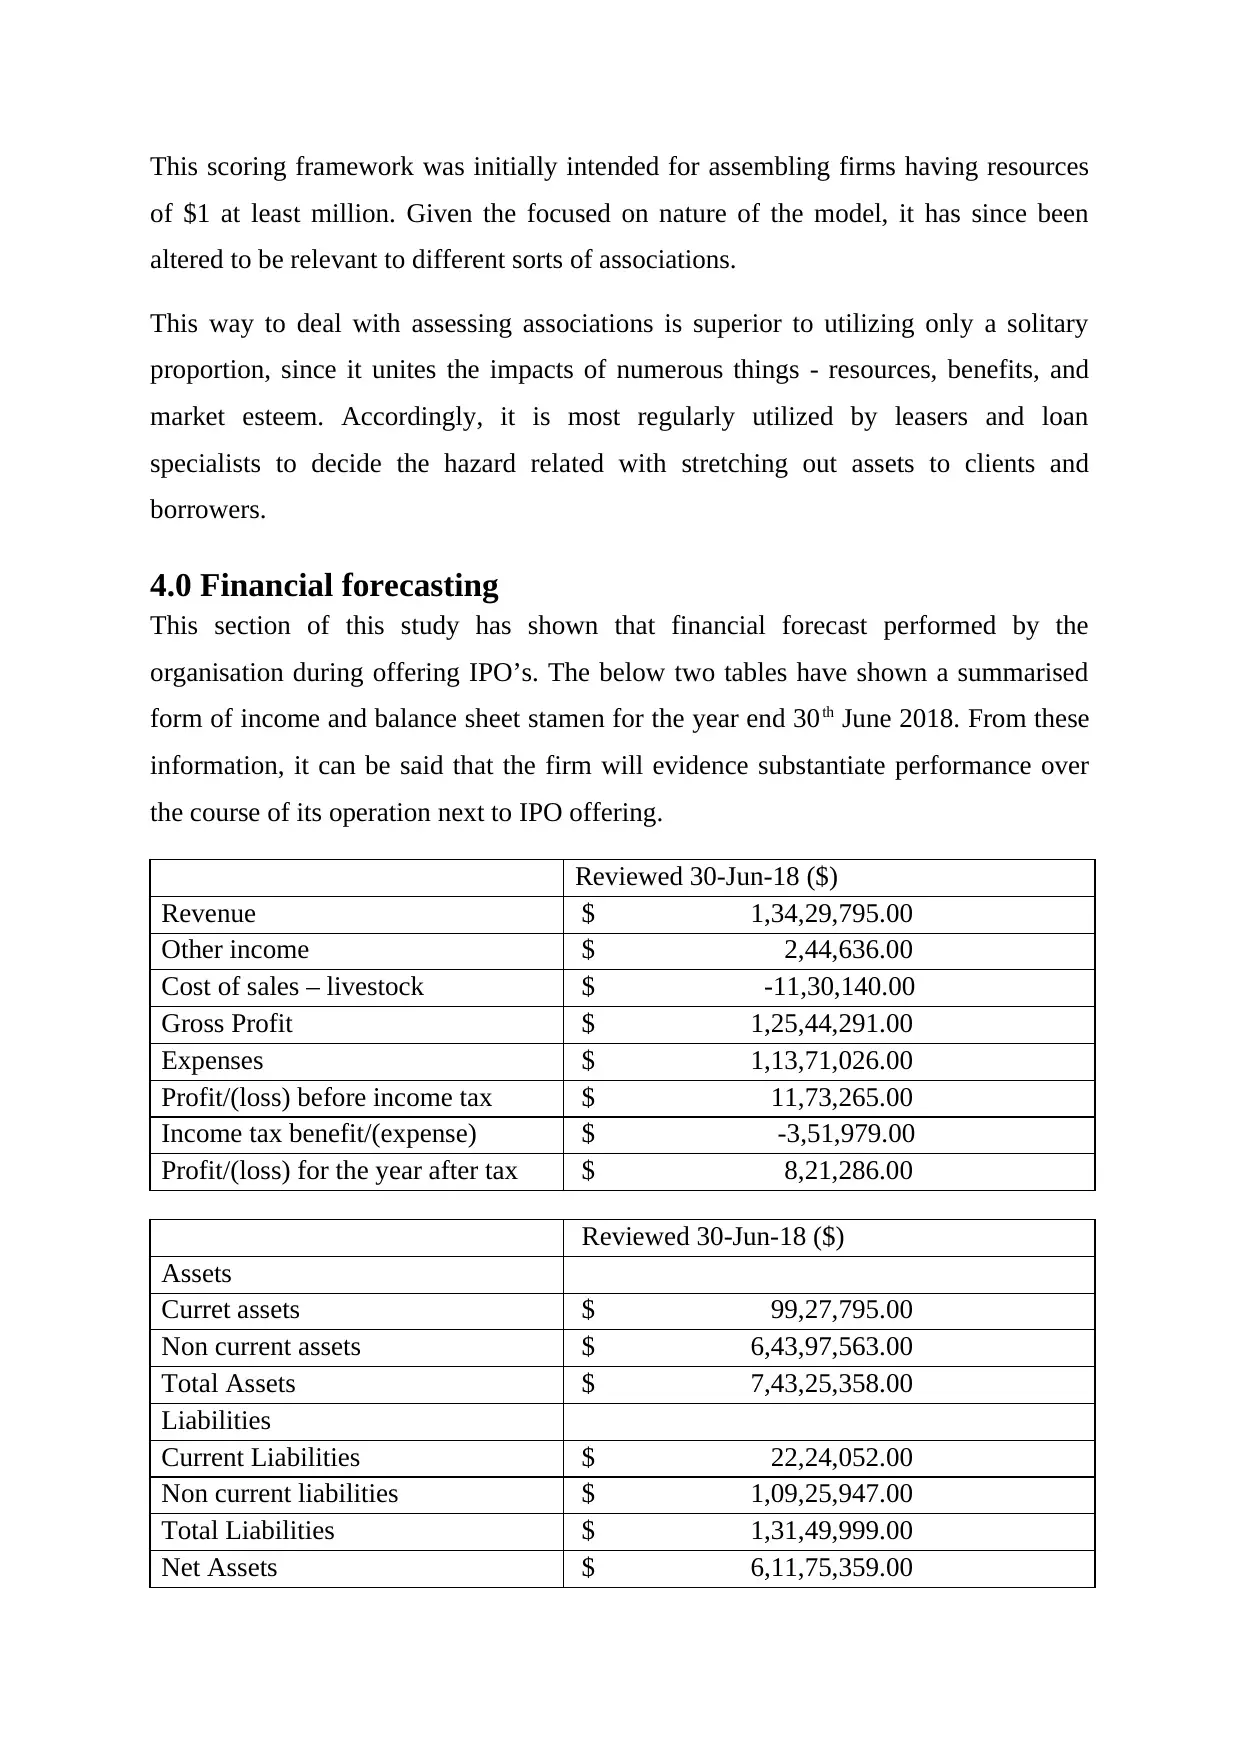
4.0 Financial forecasting
This section of this study has shown that financial forecast performed by the
organisation during offering IPO’s. The below two tables have shown a summarised
form of income and balance sheet stamen for the year end 30th June 2018. From these
information, it can be said that the firm will evidence substantiate performance over
the course of its operation next to IPO offering.
Reviewed 30-Jun-18 ($)
Revenue $ 1,34,29,795.00
Other income $ 2,44,636.00
Cost of sales – livestock $ -11,30,140.00
Gross Profit $ 1,25,44,291.00
Expenses $ 1,13,71,026.00
Profit/(loss) before income tax $ 11,73,265.00
Income tax benefit/(expense) $ -3,51,979.00
Profit/(loss) for the year after tax $ 8,21,286.00
Reviewed 30-Jun-18 ($)
Assets
Curret assets $ 99,27,795.00
Non current assets $ 6,43,97,563.00
Total Assets $ 7,43,25,358.00
Liabilities
Current Liabilities $ 22,24,052.00
Non current liabilities $ 1,09,25,947.00
Total Liabilities $ 1,31,49,999.00
Net Assets $ 6,11,75,359.00
of $1 at least million. Given the focused on nature of the model, it has since been
altered to be relevant to different sorts of associations.
This way to deal with assessing associations is superior to utilizing only a solitary
proportion, since it unites the impacts of numerous things - resources, benefits, and
market esteem. Accordingly, it is most regularly utilized by leasers and loan
specialists to decide the hazard related with stretching out assets to clients and
borrowers.
4.0 Financial forecasting
This section of this study has shown that financial forecast performed by the
organisation during offering IPO’s. The below two tables have shown a summarised
form of income and balance sheet stamen for the year end 30th June 2018. From these
information, it can be said that the firm will evidence substantiate performance over
the course of its operation next to IPO offering.
Reviewed 30-Jun-18 ($)
Revenue $ 1,34,29,795.00
Other income $ 2,44,636.00
Cost of sales – livestock $ -11,30,140.00
Gross Profit $ 1,25,44,291.00
Expenses $ 1,13,71,026.00
Profit/(loss) before income tax $ 11,73,265.00
Income tax benefit/(expense) $ -3,51,979.00
Profit/(loss) for the year after tax $ 8,21,286.00
Reviewed 30-Jun-18 ($)
Assets
Curret assets $ 99,27,795.00
Non current assets $ 6,43,97,563.00
Total Assets $ 7,43,25,358.00
Liabilities
Current Liabilities $ 22,24,052.00
Non current liabilities $ 1,09,25,947.00
Total Liabilities $ 1,31,49,999.00
Net Assets $ 6,11,75,359.00
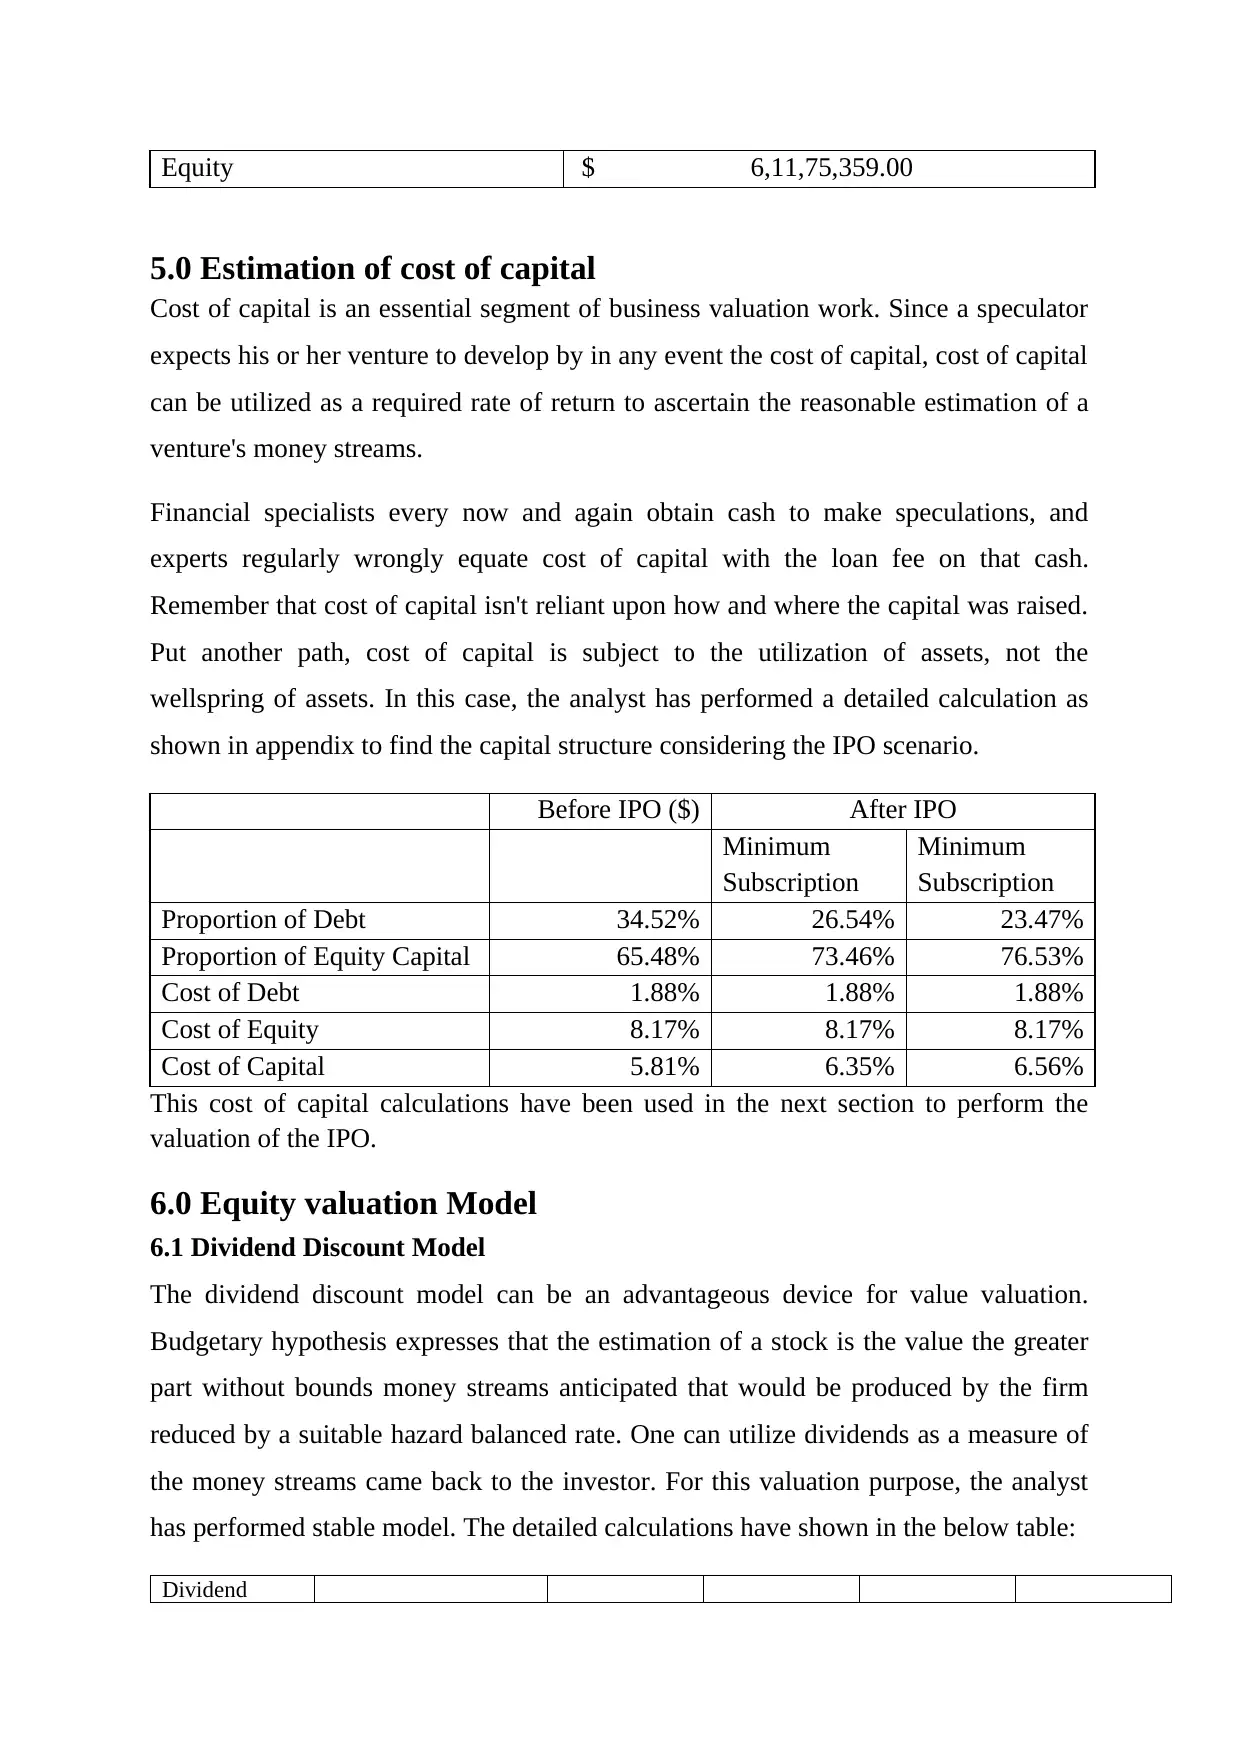
Equity $ 6,11,75,359.00
5.0 Estimation of cost of capital
Cost of capital is an essential segment of business valuation work. Since a speculator
expects his or her venture to develop by in any event the cost of capital, cost of capital
can be utilized as a required rate of return to ascertain the reasonable estimation of a
venture's money streams.
Financial specialists every now and again obtain cash to make speculations, and
experts regularly wrongly equate cost of capital with the loan fee on that cash.
Remember that cost of capital isn't reliant upon how and where the capital was raised.
Put another path, cost of capital is subject to the utilization of assets, not the
wellspring of assets. In this case, the analyst has performed a detailed calculation as
shown in appendix to find the capital structure considering the IPO scenario.
Before IPO ($) After IPO
Minimum
Subscription
Minimum
Subscription
Proportion of Debt 34.52% 26.54% 23.47%
Proportion of Equity Capital 65.48% 73.46% 76.53%
Cost of Debt 1.88% 1.88% 1.88%
Cost of Equity 8.17% 8.17% 8.17%
Cost of Capital 5.81% 6.35% 6.56%
This cost of capital calculations have been used in the next section to perform the
valuation of the IPO.
6.0 Equity valuation Model
6.1 Dividend Discount Model
The dividend discount model can be an advantageous device for value valuation.
Budgetary hypothesis expresses that the estimation of a stock is the value the greater
part without bounds money streams anticipated that would be produced by the firm
reduced by a suitable hazard balanced rate. One can utilize dividends as a measure of
the money streams came back to the investor. For this valuation purpose, the analyst
has performed stable model. The detailed calculations have shown in the below table:
Dividend
⊘ This is a preview!⊘
Do you want full access?
Subscribe today to unlock all pages.
Trusted by 1+ million students worldwide
1 out of 22
Related Documents


Your All-in-One AI-Powered Toolkit for Academic Success.
+13062052269
info@desklib.com
Available 24*7 on WhatsApp / Email
![[object Object]](/_next/static/media/star-bottom.7253800d.svg)
Unlock your academic potential
Copyright © 2020–2026 A2Z Services. All Rights Reserved. Developed and managed by ZUCOL.