Statistics Homework: Data Analysis of DVD Collection and Skewness

Verified

Added on  2020/03/16

|4
|398
|135
Homework Assignment
AI Summary
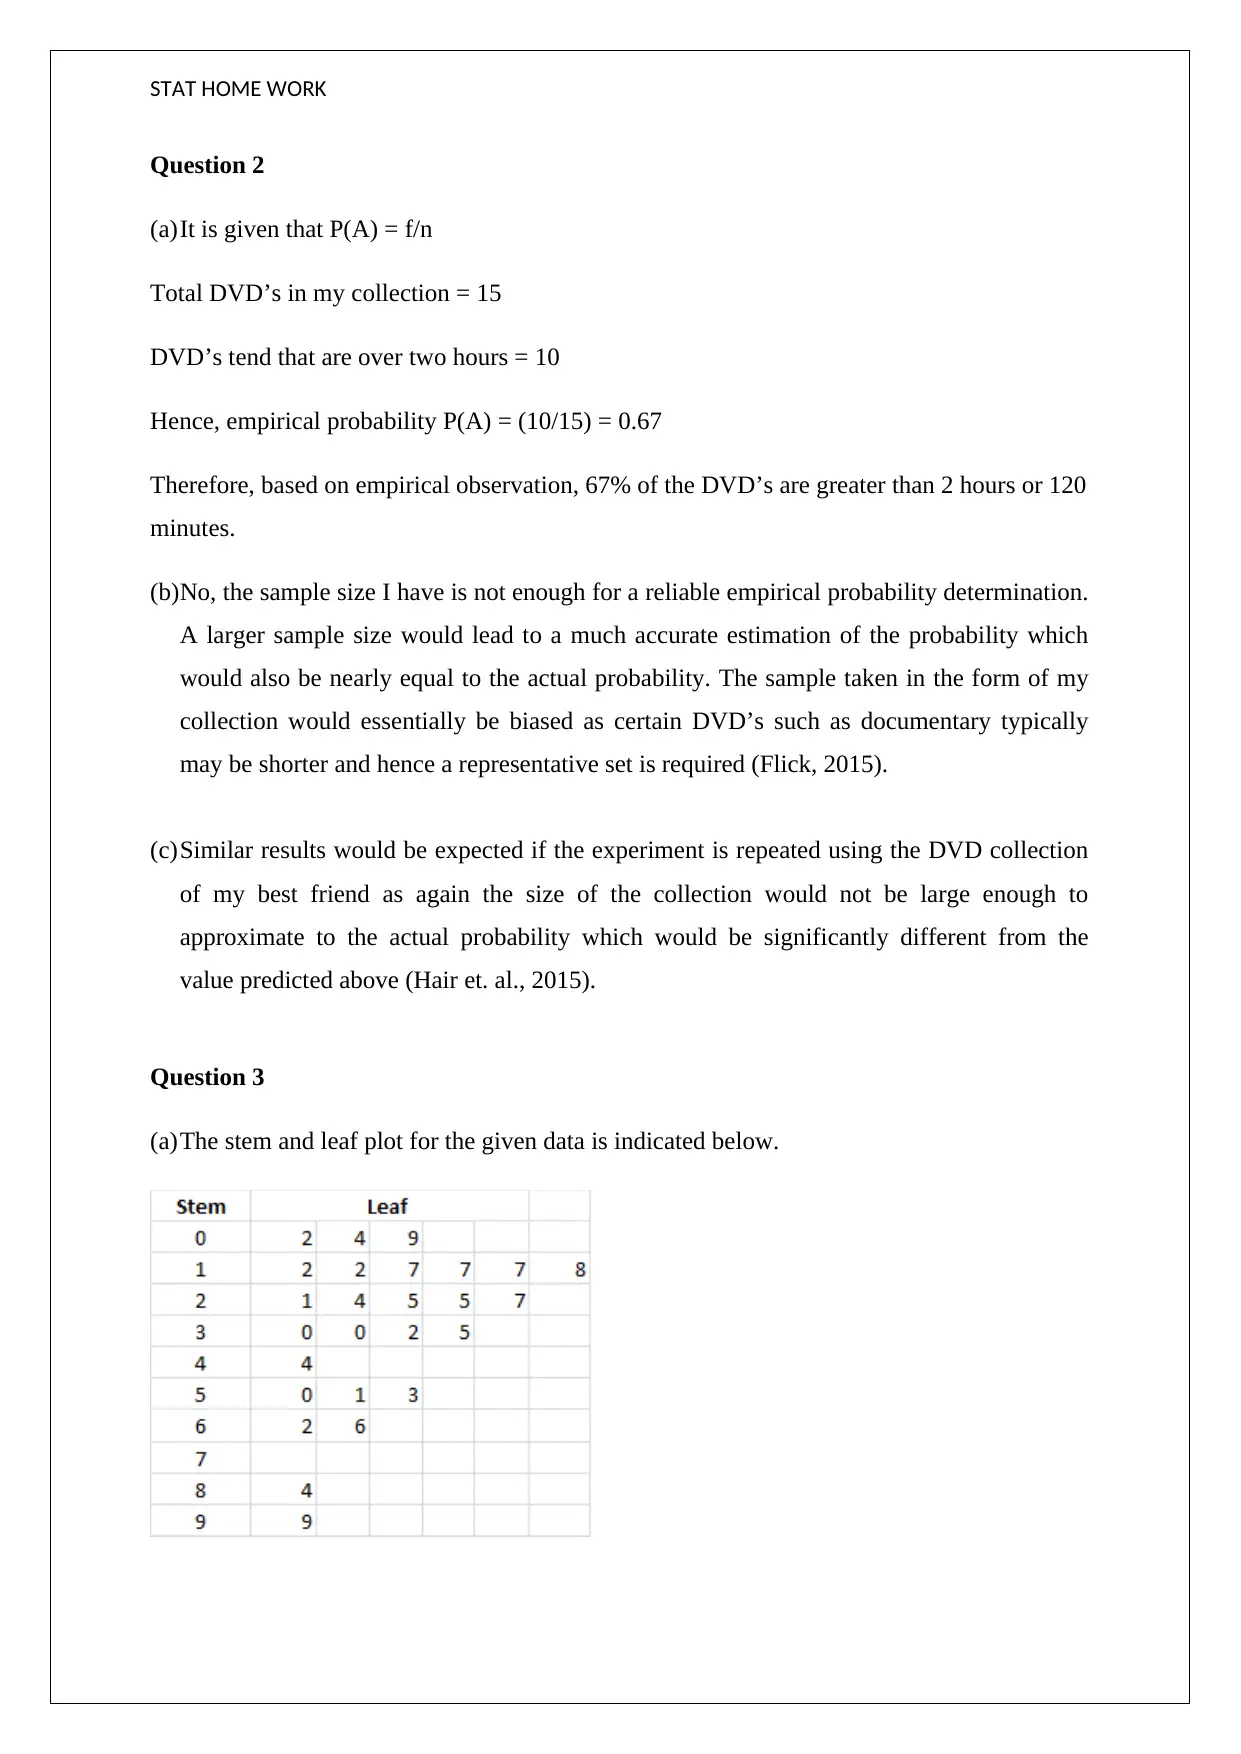
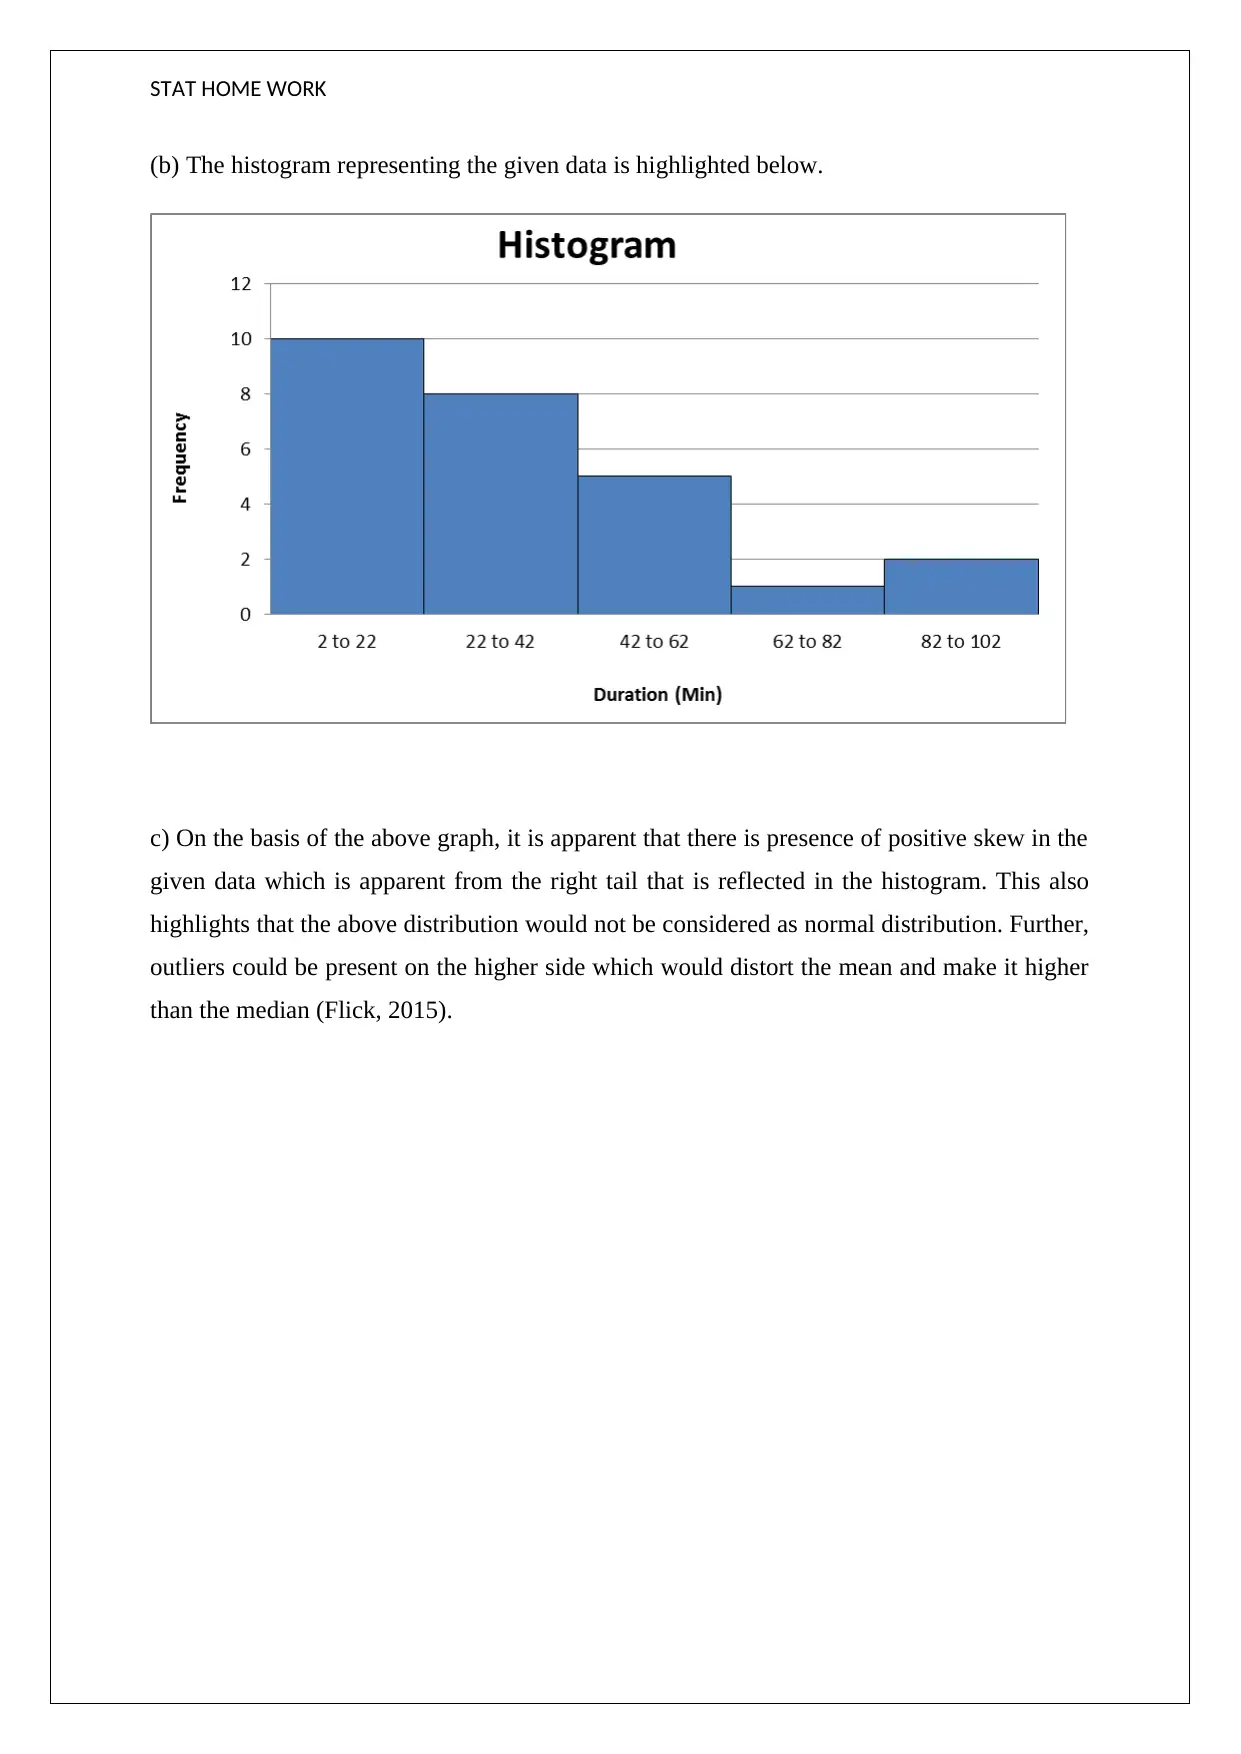
This statistics homework assignment analyzes a DVD collection to determine empirical probability, data skewness, and the presence of outliers. The solution begins by calculating the empirical probability of DVDs exceeding two hours in length based on a sample of 15 DVDs. It then discusses the limitations of the sample size and the potential for bias. The assignment continues by presenting a stem and leaf plot and histogram of the data. The analysis reveals a positive skew in the data distribution, indicating that the data is not normally distributed. The solution also mentions the potential for outliers to affect the mean. The assignment references relevant literature, including Flick (2015) and Hair et al. (2015), to support the statistical concepts and methodologies used.
Document Page
STAT HOME WORK
STUDENT ID:
[Pick the date]
tabler-icon-diamond-filled.svg

Paraphrase This Document

Need a fresh take? Get an instant paraphrase of this document with our AI Paraphraser
Document Page
STAT HOME WORK
Question 2
(a)It is given that P(A) = f/n
Total DVD’s in my collection = 15
DVD’s tend that are over two hours = 10
Hence, empirical probability P(A) = (10/15) = 0.67
Therefore, based on empirical observation, 67% of the DVD’s are greater than 2 hours or 120
minutes.
(b)No, the sample size I have is not enough for a reliable empirical probability determination.
A larger sample size would lead to a much accurate estimation of the probability which
would also be nearly equal to the actual probability. The sample taken in the form of my
collection would essentially be biased as certain DVD’s such as documentary typically
may be shorter and hence a representative set is required (Flick, 2015).
(c)Similar results would be expected if the experiment is repeated using the DVD collection
of my best friend as again the size of the collection would not be large enough to
approximate to the actual probability which would be significantly different from the
value predicted above (Hair et. al., 2015).
Question 3
(a)The stem and leaf plot for the given data is indicated below.
Document Page
STAT HOME WORK
(b) The histogram representing the given data is highlighted below.
c) On the basis of the above graph, it is apparent that there is presence of positive skew in the
given data which is apparent from the right tail that is reflected in the histogram. This also
highlights that the above distribution would not be considered as normal distribution. Further,
outliers could be present on the higher side which would distort the mean and make it higher
than the median (Flick, 2015).
Document Page
STAT HOME WORK
References
Flick, U. (2015). Introducing research methodology: A beginner's guide to doing a research
project, 4th ed., New York: Sage Publications.
Hair, J. F., Wolfinbarger, M., Money, A. H., Samouel, P., and Page, M. J. (2015). Essentials of
business research methods, 2nd ed., New York: Routledge.
chevron_up_icon
1 out of 4
circle_padding
hide_on_mobile
zoom_out_icon
[object Object]