Efficiency of Dye Sensitized Solar Cells using TiO2 Film

Verified

Added on  2023/04/20

|24
|7844
|212
Report
AI Summary
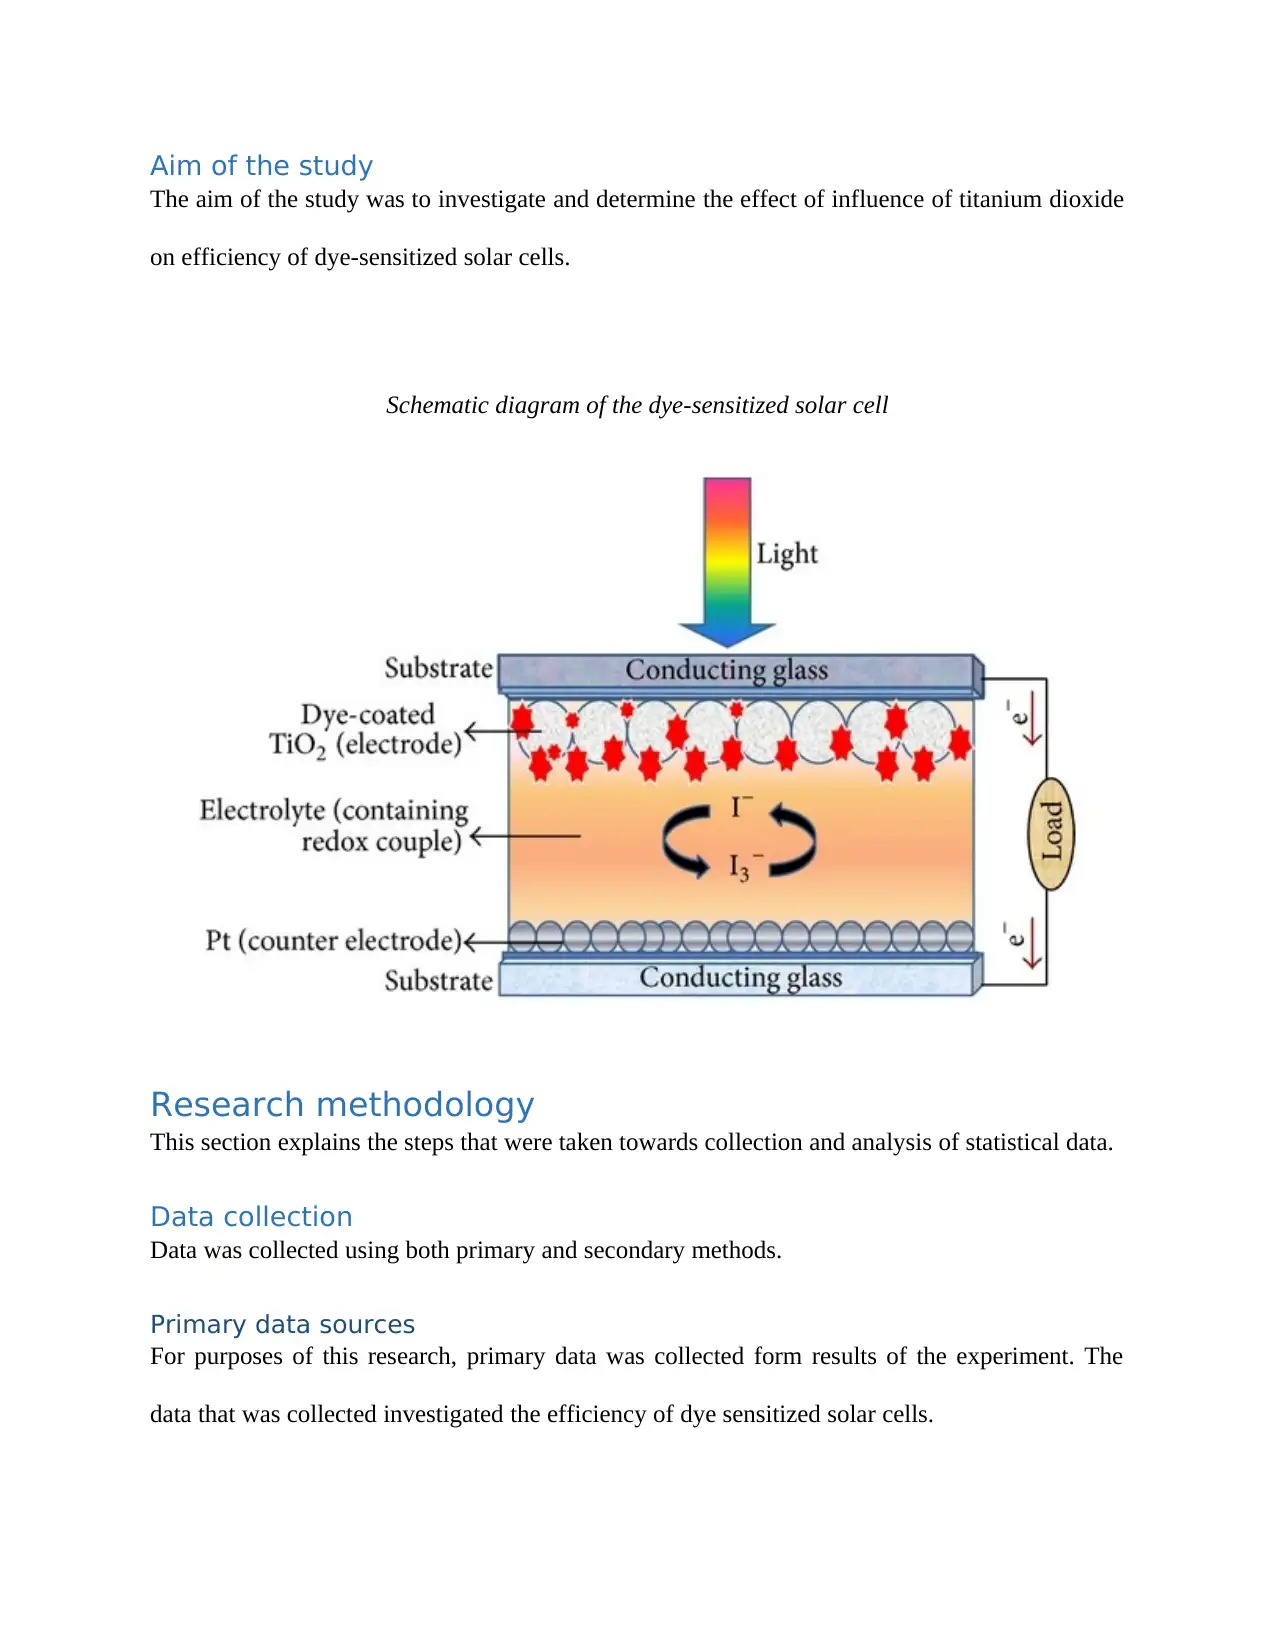
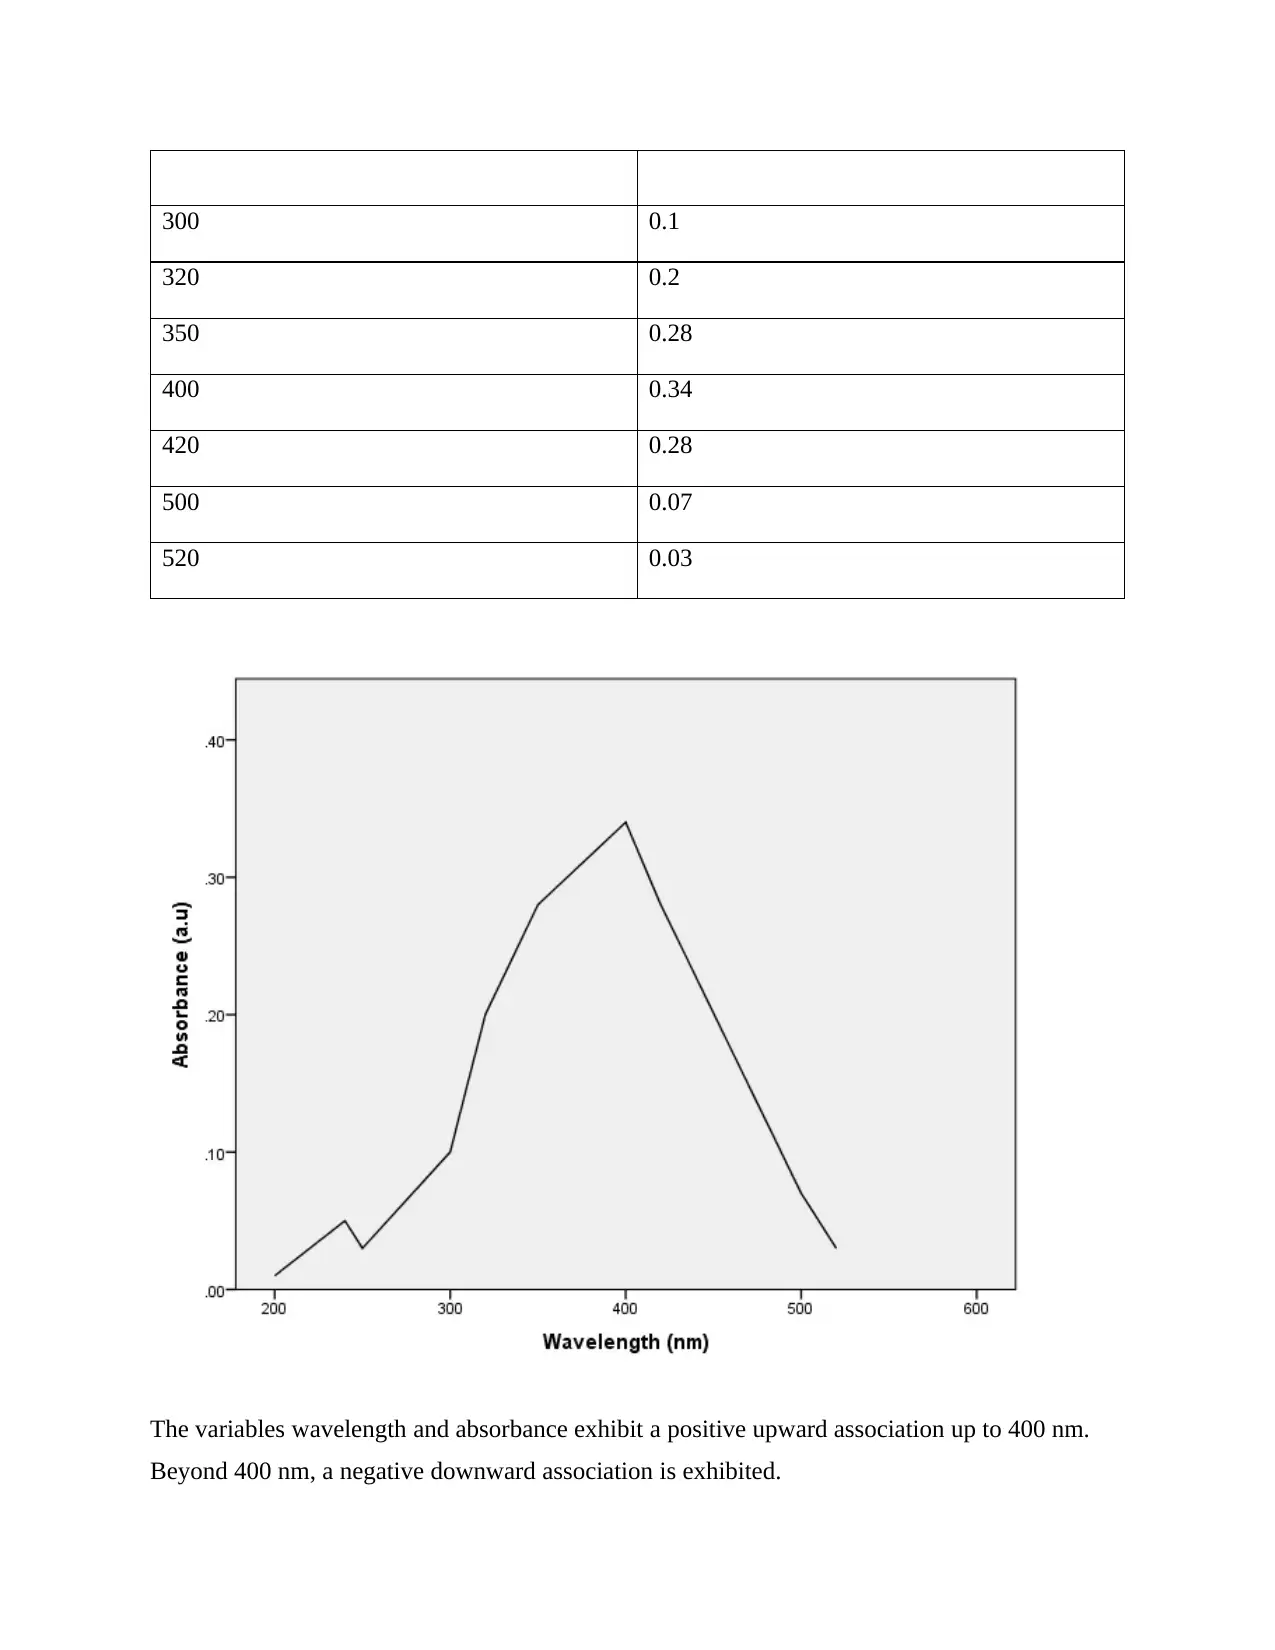
This report investigates the efficiency of dye-sensitized solar cells (DSSCs) using titanium dioxide (TiO2) film. The study explores the potential of renewable energy sources, specifically solar energy, as an alternative to non-renewable sources. The research employs both primary and secondary data collection methods, including experimental data on DSSC performance using flower extracts as a natural dye, and secondary data from energy databases. The experiment involves the fabrication and testing of DSSCs, measuring parameters such as short circuit current (Isc), open circuit voltage (Voc), fill factor (FF), and efficiency (η) under varying conditions. Statistical analyses, including descriptive and inferential statistics (correlation and regression), are performed to assess the relationships between different variables. The results reveal the influence of TiO2 film thickness on cell performance, with the highest absorption observed at 400 nm. The analysis indicates a positive correlation between efficiency and Isc, and a negative correlation between efficiency and Voc. The report concludes with a discussion of the findings, limitations, and potential improvements to enhance the performance of DSSCs.
Document Page
12/29/2018
EFFICIENCY OF DYE SENSITIZED SOLAR CELLS USING TITANIUM DIOXIDE FILM
tabler-icon-diamond-filled.svg

Paraphrase This Document

Need a fresh take? Get an instant paraphrase of this document with our AI Paraphraser
Document Page
Table of Contents
Introduction.................................................................................................................................................2
Aim of the study......................................................................................................................................3
Research methodology................................................................................................................................3
Data collection.........................................................................................................................................3
Primary data sources...........................................................................................................................3
Secondary data sources.......................................................................................................................4
Experiment..............................................................................................................................................4
Data analysis............................................................................................................................................5
Results.........................................................................................................................................................5
Descriptive statistics................................................................................................................................5
Inferential statistics...............................................................................................................................10
Correlation.........................................................................................................................................10
Regression analysis............................................................................................................................12
Discussion..................................................................................................................................................14
Conclusion.................................................................................................................................................16
References.................................................................................................................................................16
Document Page
Introduction
Energy is an integral aspect of daily life, and the demand for it is expectantly high. Currently,
over 75% of energy consumption is attributed to non-renewable sources such as oil, coal and
natural gas (Carr, 2008). It is anticipated that the non-renewable sources won’t last for more than
200 years. In contrast to these sources of energy, renewable sources are thought to naturally
replenish and do not pollute the environment (Dogan, 2016). As blood is to body power is to
economy of any nation so without it economy will tremble and it will be difficult to run it.
Everywhere throughout the world energy is one of the main issues what's more, every nation is
searching for energy assets as its demand is expanding pointedly. Non-sustainable power sources
are either excessively costly or harming the earth and furthermore they are in the end going to
end in not so distant future. That is the reason the world is moving towards sustainable power
sources which are renewed in a moderately little timeframe.
Due to natural resource depletion and environmental demands, the world has moved to
renewable energy sources. Solar energy has emerged as one of the preferred options in solving
world energy crisis. In spite of the fact that hydroelectric is extremely modest sustainable power
source, however, it isn't accessible to all spots on the planet while on the other hand sunlight
based can possibly assume control over the entire power generation. From time immemorial,
solar energy has been a source of light and heat. In the present-day, solar energy is being used to
produce electricity for domestic and industrial use.
Solar energy harvesting can be done using several technologies (Salim, 2014). Sunlight based
cells are comprised of semiconducting materials, for example, silicon, which are doped with
various impurities. This produces unequal dissemination of free electrons (n-type) on one side of
intersection and abundance of openings (p-type) on opposite side of intersection. Sun based light
Document Page
has photons which hit the sunlight based board and energize the inexactly bound electrons which
are intended to move just one way in sun based cells and along these lines electron-opening sets
are made in individual intersections and power is acquired in outer circuit (O.V., 2010). As a
result of the environmental demands, there has been a considerable decline in the use of silicon-
based solar cells. Whatever the size is, a typical solar cell produces 0.5-0.6-volt DC under no
load and open circuit condition. The current and voltage (power) ratting of a PV cell mainly
depends on its efficiency, size (surface area) and is proportional to the intensity of light striking
the surface of cell.
Dye-sensitized solar cells are among the options that have emerged to replace silicon-based solar
cells for harvesting solar energy (Pan, 2008). These cells have been largely used due to their
flexibility, low-cost, production ease, environmental friendliness and high efficiency in energy
conversion. The efficiency of the solar cells used in a photovoltaic system, in combination with
latitude and climate, determines the annual energy output of the system (Ito, 2012). Major
improvements such as the introduction of dyes, electrolytes have improved the efficiency of
these types of solar cells. At the current, they are the most efficient solar energy technologies
available (Li, 2011).
For purposes of this research we aim at investigating the efficiency of dye sensitized solar cells
using titanium dioxide film. Dye sensitized solar cells convert solar energy into electricity
consisting of conductive cells with dye and electrolyte sandwiched in between. Dye is absorbed
on the titanium dioxide as it absorbs sunlight. The low cost and efficiency of dye-sensitized solar
cells has made these types of cells a center of attention and worldwide research.
tabler-icon-diamond-filled.svg

Paraphrase This Document

Need a fresh take? Get an instant paraphrase of this document with our AI Paraphraser
Document Page
Aim of the study
The aim of the study was to investigate and determine the effect of influence of titanium dioxide
on efficiency of dye-sensitized solar cells.
Schematic diagram of the dye-sensitized solar cell
Research methodology
This section explains the steps that were taken towards collection and analysis of statistical data.
Data collection
Data was collected using both primary and secondary methods.
Primary data sources
For purposes of this research, primary data was collected form results of the experiment. The
data that was collected investigated the efficiency of dye sensitized solar cells.
Document Page
The parameters that were measured were the short circuit current, the voltage for open circuit,
the cell power input, the maximum obtained current, the maximum output and absorbance
spectrum of the flower extract dye.
These parameters were used for calculating the fill factor and efficiency of the dye sensitized
solar cell. The parameters were observed over 10 experimental periods.
Secondary data sources
Secondary data was collected from database sources depicting energy trends over the years.
Secondary data will be accessed through the website https://yearbook.enerdata.net/.
Experiment
An experiment was carried out to investigate the efficiency of dye sensitized solar cells using
titanium dioxide film.
In order to assess the efficiency of dye sensitized solar cells using titanium dioxide, we conduct
an experiment for making a comparison between two dye sensitized solar cells using zinc oxide
and titanium dioxide.
The study used flower extracts as natural organic dye for the dye sensitized solar cell. Ethanol
was used to obtain dye extracts from the flowers. Titanium dioxide was used as the photo
electrode. The electrode was synthesized using techniques of solution extraction and was
deposited on the FTO glass substrate forming a thin layer of titanium oxide film.
The TiO2 film underwent high temperature (about 460 °C) for about 40 minutes to enhance film
strength and compactness. We studied the titanium dioxide infused with electrolyte, under light
and in a dark room for its conductivity. The conductivity of light intensity, wave length and
voltage were observed.
Document Page
The experiment steps were repeated severally using using titanium dioxide films of different
thicknesses.
Fill factor of the encapsulated dye sensitized solar cell and the energy conversion efficiency was
calculated as i8n the below formulae;
FF= ImaxVmax
IscVoc = Pmax
Pin
¿ FFIscVoc
Pin
Where FF is the Fill factor, Isc is the short circuit current, Voc is the voltage for open circuit, Pin
is the cell power input Imax is the maximum current obtained and Pmax is the maximum power
output observed.
Data analysis
Data was coded and analyzed using the Statistical Software for Statistics (SPSS).
Results
Descriptive statistics
Descriptive statistics analysis was carried out to provide a description of the data sets that were
obtained during the study.
Absorbance of flower extract dye on titanium dioxide.
The following data were observed from the experiment.
Wavelength (nm) Absorbance (a.u)
200 0.01
240 0.05
250 0.03
tabler-icon-diamond-filled.svg

Paraphrase This Document

Need a fresh take? Get an instant paraphrase of this document with our AI Paraphraser
Document Page
300 0.1
320 0.2
350 0.28
400 0.34
420 0.28
500 0.07
520 0.03
The variables wavelength and absorbance exhibit a positive upward association up to 400 nm.
Beyond 400 nm, a negative downward association is exhibited.
Document Page
The results depict that the absorption spectra of the dye extract were within the wavelength of
300 to 400 nm. The maximum absorption value was observed to be at 400 nm.
Results have shown that the dye absorbs light best at about 400 nm while the titanium dioxide
film best absorbs light within the range 300 to 400 nm.
Photoelectrochemical performance of dye-sensitized solar cell rom flower extracts
The below table depicts the photo-electrochemical performance of de-sensitized solar cells
(DSSCs) using flower extracts as dye sensitizer. The performance was measured by current-
voltage curves under solar irradiation with halogen lamb of 75 mW/cm2.
Voltage (volts) Current (MA)
0 15
0.05 14
0.1 11
0.15 9
0.23 7
0.28 6
0.35 5
0.42 4
0.47 2
0.5 0
Document Page
The below table presents descriptive statistics for the two variables; voltage and current. The
mean voltage is for the experiment was found to be 0.2550 and the mean current was found to be
7.30.
Statistics
Voltage (volts) Current (MA)
N Valid 10 10
Missing 0 0
Mean .2550 7.30
Median .2550 6.50
Mode .00a 0a
Std. Deviation .17822 4.945
Minimum .00 0
Maximum .50 15
a. Multiple modes exist. The smallest value is shown
Photoelectrochemical performance of dye-sensitized solar cell rom flower extracts line graph
tabler-icon-diamond-filled.svg

Paraphrase This Document

Need a fresh take? Get an instant paraphrase of this document with our AI Paraphraser
Document Page
Voltage at maximum power output was found to be 15 with a corresponding open circuit voltage
of 0. Short circuit current was found to be about 0.42 with corresponding maximum current
obtained to be about 4.
The curve shows that voltage and current are inversely associated. There is an inverse
proportionality between voltage and current.
Influence of thickness of electrode on cell efficiency
Thickness (μm) Voc (V) Isc (mA/cm2) FF (%) η(%)
6.3 0.63 3.33 0.73 2.33
5.9 0.65 3.21 0.63 2.25
5.2 0.68 2.97 0.59 2.22
4.4 0.71 2.88 0.61 1.90
4.2 0.72 2.62 0.63 1.72
3.8 0.76 2.45 0.67 1.56
2.9 0.75 2.30 0.71 1.32
1.0 0.73 1.92 0.68 1.17
0.7 0.79 1.34 0.72 0.88
The descriptive statistics for the variables in the above table are presented in the below table;
Descriptive Statistics
N Minimum Maximum Mean Std. Deviation
Thickness (μm) 9 .7 6.3 3.822 1.9810
Voc (V) 9 .63 .79 .7133 .05220
Document Page
Isc (mA/cm2) 9 1.34 3.33 2.5578 .63906
FF (%) 9 .59 .73 .6633 .05074
η(%) 9 .88 2.33 1.7056 .51566
Valid N (listwise) 9
The means for the variables were found to be 3.82, 0.71, 2.56, 0.66 and 1.71 for thickness, Voc,
Isc, FF and efficiency respectively.
Inferential statistics
Correlation and regression analysis were performed to assess the association between variables
of the study.
Correlation
Correlation analysis refers to a statistical tool that determines association between variables
involved in a study.
Results of correlation analysis performed are as shown below;
Correlations
Thickness (μm) Voc (V) Isc (mA/cm2) FF (%) η(%)
Thickness (μm) Pearson Correlation 1 -.852** .976** -.393 .973**
Sig. (2-tailed) .004 .000 .296 .000
N 9 9 9 9 9
Voc (V) Pearson Correlation -.852** 1 -.894** .264 -.917**
Sig. (2-tailed) .004 .001 .492 .001
N 9 9 9 9 9
Isc (mA/cm2) Pearson Correlation .976** -.894** 1 -.432 .977**
Sig. (2-tailed) .000 .001 .245 .000
N 9 9 9 9 9
FF (%) Pearson Correlation -.393 .264 -.432 1 -.477
Sig. (2-tailed) .296 .492 .245 .195
N 9 9 9 9 9
chevron_up_icon
1 out of 24
circle_padding
hide_on_mobile
zoom_out_icon
[object Object]