Analysis of Dynamic and Static Stretching on Soccer Performance
VerifiedAdded on 2020/03/16
|22
|3436
|45
Report
AI Summary
This report investigates the effects of dynamic and static stretching on the performance of soccer players, focusing on sit and reach, dribble test time, and keepy-up time pre-exercise protocols. The study involved 57 participants from academy, school team, and casual player groups. Data collection involved observation and questionnaires, with the T-Drill used to measure dribble and keepy-up times. The findings, presented through descriptive statistics, tables, and figures, analyze the physical characteristics of participants and the impact of different stretching methods on performance metrics. The research aims to determine how these pre-exercise protocols influence the output of athletes, providing insights for students, organizations, soccer players, and trainers, and contribute to the ongoing discussion on the optimal approach to stretching in soccer training and performance enhancement. The study found that the majority of the participants were of the height between 147-151 Centimetres, and weight between 35-40 Kgs.
Running Head: The Impacts Of Dynamic And Static Stretching On Performance 1
THE IMPACTS OF DYNAMIC AND STATIC STRETCHING ON THE PERFORMANCE
OF VARIOUS SOCCER PLAYER GROUPS.
by
Course:
Tutor:
University:
Department:
03 November 2017
THE IMPACTS OF DYNAMIC AND STATIC STRETCHING ON THE PERFORMANCE
OF VARIOUS SOCCER PLAYER GROUPS.
by
Course:
Tutor:
University:
Department:
03 November 2017
Paraphrase This Document
Need a fresh take? Get an instant paraphrase of this document with our AI Paraphraser
The Impacts Of Dynamic And Static Stretching On Performance 2
Table of Contents
CHAPTER ONE........................................................................................................................5
BACKGROUND INFORMATION...........................................................................................5
1.1 Introduction......................................................................................................................5
1.2 Statement of the Problem.................................................................................................5
1.3 Research Questions..........................................................................................................5
1.4 Rationale for the study......................................................................................................6
CHAPTER TWO.......................................................................................................................7
RESEARCH METHODOLOGY...............................................................................................7
2.1 Introduction......................................................................................................................7
2.2 Research Design...............................................................................................................7
2.3 Procedures........................................................................................................................7
2.3.1 Pre-exercise Protocols................................................................................................7
2.4 Study population...............................................................................................................8
2.5 Sample size.......................................................................................................................9
2.6 Data Collection Method...................................................................................................9
CHAPTER THREE..................................................................................................................11
DATA PRESENTATION, FINDINGS, AND ANALYSIS....................................................11
3.1 Introduction....................................................................................................................11
3.2 Descriptive statistics Analysis........................................................................................11
3.2.1 Physical characteristics of the participants..............................................................11
3.2.2 Player groups of respondents...................................................................................12
3.2.3 Descriptive results of the subjects in all warm-up tests...........................................13
3.2.5 Weight of the Respondents......................................................................................15
CHAPTER FOUR....................................................................................................................18
DISCUSSION..........................................................................................................................18
CONCLUSIONS......................................................................................................................18
RECOMMENDATIONS FOR FURTHER STUDIES............................................................18
References................................................................................................................................19
Appendices...............................................................................................................................21
Appendix 1: Descriptive Statistics of Each Warm-up Test..................................................21

The Impacts Of Dynamic And Static Stretching On Performance 3
LIST OF TABLES
Table 3.1 Physical characteristics of the participants..............................................................11
Table 3.2 Player groups of respondents...................................................................................12
Table 3.3 Descriptive results of the subjects in all warm-up tests...........................................13
Table 3.4 Height of the Respondents.......................................................................................14
Table 3.5 Weight of the Respondents......................................................................................15
⊘ This is a preview!⊘
Do you want full access?
Subscribe today to unlock all pages.
Trusted by 1+ million students worldwide
The Impacts Of Dynamic And Static Stretching On Performance 4
LIST OF FIGURES
Figure 2.1. Diagram of the T-Drill...........................................................................................10
Figure 3.1 Player groups of the participants............................................................................12
Figure 3.2 Heights of the Respondents....................................................................................14
Figure 3.3 Weights of the Respondents...................................................................................16
Paraphrase This Document
Need a fresh take? Get an instant paraphrase of this document with our AI Paraphraser
The Impacts Of Dynamic And Static Stretching On Performance 5
CHAPTER ONE
BACKGROUND INFORMATION
1.1 Introduction.
It is a common belief that static stretching boosts performance and reduces the possibility of
an injury risk (Costa et al., 2013). However, recent studies suggest that a routine stretching
inhibits the total force production by the stretched muscle (Kay& Blazevich, 2012; Simic,
Sarabon, & Markovic, 2013; Herman et al., 2012) and in some cases the performance of
vertical jump impaired (Carvalho et al., 2012 and Behm & Chaouachi, 2011) and not in other
instances (Carvalho et al., 2012).
1.2 Statement of the Problem
Study outcomes that differential stretching is harmful to the generation of force have given
rise to recommendations that static stretching is replaced with dynamic stretching during pre-
exercise (Henschke & Lin, 2011 and Amiri-Khorasani et al., 2011). However, there exists
little research on the impacts of specific types of stretching on the physical performance of
soccer players. Thus, this study will examine the implications of sit and reach, dribble test
time and keepy-up time pre-exercise protocols on the output of athletes.
1.3 Research Questions
1. Does sit and reach affect the performance of different soccer player groups?
2. What is the impact of dribble test time on the performance of various soccer player
groups?
3. How does keepy-up time affect the performance of different soccer player groups?

The Impacts Of Dynamic And Static Stretching On Performance 6
1.4 Rationale for the study
This study will be of importance to students, organizations, soccer players and trainers and to
other parties that may want to carry out a similar research.
1.4 Rationale for the study
This study will be of importance to students, organizations, soccer players and trainers and to
other parties that may want to carry out a similar research.
⊘ This is a preview!⊘
Do you want full access?
Subscribe today to unlock all pages.
Trusted by 1+ million students worldwide
The Impacts Of Dynamic And Static Stretching On Performance 7
CHAPTER TWO
RESEARCH METHODOLOGY
2.1 Introduction
Research methodology is the means of generating responses to the research questions
(Woldemichael, 2012). This section provides a summary on how the survey was carried out:
the research design, measurement of variables, sampling method, sample size, methods of
data collection and analysis.
2.2 Research Design
Permission for the school team and academy players was sought before the analysis from the
More House State University. The warm-up procedures were randomized in repeated
measures but in the parameters under consideration (Brukner, 2012). The T-Drill dimensions
markers employed were also measured and demarcated as per the subjects under study (Raya
et al., 2013). The participants were grouped according to soccer group namely academy
players, school team and casual players.
2.3 Procedures
The measure analysis used followed a repeated design since all the respondents underwent all
the protocols. The first session consisted of familiarization and attempt of randomly assigned
protocols. They were guided on the testing procedure of the T-Drill after which the best T-
Drill time for analysis was obtained from the randomized trials. The rest of the protocols
were carried out by the participants with an interval of 1 min period of rest after the protocol
followed by two T-Drill tests.
2.3.1 Pre-exercise Protocols
A general 2-min jog was carried out for all the protocols as a warm-up. The time taken in
seconds for each test was taken 1-min after each successful completion of the pre-exercise
Paraphrase This Document
Need a fresh take? Get an instant paraphrase of this document with our AI Paraphraser
The Impacts Of Dynamic And Static Stretching On Performance 8
protocols. An automatic timer was used to measure The T-Drill timer which was stopped and
started the moment the single laser light beam was broken by the participant at the
beginning/end line. Furthermore, the T-Drill was only used for the dribble and keepy-up tests
while the sit and reach test was carried out in open field.
The sit and reach test
This protocol comprised of a self-paced 2-min jog followed by two trials with an interlude of
1-min rest between the attempts. Then the sprint time was measured in seconds and recorded.
The dependent measure was the sprint time test.
The dribble test
The dribble protocol comprised of two complete trials and the best were chosen for analysis.
The participant was allowed to run with the ball at equal distances and bypass the set cones
and the time taken recorded in seconds.
The Keepy-up
The Keepy-up protocol also consisted of two complete trials and the best selected for
analysis. The participant was to keepy-up the ball over equal distances and the time taken
recorded. The same procedure was repeated and the sprint time test carried out at the start and
the end of the protocol. The sit and reach, keepy-up time and dribble time were the dependent
variables whereas the player group was the independent variable.
2.4 Study population
The target population was 150 individual soccer players. The participant groups were of
different levels of activity and were free from any ankle or knee injuries and had no medical
history of such cases.
The Impacts Of Dynamic And Static Stretching On Performance 9
2.5 Sample size
The study used a random sampling method to select the sample for the study. A sample of 57
respondents was thus chosen from the target population. The sample was further categorized
into the academy, school team, and casual players. Their height was 137+-16 cm, weight, and
29+-15 Kg.
2.6 Data Collection Method
The survey gathered primary data through observation, and use of simple questionnaires with
close-ended questions. The T-Drill was used to measure dribble and keepy-up time.
T-Drill
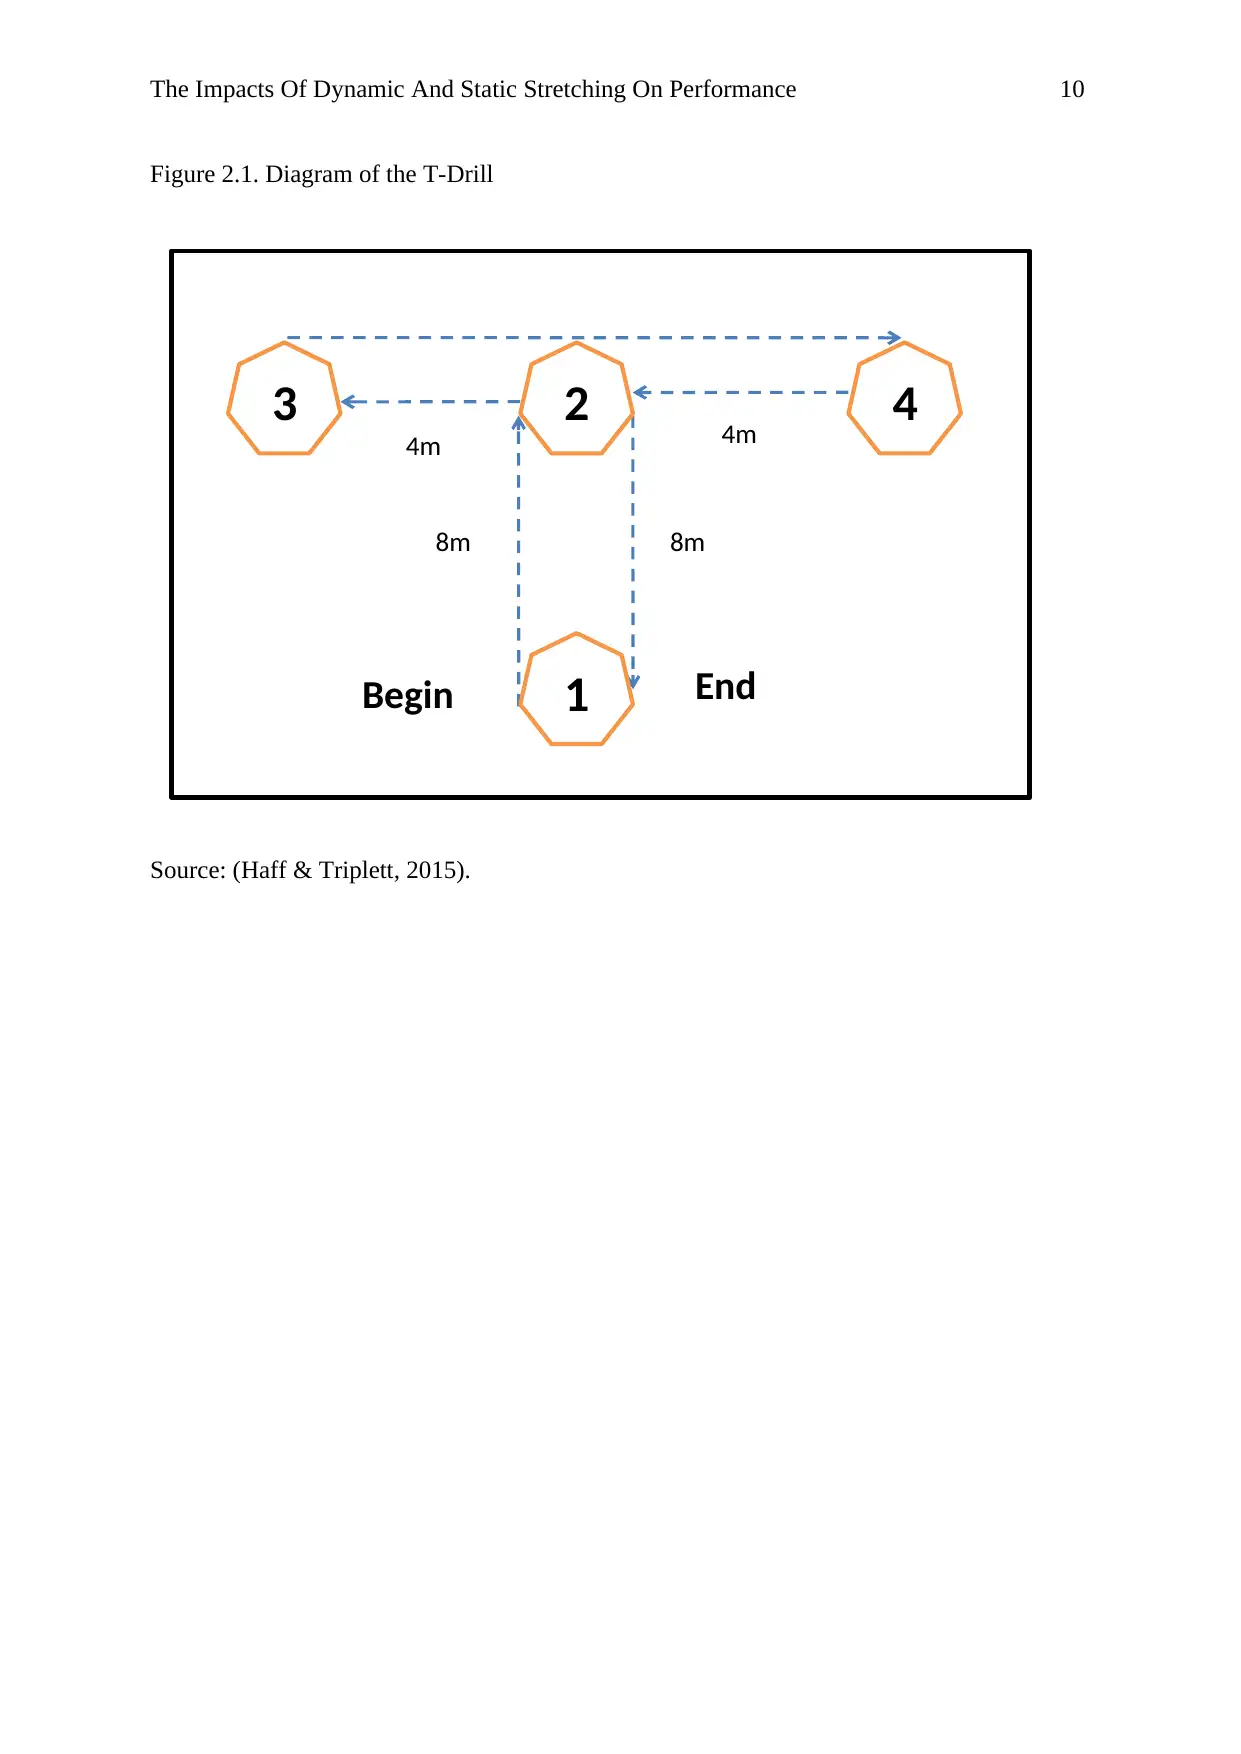
The procedure for T-Drill involved the participant beginning at cone#1. At the blow of a
whistle, the participant started dribbling the ball to cone#two covering 8m. Then, the
participant will cover 4m dribbling to the third cone, then shuffle 8m to cone #4. After the
participant has shuffled 4m to the second cone, the participant will again dribble 8m to the
finish line the point at which time is noted. After one minute rest, the participant will
undertake keepy-up test and time is recorded at the finish line. Figure 1 shows the T-Drill
with its dimensions. The T-Drill was invented by Raya et al. (2013) as a dependable and
useful analyst of dexterity leg power and swiftness in institution athletes.
2.5 Sample size
The study used a random sampling method to select the sample for the study. A sample of 57
respondents was thus chosen from the target population. The sample was further categorized
into the academy, school team, and casual players. Their height was 137+-16 cm, weight, and
29+-15 Kg.
2.6 Data Collection Method
The survey gathered primary data through observation, and use of simple questionnaires with
close-ended questions. The T-Drill was used to measure dribble and keepy-up time.
T-Drill
The procedure for T-Drill involved the participant beginning at cone#1. At the blow of a
whistle, the participant started dribbling the ball to cone#two covering 8m. Then, the
participant will cover 4m dribbling to the third cone, then shuffle 8m to cone #4. After the
participant has shuffled 4m to the second cone, the participant will again dribble 8m to the
finish line the point at which time is noted. After one minute rest, the participant will
undertake keepy-up test and time is recorded at the finish line. Figure 1 shows the T-Drill
with its dimensions. The T-Drill was invented by Raya et al. (2013) as a dependable and
useful analyst of dexterity leg power and swiftness in institution athletes.
⊘ This is a preview!⊘
Do you want full access?
Subscribe today to unlock all pages.
Trusted by 1+ million students worldwide
The Impacts Of Dynamic And Static Stretching On Performance 10
Figure 2.1. Diagram of the T-Drill
Figure 1Figure 2.1. Diagram of the T-Drill
Source: (Haff & Triplett, 2015).
4m4m
8m 8m
EndBegin 1
423
Figure 2.1. Diagram of the T-Drill
Figure 1Figure 2.1. Diagram of the T-Drill
Source: (Haff & Triplett, 2015).
4m4m
8m 8m
EndBegin 1
423
Paraphrase This Document
Need a fresh take? Get an instant paraphrase of this document with our AI Paraphraser
The Impacts Of Dynamic And Static Stretching On Performance 11
CHAPTER THREE
DATA PRESENTATION, FINDINGS, AND ANALYSIS
3.1 Introduction
This section comprises of mainly descriptive statistical analysis accomplished with the use of
Statistical Package for Social Science software (SPSS-10).
3.2 Descriptive statistics Analysis
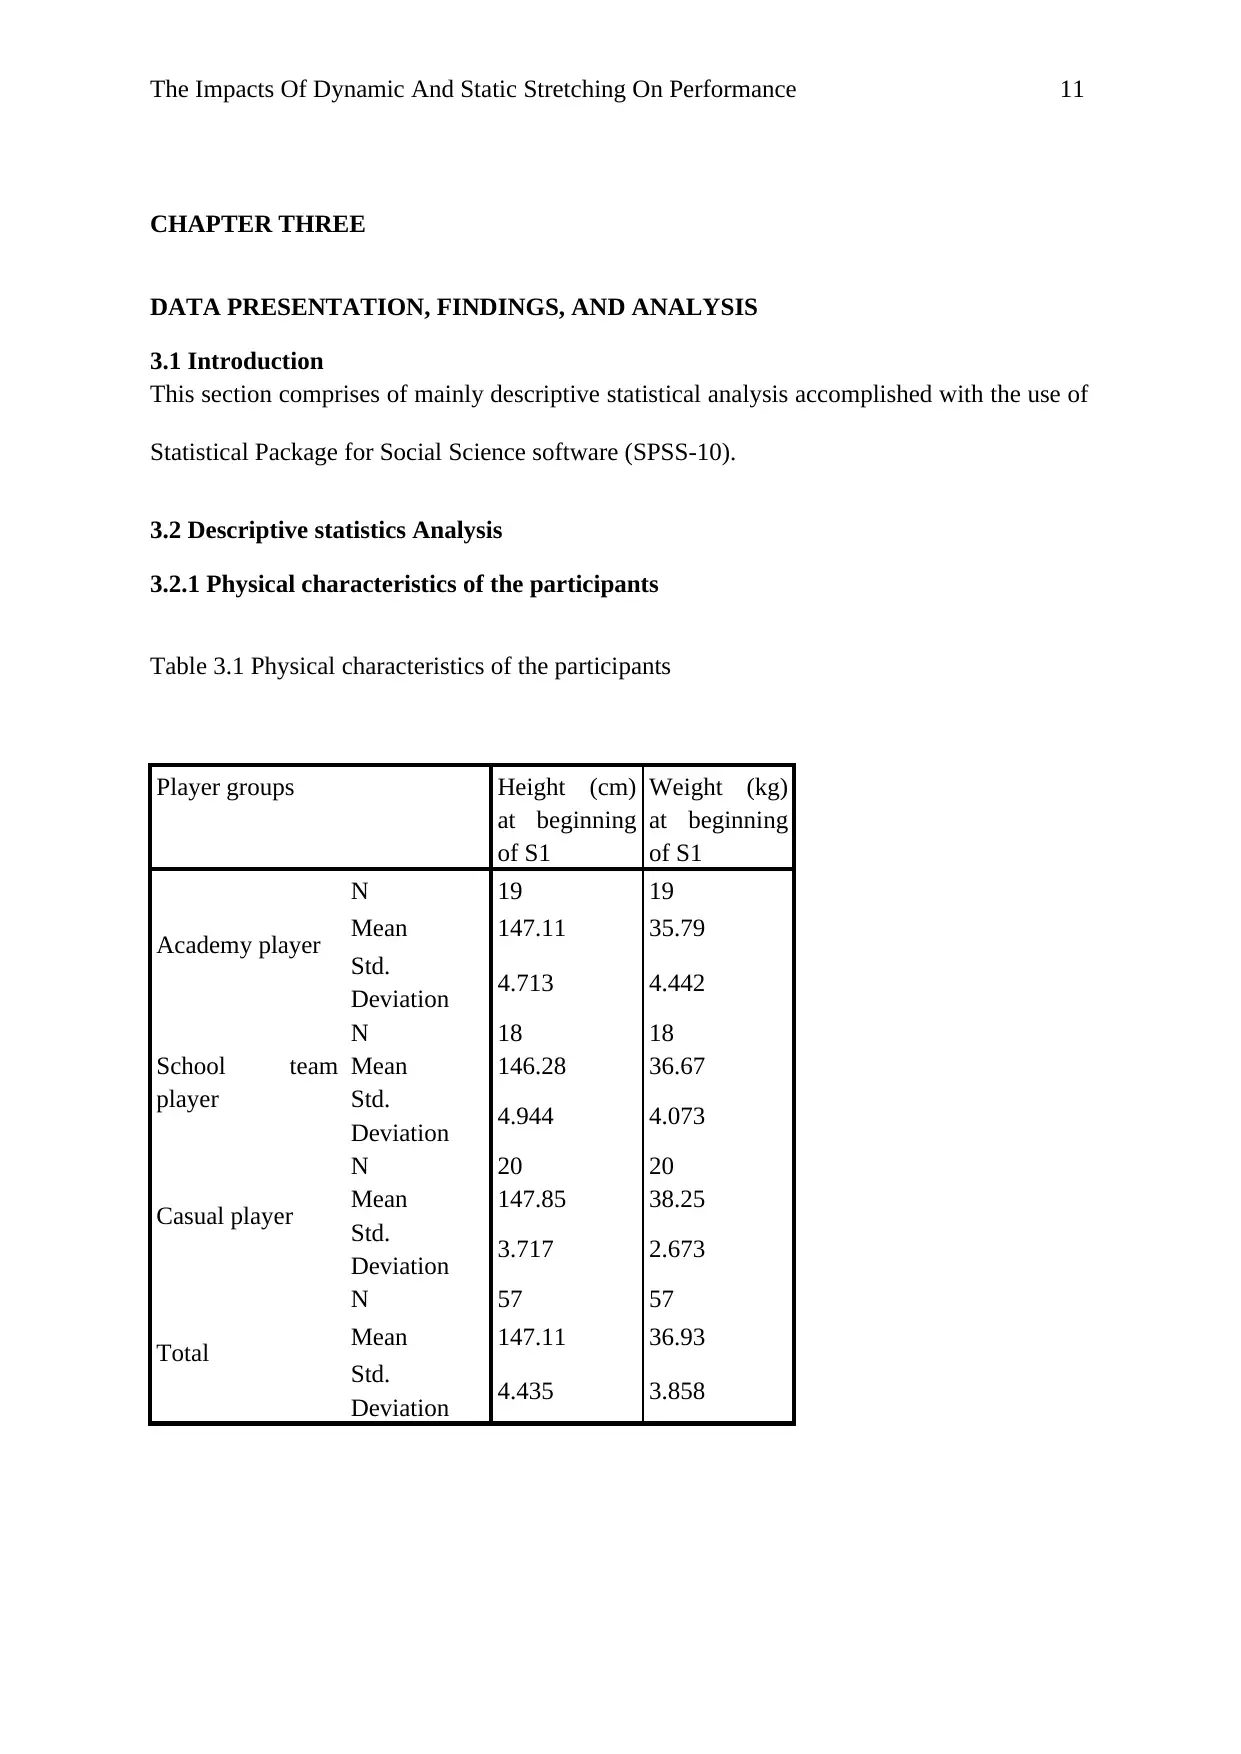
3.2.1 Physical characteristics of the participants
Table 1Table 3.1 Physical characteristics of the participants
Table 3.1 Physical characteristics of the participants
Player groups Height (cm)
at beginning
of S1
Weight (kg)
at beginning
of S1
Academy player
N 19 19
Mean 147.11 35.79
Std.
Deviation 4.713 4.442
School team
player
N 18 18
Mean 146.28 36.67
Std.
Deviation 4.944 4.073
Casual player
N 20 20
Mean 147.85 38.25
Std.
Deviation 3.717 2.673
Total
N 57 57
Mean 147.11 36.93
Std.
Deviation 4.435 3.858
CHAPTER THREE
DATA PRESENTATION, FINDINGS, AND ANALYSIS
3.1 Introduction
This section comprises of mainly descriptive statistical analysis accomplished with the use of
Statistical Package for Social Science software (SPSS-10).
3.2 Descriptive statistics Analysis
3.2.1 Physical characteristics of the participants
Table 1Table 3.1 Physical characteristics of the participants
Table 3.1 Physical characteristics of the participants
Player groups Height (cm)
at beginning
of S1
Weight (kg)
at beginning
of S1
Academy player
N 19 19
Mean 147.11 35.79
Std.
Deviation 4.713 4.442
School team
player
N 18 18
Mean 146.28 36.67
Std.
Deviation 4.944 4.073
Casual player
N 20 20
Mean 147.85 38.25
Std.
Deviation 3.717 2.673
Total
N 57 57
Mean 147.11 36.93
Std.
Deviation 4.435 3.858
The Impacts Of Dynamic And Static Stretching On Performance 12
The physical characteristics of the participants regarding height (cm) and weight (kg) of all
the 57 respondents from the three-player groups were recorded. The descriptive data of the
physical features of the respondents were displayed as shown in Table 4.1.
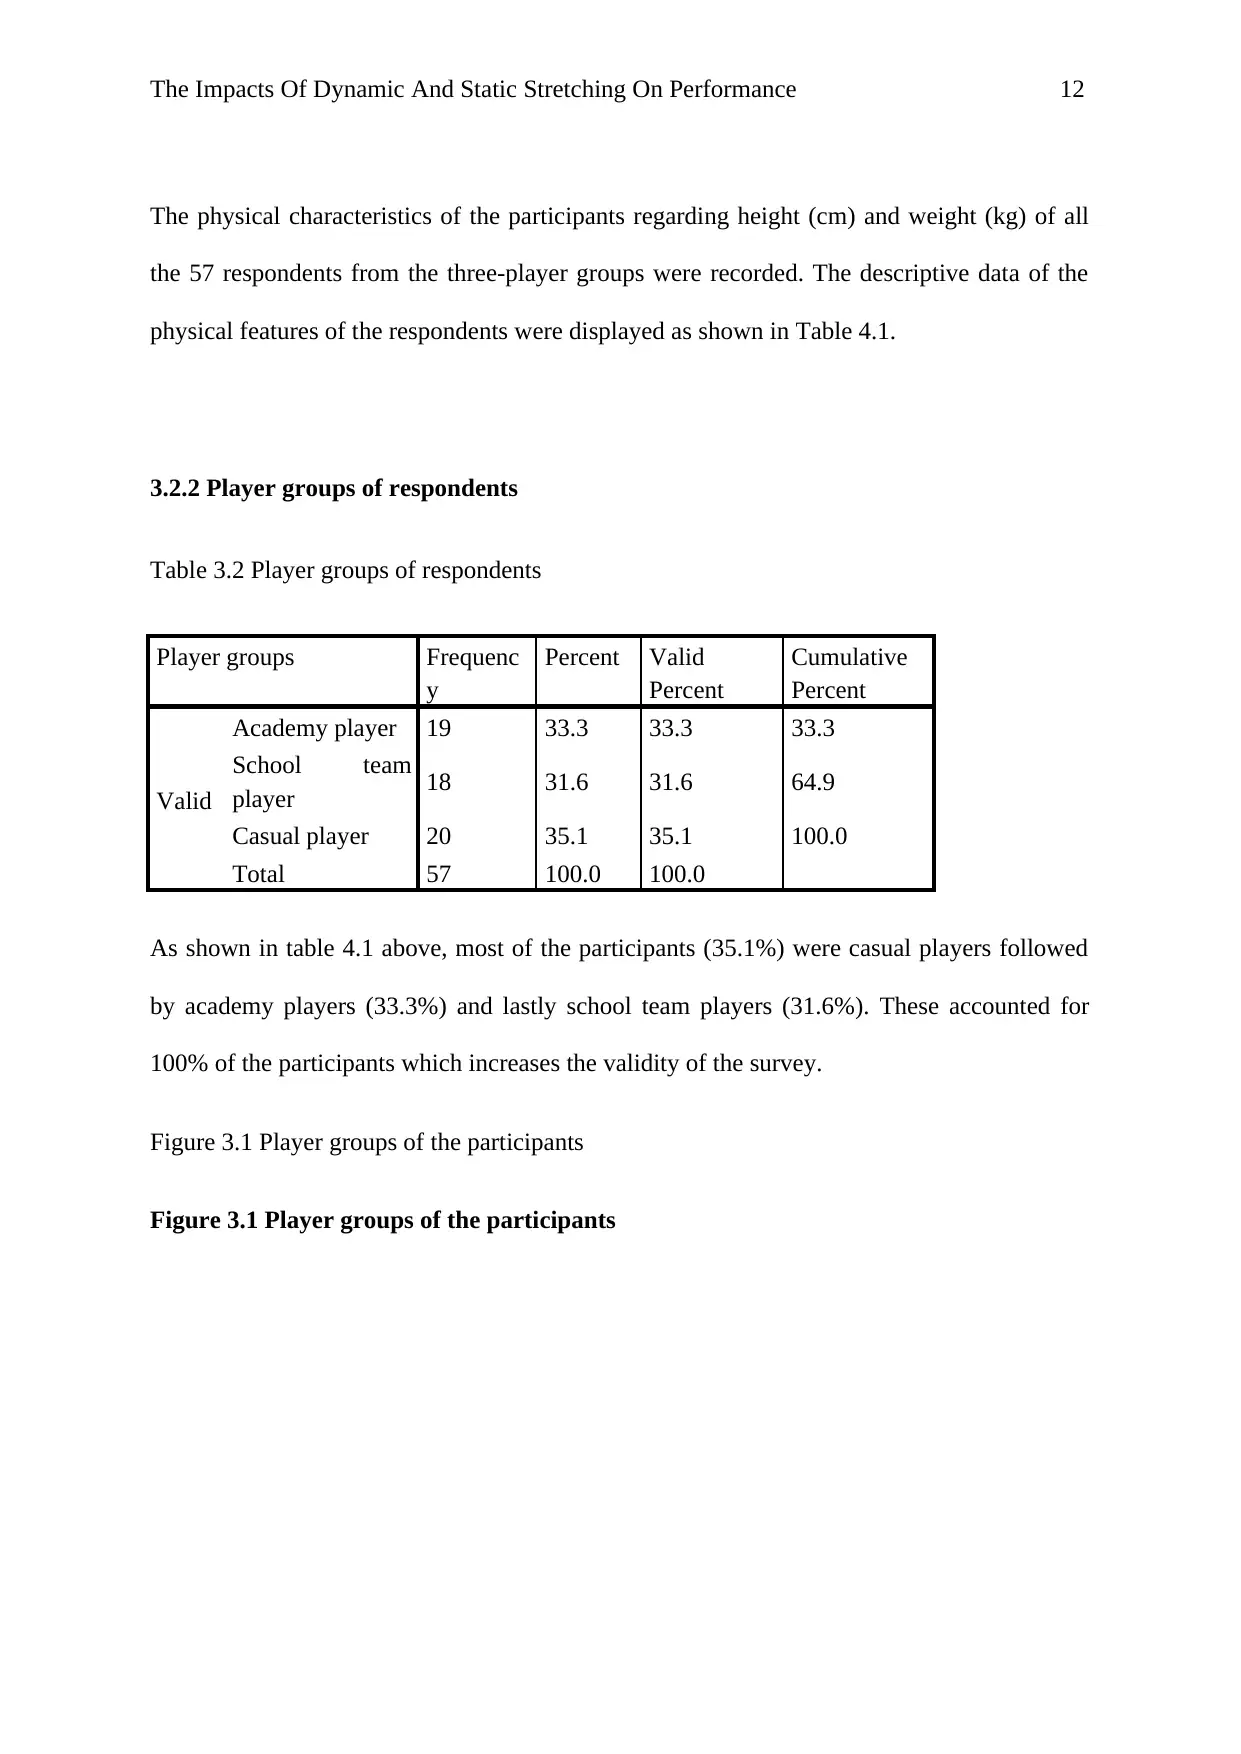
3.2.2 Player groups of respondents
Table 2 Table 3.2 Player groups of respondents
Table 3.2 Player groups of respondents
Player groups Frequenc
y
Percent Valid
Percent
Cumulative
Percent
Valid
Academy player 19 33.3 33.3 33.3
School team
player 18 31.6 31.6 64.9
Casual player 20 35.1 35.1 100.0
Total 57 100.0 100.0
As shown in table 4.1 above, most of the participants (35.1%) were casual players followed
by academy players (33.3%) and lastly school team players (31.6%). These accounted for
100% of the participants which increases the validity of the survey.
Figure 3.1 Player groups of the participants
Figure 3.1 Player groups of the participants
Figure 2 Figure 3.1 Player groups of the participants
The physical characteristics of the participants regarding height (cm) and weight (kg) of all
the 57 respondents from the three-player groups were recorded. The descriptive data of the
physical features of the respondents were displayed as shown in Table 4.1.
3.2.2 Player groups of respondents
Table 2 Table 3.2 Player groups of respondents
Table 3.2 Player groups of respondents
Player groups Frequenc
y
Percent Valid
Percent
Cumulative
Percent
Valid
Academy player 19 33.3 33.3 33.3
School team
player 18 31.6 31.6 64.9
Casual player 20 35.1 35.1 100.0
Total 57 100.0 100.0
As shown in table 4.1 above, most of the participants (35.1%) were casual players followed
by academy players (33.3%) and lastly school team players (31.6%). These accounted for
100% of the participants which increases the validity of the survey.
Figure 3.1 Player groups of the participants
Figure 3.1 Player groups of the participants
Figure 2 Figure 3.1 Player groups of the participants
⊘ This is a preview!⊘
Do you want full access?
Subscribe today to unlock all pages.
Trusted by 1+ million students worldwide
1 out of 22
Related Documents


Your All-in-One AI-Powered Toolkit for Academic Success.
+13062052269
info@desklib.com
Available 24*7 on WhatsApp / Email
![[object Object]](/_next/static/media/star-bottom.7253800d.svg)
Unlock your academic potential
Copyright © 2020–2026 A2Z Services. All Rights Reserved. Developed and managed by ZUCOL.