Metrics, Earned Value, and Project Performance: A Detailed Report
VerifiedAdded on 2023/01/23
|8
|2161
|92
Report
AI Summary
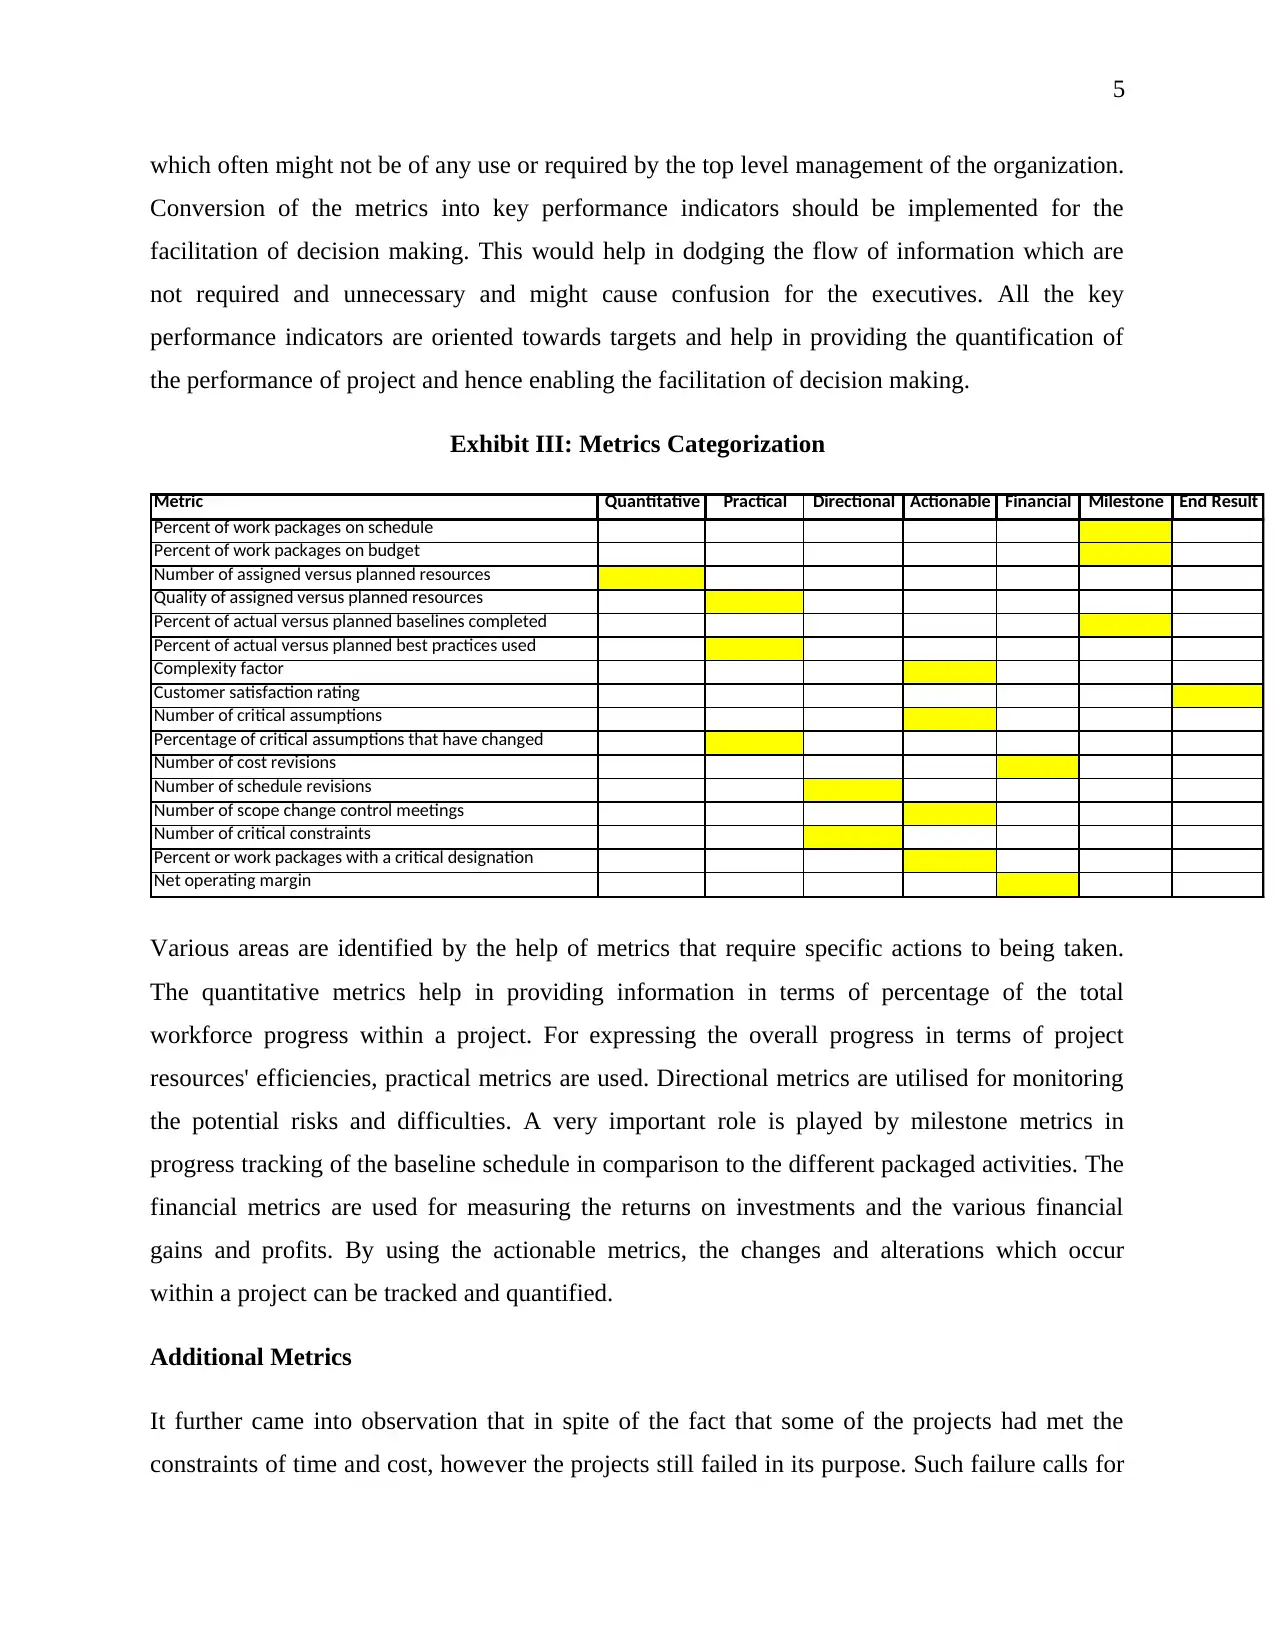
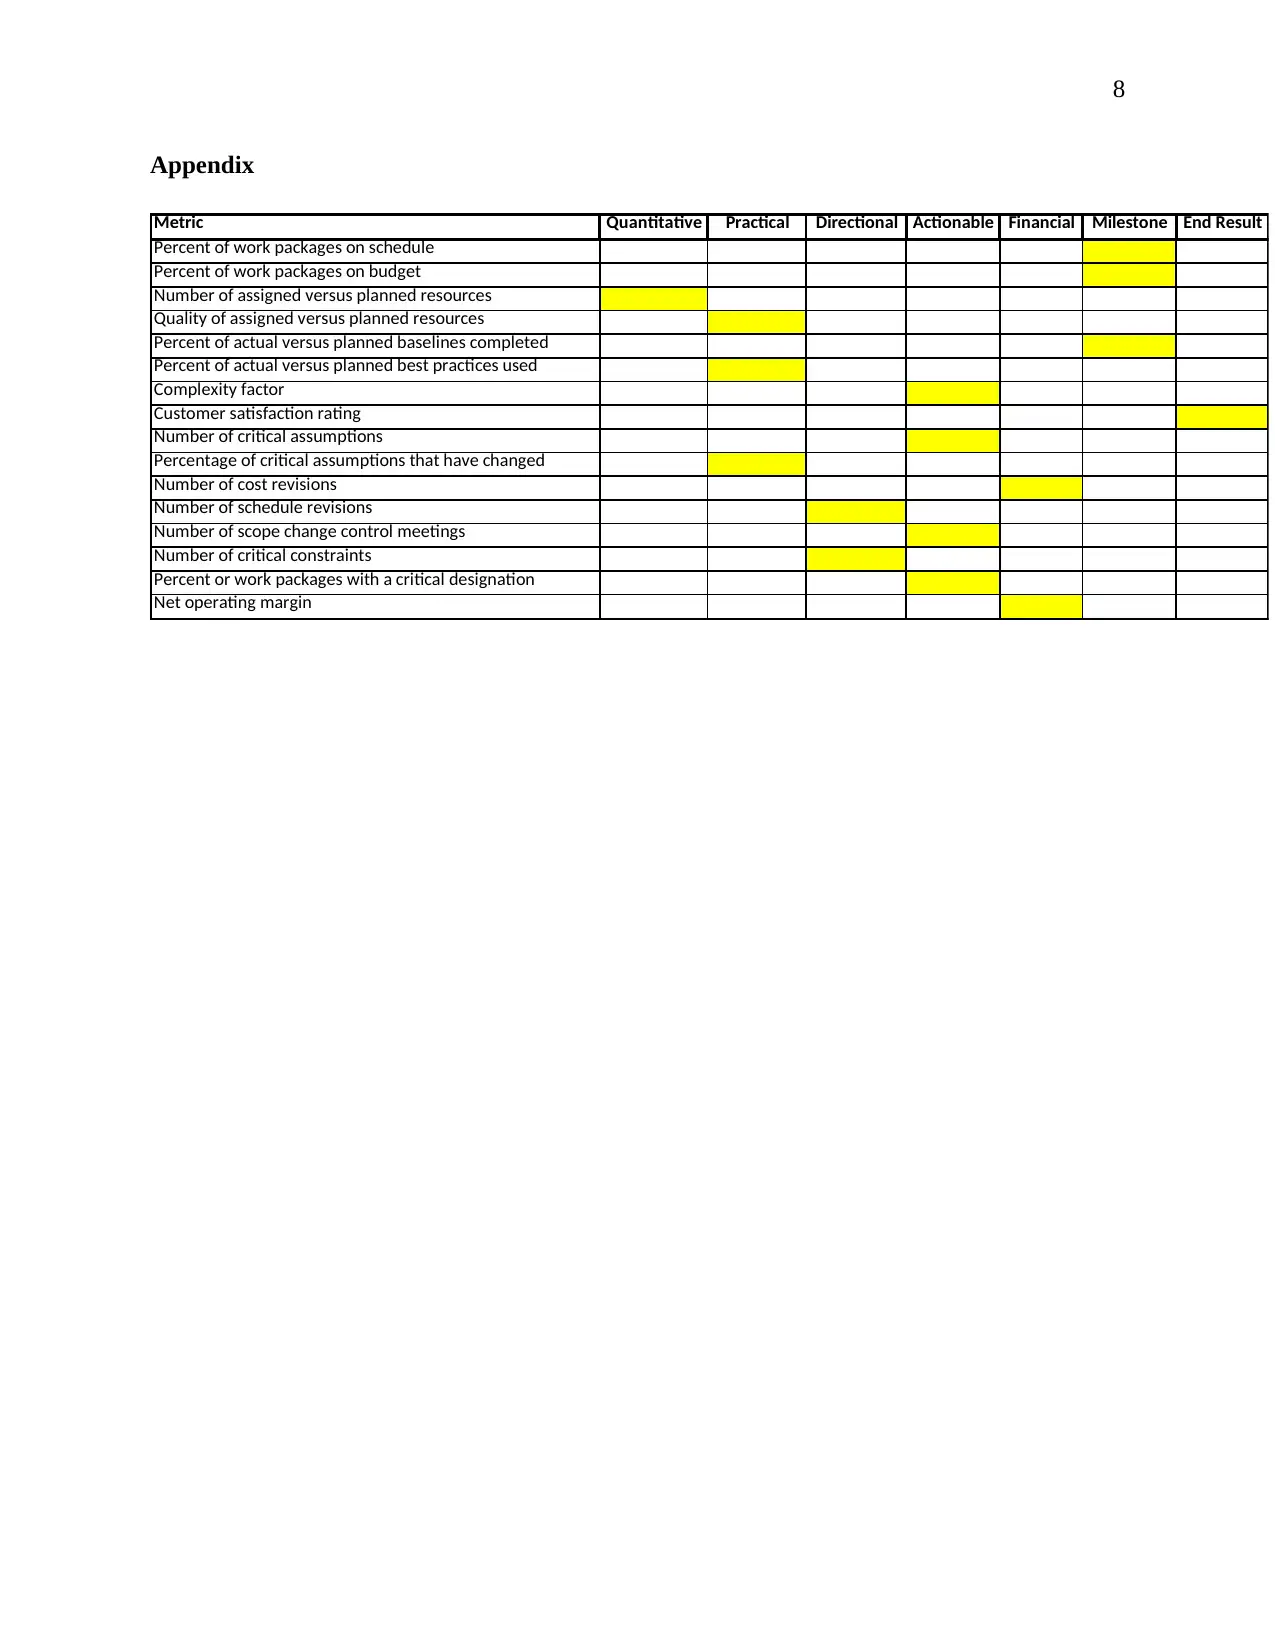
This report delves into the application of Earned Value Management (EVM) and project metrics within a research and development company facing financial losses due to ineffective project tracking. The analysis highlights the importance of incorporating comprehensive metrics beyond financial aspects, emphasizing the need for a committee-driven approach to define relevant Key Performance Indicators (KPIs). It discusses the challenges of balancing the number of metrics to avoid overwhelming employees while ensuring sufficient data for informed decision-making. The report categorizes metrics (quantitative, practical, directional, actionable, financial, milestone, and end result) and addresses the introduction of value-based and alert metrics, along with the significance of internal audits and executive training for proper interpretation. The report underscores the crucial role of metrics in anticipating risks, improving project outcomes, and aligning projects with client requirements, ultimately advocating for a strategic approach to project management measurement and evaluation.

1
Metrics
Metrics
Secure Best Marks with AI Grader
Need help grading? Try our AI Grader for instant feedback on your assignments.

2
Table of Contents
Interpretation of earned value data..................................................................................................3
Metrics.............................................................................................................................................3
Additional Metrics...........................................................................................................................6
Reference list...................................................................................................................................8
Appendix..........................................................................................................................................9

3
Interpretation of earned value data
The Earned Value Management (EVM) is a method of accurately and precisely dealing with
estimation and joining of specialized achievements, calendar and cost on an errand or an
undertaking. EVM provides workers and managers with the capacity of measuring basic system,
cost information, turning points and information related to projects (Kerzner, 2013). However on
the contrary, earned value helps in the incorporation of cost estimation, risk management
timetable and project scope. Project performance evaluation and target appraisal are permitted by
earned value management. According to De Marco and Narbaev (2013), earned value
management helps in the prediction of execution, defects as well as project timeline
restructuring. An estimation standard which helps in surveying the items, effectiveness,
execution, progress, undertaking, procedure, profitability or nature of a deliverable, is
characterized as a metric. Iacovou, Thompson and Smith (2009) have opined in their work that
measurements help in the layout of patterns, enhancement of basic capacities of leadership and
for building consistency. Hence, it can be said that a roadmap is created by project measurement
for the evaluation and completion of tasks. However, the significant tools of measurement help
in enhancing and improving the analysis of reliability and quality. Therefore, the procedure of
establishment of significant metrics helps in the facilitation of completion of tasks.
Flyvbjerg (2013) suggests that the directors are empowered for evaluation of progressing venture
status by project measurements on the basis of expense, benefit, and task defect and work
schedules. As a result, the measurements of project administration help in the empowerment of
project directors towards the anticipation of the potential dangers and risks (Pavlak, 2004).
Metrics
A research and development company is presented in the case study that has been shared by
Kerzner (2013). The organization has recently gone through huge financial losses because of
failed projects. The main fact of concern is that negative project trends were not reported. As a
consequence of such non-reporting of trends, the budgeted amount for projects was almost spent
by the company without any affirmative result or outcome. In terms of finance, approximately
US $24 million were lost by the company. Such a loss could have been decreased the tracking
and reporting system had been effective and accurate. After observation, it came into notice that

4
only the financial aspects were addressed by project management office’s metrics which were
implemented. Hence, it was decided to conduct an incorporation of such metrics since they were
based on the project. As a result, this gave rise to the need for implementation and development
of significant metrics which help in ensuring that the actual status of project is communicated to
the top level management.
Now, for reaching a set metrics that would help in addressing all of the areas of concern, a
committee constituted of representatives taken from each of the department was framed. It was
noticed that there are various risks of reporting too many metrics. When too many metrics and
more than needed details are given in metrics it makes the employees quite uncomfortable. There
as a sense of resistance and hesitation from the top level of management of the company towards
the employees as the former had a feeling of being spied upon. It was quite difficult for the
executives for agreeing upon a specific number of metrics which is fixed. Such difficulty was
mainly because variances and differences were found in the specific requirements of the
executives. As a result, it caused the formation of big list of metrics. However, there was a
mutual agreement of cutting short of the metrics since presence of too many or more than
required metrics would cause wastage of project team’s precious time and efforts. A compromise
is needed between other related activities of the project and too much time spent on
acknowledgment of the metrics. Such compromise potentially affects the project quality. It
becomes very difficult for the top level of management for focusing upon the critical and
important issues hen too much information is provided related to metrics. Therefore, it is
recommended to report only a small amount of metrics which would help to highlight those
issues first which require action on immediate basis.
In contrast to the above, if the number of metrics reported in the project is extremely less, the
primary purpose of metrics development would not be achieved. The actual picture of a project
cannot be portrayed in a correct manner if only a minimum number of metrics are reported and
as such the executives of the company would become liable for drawing a different kind of
understanding which would obviously be hazardous and harmful for the project. A good solution
for such a situation is that the selection of the metrics should be done on the categorization basis
which has been suggested by Kerzner (2013a). Another necessary metrics aspect which should
be taken into consideration is a specific level of information in detail is provided by metrics
Secure Best Marks with AI Grader
Need help grading? Try our AI Grader for instant feedback on your assignments.

5
which often might not be of any use or required by the top level management of the organization.
Conversion of the metrics into key performance indicators should be implemented for the
facilitation of decision making. This would help in dodging the flow of information which are
not required and unnecessary and might cause confusion for the executives. All the key
performance indicators are oriented towards targets and help in providing the quantification of
the performance of project and hence enabling the facilitation of decision making.
Exhibit III: Metrics Categorization
Metric Quantitative Practical Directional Actionable Financial Milestone End Result
Percent of work packages on schedule
Percent of work packages on budget
Number of assigned versus planned resources
Quality of assigned versus planned resources
Percent of actual versus planned baselines completed
Percent of actual versus planned best practices used
Complexity factor
Customer satisfaction rating
Number of critical assumptions
Percentage of critical assumptions that have changed
Number of cost revisions
Number of schedule revisions
Number of scope change control meetings
Number of critical constraints
Percent or work packages with a critical designation
Net operating margin
Various areas are identified by the help of metrics that require specific actions to being taken.
The quantitative metrics help in providing information in terms of percentage of the total
workforce progress within a project. For expressing the overall progress in terms of project
resources' efficiencies, practical metrics are used. Directional metrics are utilised for monitoring
the potential risks and difficulties. A very important role is played by milestone metrics in
progress tracking of the baseline schedule in comparison to the different packaged activities. The
financial metrics are used for measuring the returns on investments and the various financial
gains and profits. By using the actionable metrics, the changes and alterations which occur
within a project can be tracked and quantified.
Additional Metrics
It further came into observation that in spite of the fact that some of the projects had met the
constraints of time and cost, however the projects still failed in its purpose. Such failure calls for

6
value based metrics introduction that help in ensuring that the requirements of the clients are
readily met by the project. Another problem which was observed by the executives was that
reason for the cancellation of the number of projects being poor performance was limited and
minimal. Instead, the main reasons for the cancellation of projects turned out to be a lack of trust
between the middle level and lower level of management and a huge delay in the involvement of
the top level management. On one hand, the clients did not wish to cancel the project, while on
the other hand project teams were frightened of being blamed for their poor performances. This
was the reason that a third party, the exit champion was introduced for cancelling the project
even though it had no stakes within the project. It is suggested by Kernzer (2013b) that the
utilisation of alert metrics should be considered for the indication of a situation where the project
has already gone out of hands and is no more within the acceptable tolerance levels.
Internal audits should be conducted within regular intervals during the timeline of the project for
ensuring the correctness of the information which is forwarded towards the top level of
management by the means of metrics (Meredith and Mantel, 2013). Metrics are categorized on
the basis of project management, project, finance and success (Kerzner, 2013b). The growth rate
of the sales is addressed by the metrics which is based on finance. Such growth rate of sales was
demanded by the chief executive officer when it was observed by him that profit making
potentials have been shown by the organization and specific matrices were required by the
business expansion for being incorporated and developed within the system of the company.
There is a need for special care to be taken in the selection of metrics and significant steps should
be taken for executives' training in order to ensure that the interpretation of metrics can be done
by them properly. The metrics should be worth collecting and informative. While finalising the
incorporation of the specific metrics within the system, having a list of priorities is
recommended. Information that is consisted within a metric should be considerably valuable to
the senior level management since such kind of information is required for decision making.
According to Brown (2014), only a limited metrics related to business exist which are
considerably valuable since most of them only posses a limited value of information. These
kinds of metrics should not be avoided as they might cause unnecessary activities of
measurement within the project team and hence wasting the valuable money as well as time.

7
Reference list
Brown, B., 2014. 1. 3. 2 Behavioral Economics and the Design of Systems Engineering
Measures. In INCOSE International Symposium (Vol. 24, No. 1, pp. 58-66).
De Marco, A. and Narbaev, T., 2013. Earned value-based performance monitoring of facility
construction projects. Journal of facilities Management, 11(1), pp.69-80.
Flyvbjerg, B., 2013. Quality control and due diligence in project management: Getting decisions
right by taking the outside view. International Journal of Project Management, 31(5), pp.760-
774.
Iacovou, C.L., Thompson, R.L. & Smith, H.J., 2009. Selective status reporting in information
systems projects: a dyadic-level investigation. MIS Quarterly, 33 (4), pp. 785-810.
Kerzner, H.R., 2013a. Project management case studies. 4th ed. Hoboken, NJ, USA: John Wiley
& Sons. p. 411 – 425.
Kerzner, H.R., 2013b. Project management metrics, KPIs, and dashboards: a guide to
measuring and monitoring project performance. 2nd edition. New York, USA: John Wiley &
Sons. p.81-117.
Meredith, J.R. & Mantel, S.J. (2012) Project management: a managerial approach. 8th ed. New
Jersey, USA: John Wiley & Sons. p. 450-457.
Pavlak, A., 2004. Project troubleshooting: Tiger Teams for reactive risk management. Project
Management Journal. 35 (4), pp. 5-14.
Paraphrase This Document
Need a fresh take? Get an instant paraphrase of this document with our AI Paraphraser

8
Appendix
Metric Quantitative Practical Directional Actionable Financial Milestone End Result
Percent of work packages on schedule
Percent of work packages on budget
Number of assigned versus planned resources
Quality of assigned versus planned resources
Percent of actual versus planned baselines completed
Percent of actual versus planned best practices used
Complexity factor
Customer satisfaction rating
Number of critical assumptions
Percentage of critical assumptions that have changed
Number of cost revisions
Number of schedule revisions
Number of scope change control meetings
Number of critical constraints
Percent or work packages with a critical designation
Net operating margin
1 out of 8
Related Documents

Your All-in-One AI-Powered Toolkit for Academic Success.
+13062052269
info@desklib.com
Available 24*7 on WhatsApp / Email
Unlock your academic potential
© 2024 | Zucol Services PVT LTD | All rights reserved.